Name:
Class:
Date:
Chapter 19: International Trade
a.
c + h
b.
h
c.
c
d.
c + g
e.
g
c
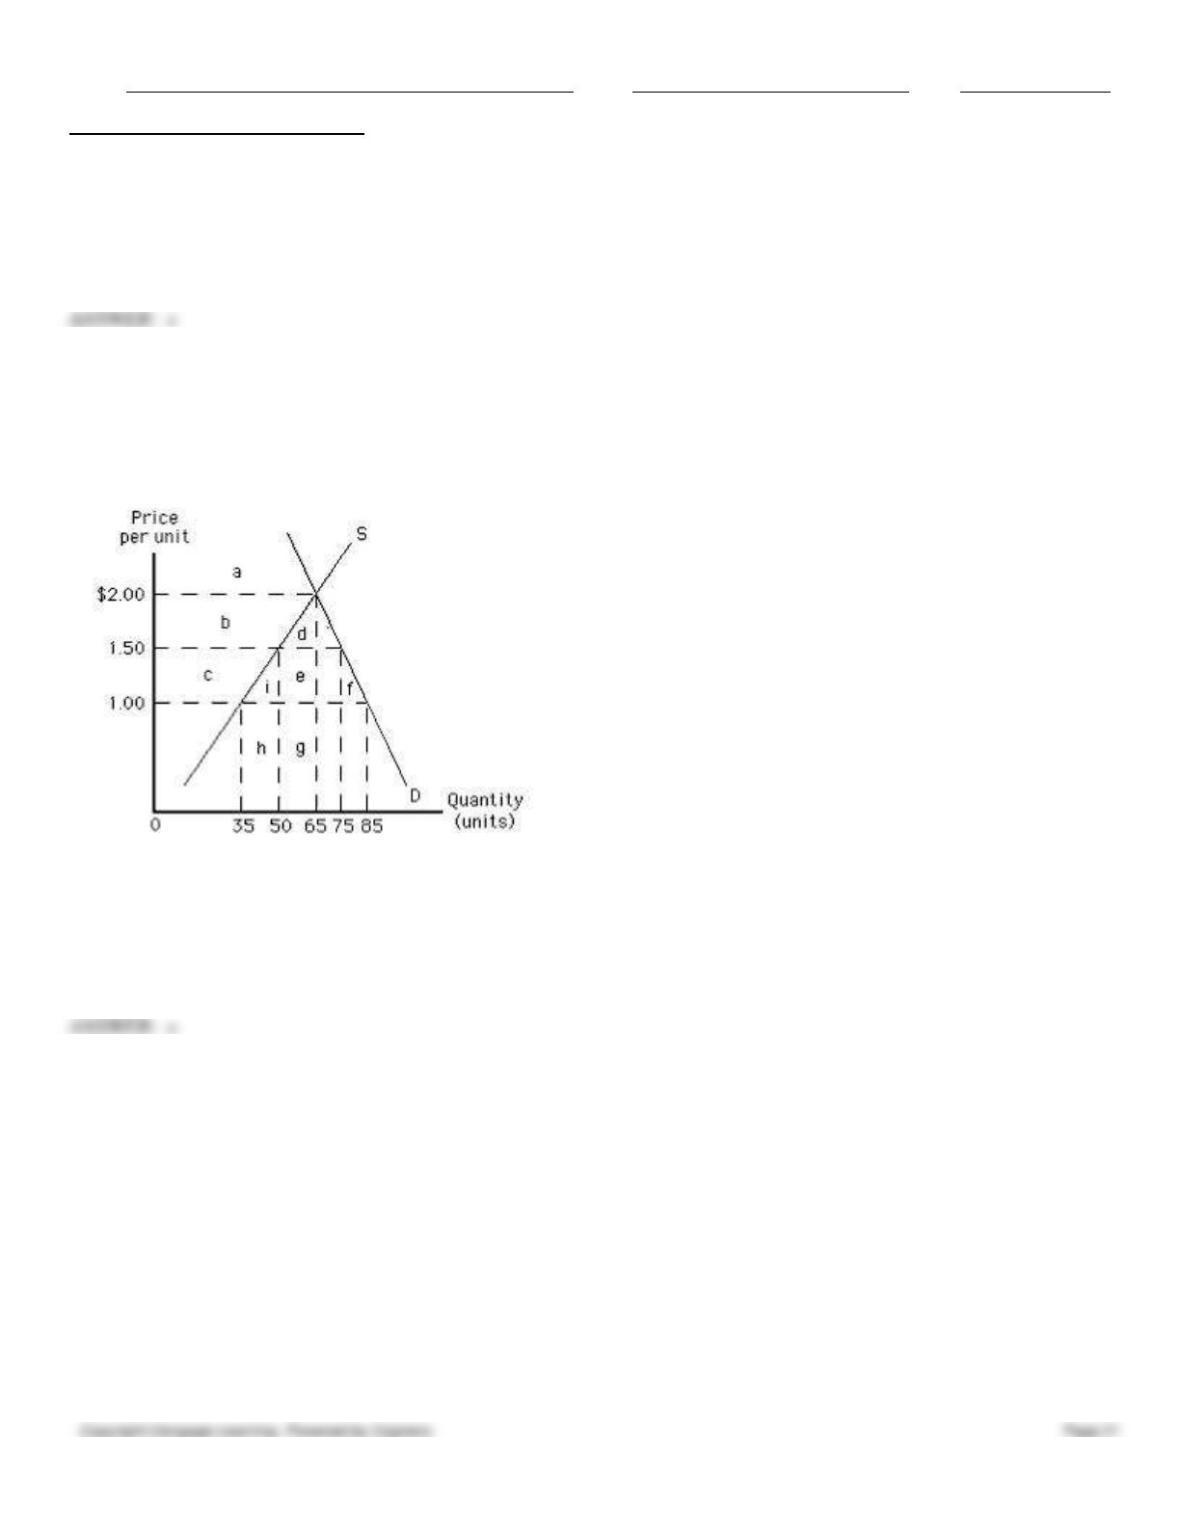
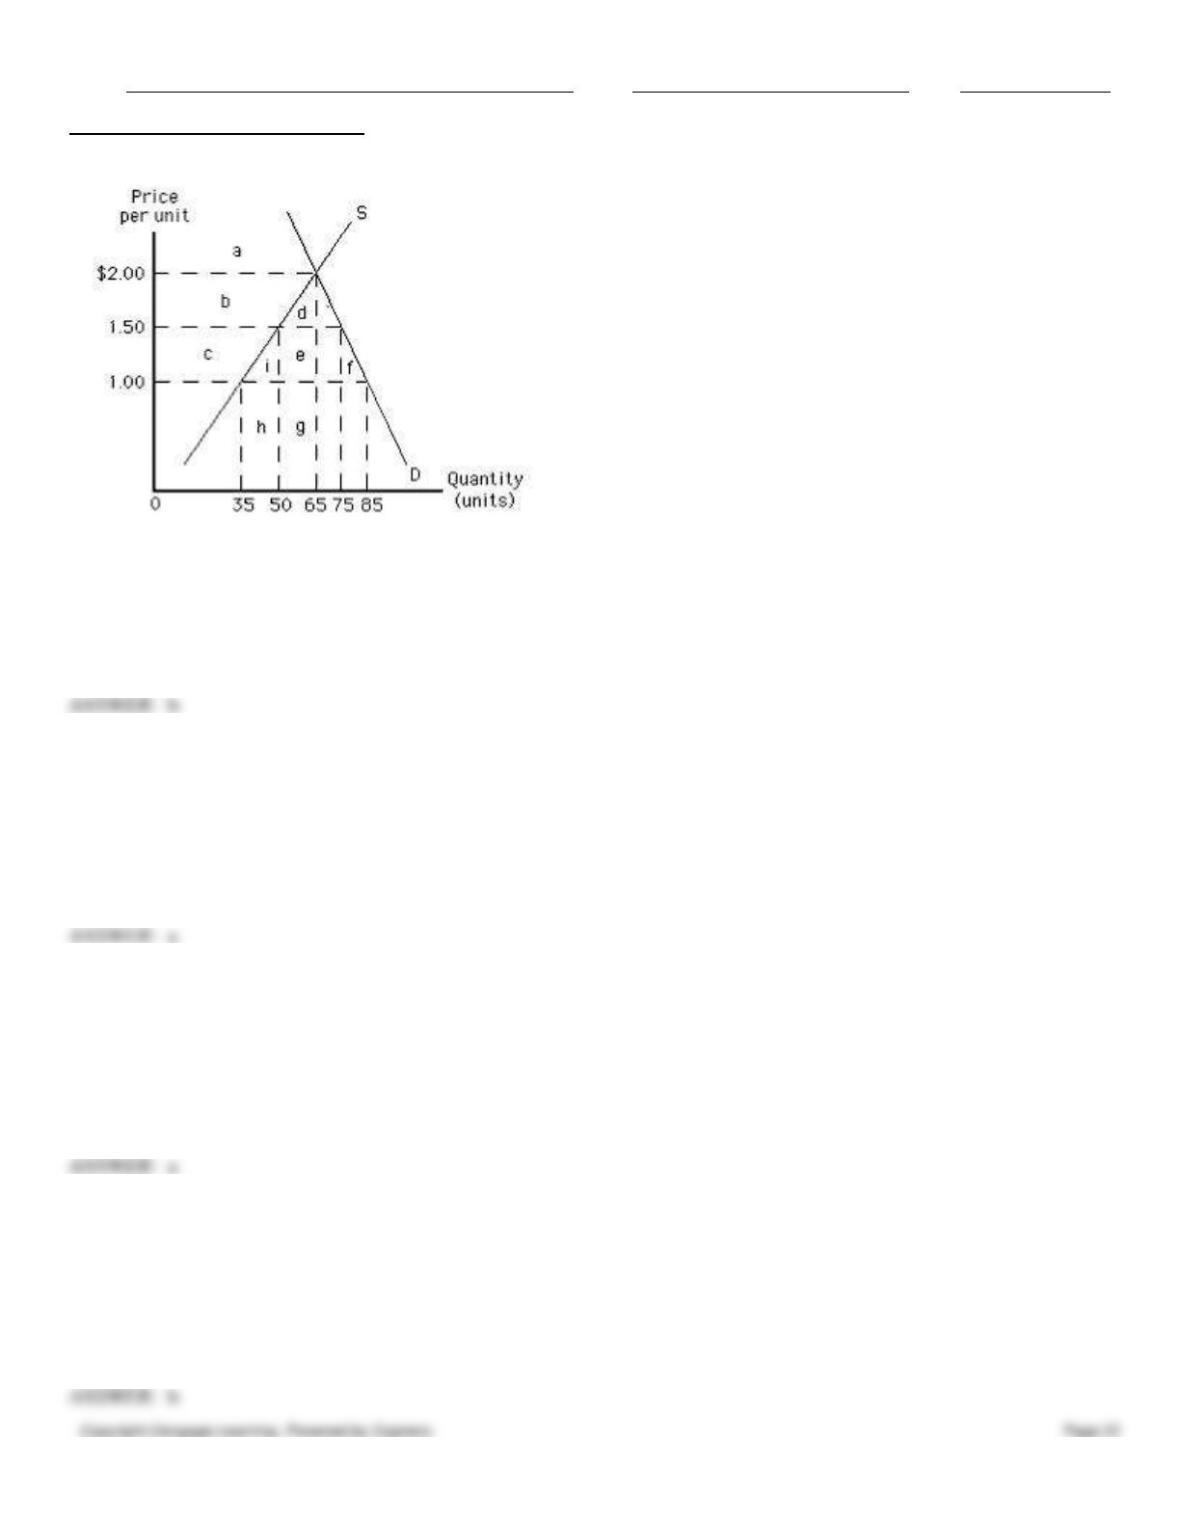
87. The following graph shows U.S. demand for and domestic supply of a good. Suppose the world price of the good is
$1.00 per unit and a specific tariff of $0.50 per unit is imposed on each unit of imported good. In such a case, the
government revenue from a tariff of $0.50 per unit is represented by the area _____.
Figure 19.2
a.
c
b.
e + g
c.
i + e + f
d.
d + e
e.
e
e
88. The following graph shows U.S. demand for and supply of a good. Suppose the world price of the good is $1.00 per
unit and a specific tariff of $0.50 per unit is imposed on each unit of imported good. In such a case, net welfare loss as a
result of a tariff of $0.50 per unit is represented by the area ____.
Figure 19.2
Name:
Class:
Date:
Chapter 19: International Trade
a.
c + i + e + f
b.
i + f
c.
i
d.
f
e.
b + d
89. Tariffs and quotas:
a.
reduce consumer surplus and increase producer surplus in the importing country.
b.
increase consumer surplus and reduce producer surplus in the importing country.
c.
reduce both consumer surplus and producer surplus in the exporting country.
d.
are imposed when there are differences in the opportunity cost of production across countries.
e.
are imposed when production is subject to economies of scale.
90. A lump-sum tax per unit on imports is known as:
a.
a specific tariff.
b.
an import quota.
c.
an ad valorem tariff.
d.
an import concession.
e.
an import substitution.
91. A charge levied on imports in terms of a fixed percentage of value is known as a(n):
a.
specific tariff.
b.
ad valorem tariff.
c.
import quota.
d.
import concession.
e.
import substitution.
Name:
Class:
Date:
Chapter 19: International Trade
92. The world demand for and the world supply of a good will together determine the _____.
a.
tariff
b.
world price
c.
exchange rate
d.
terms of trade
e.
quota
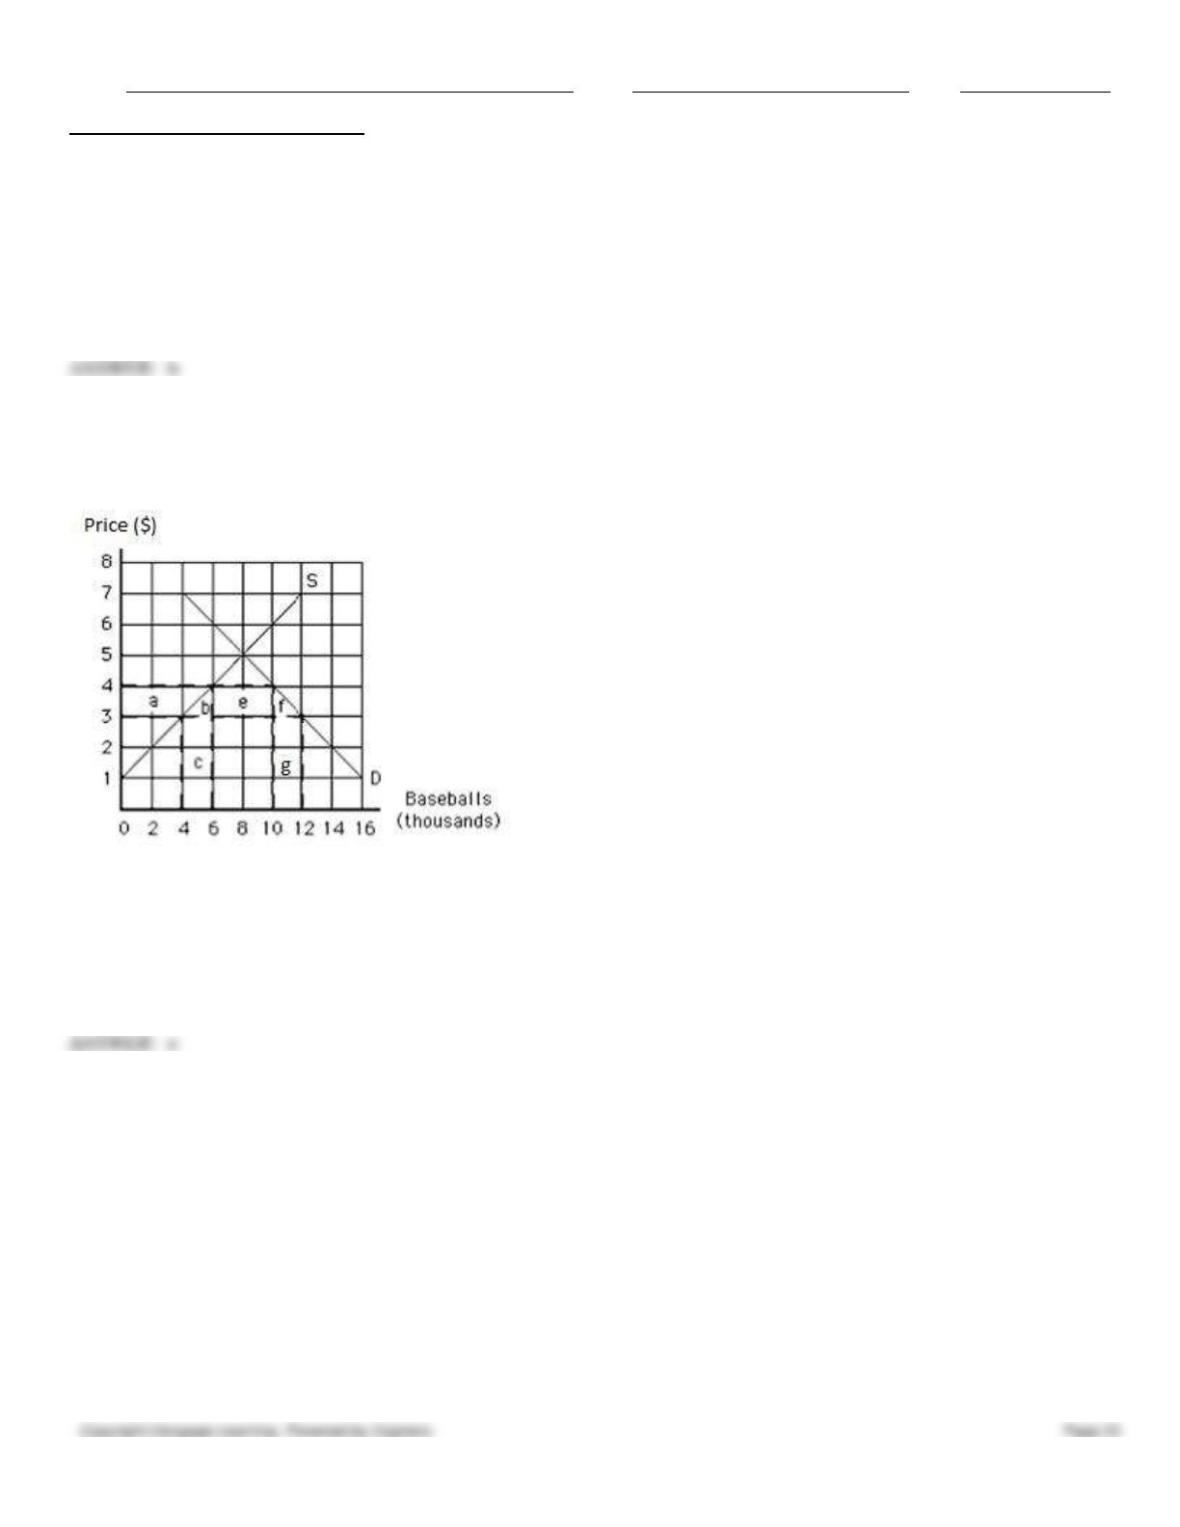
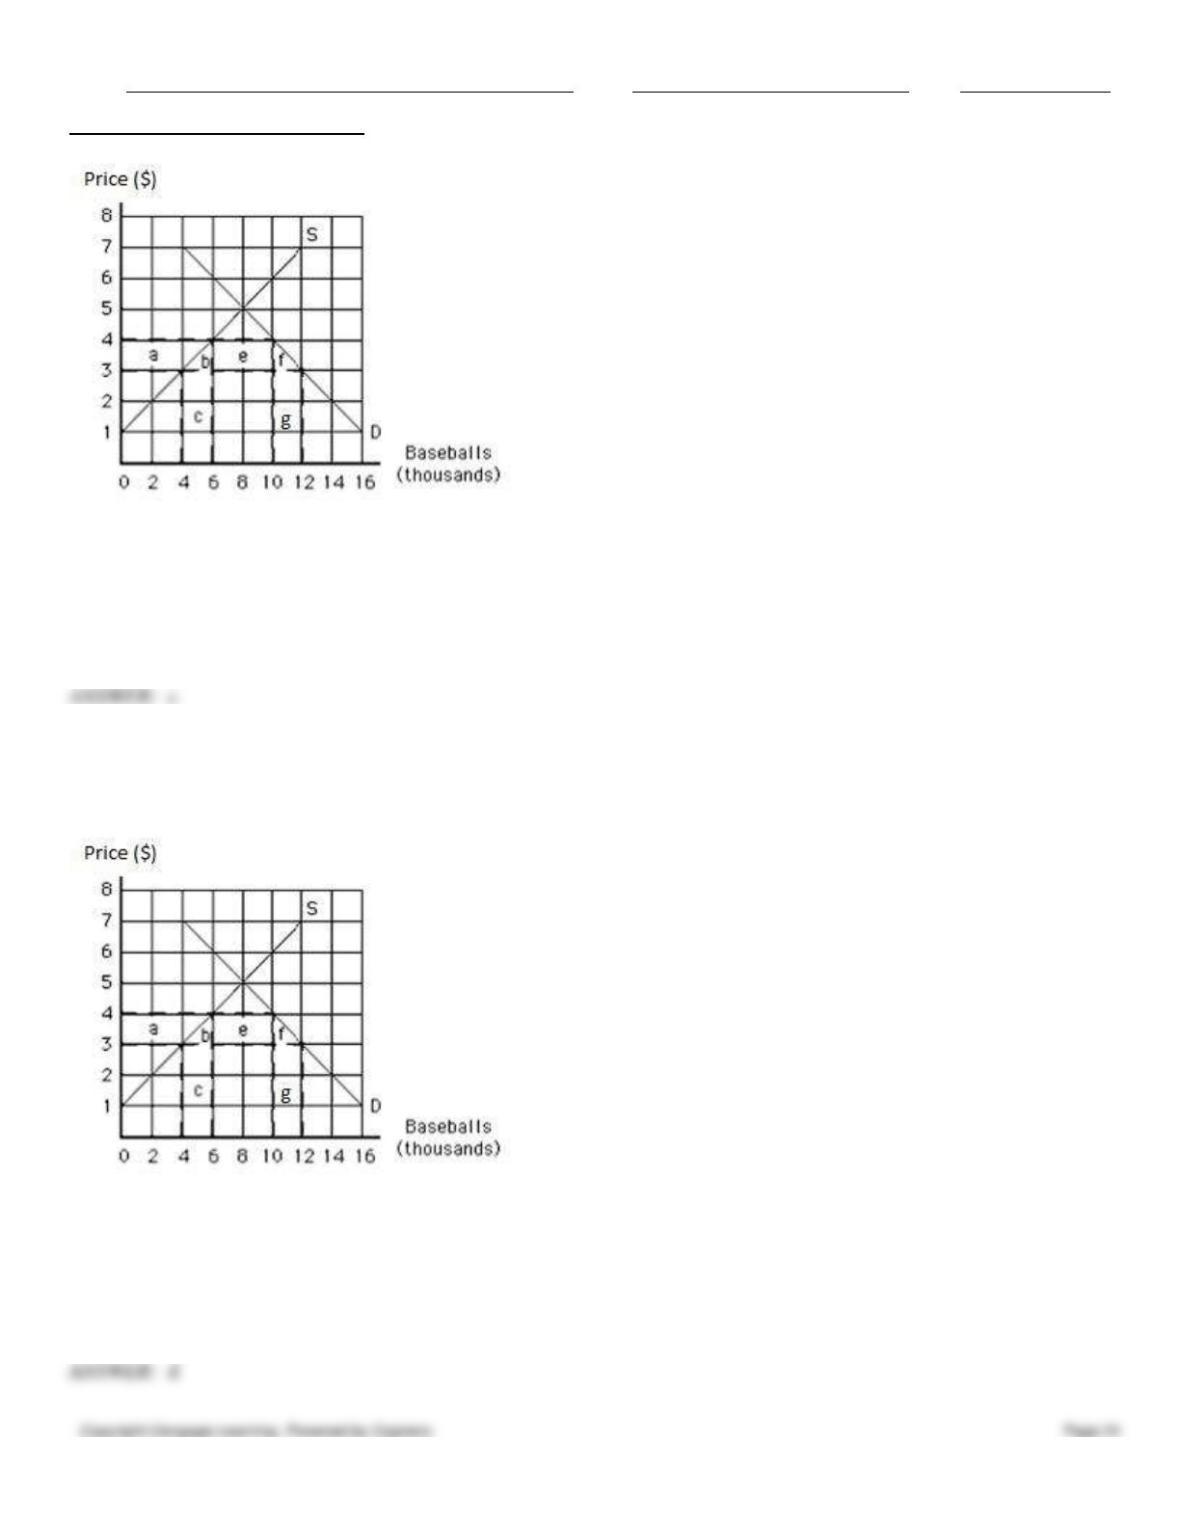
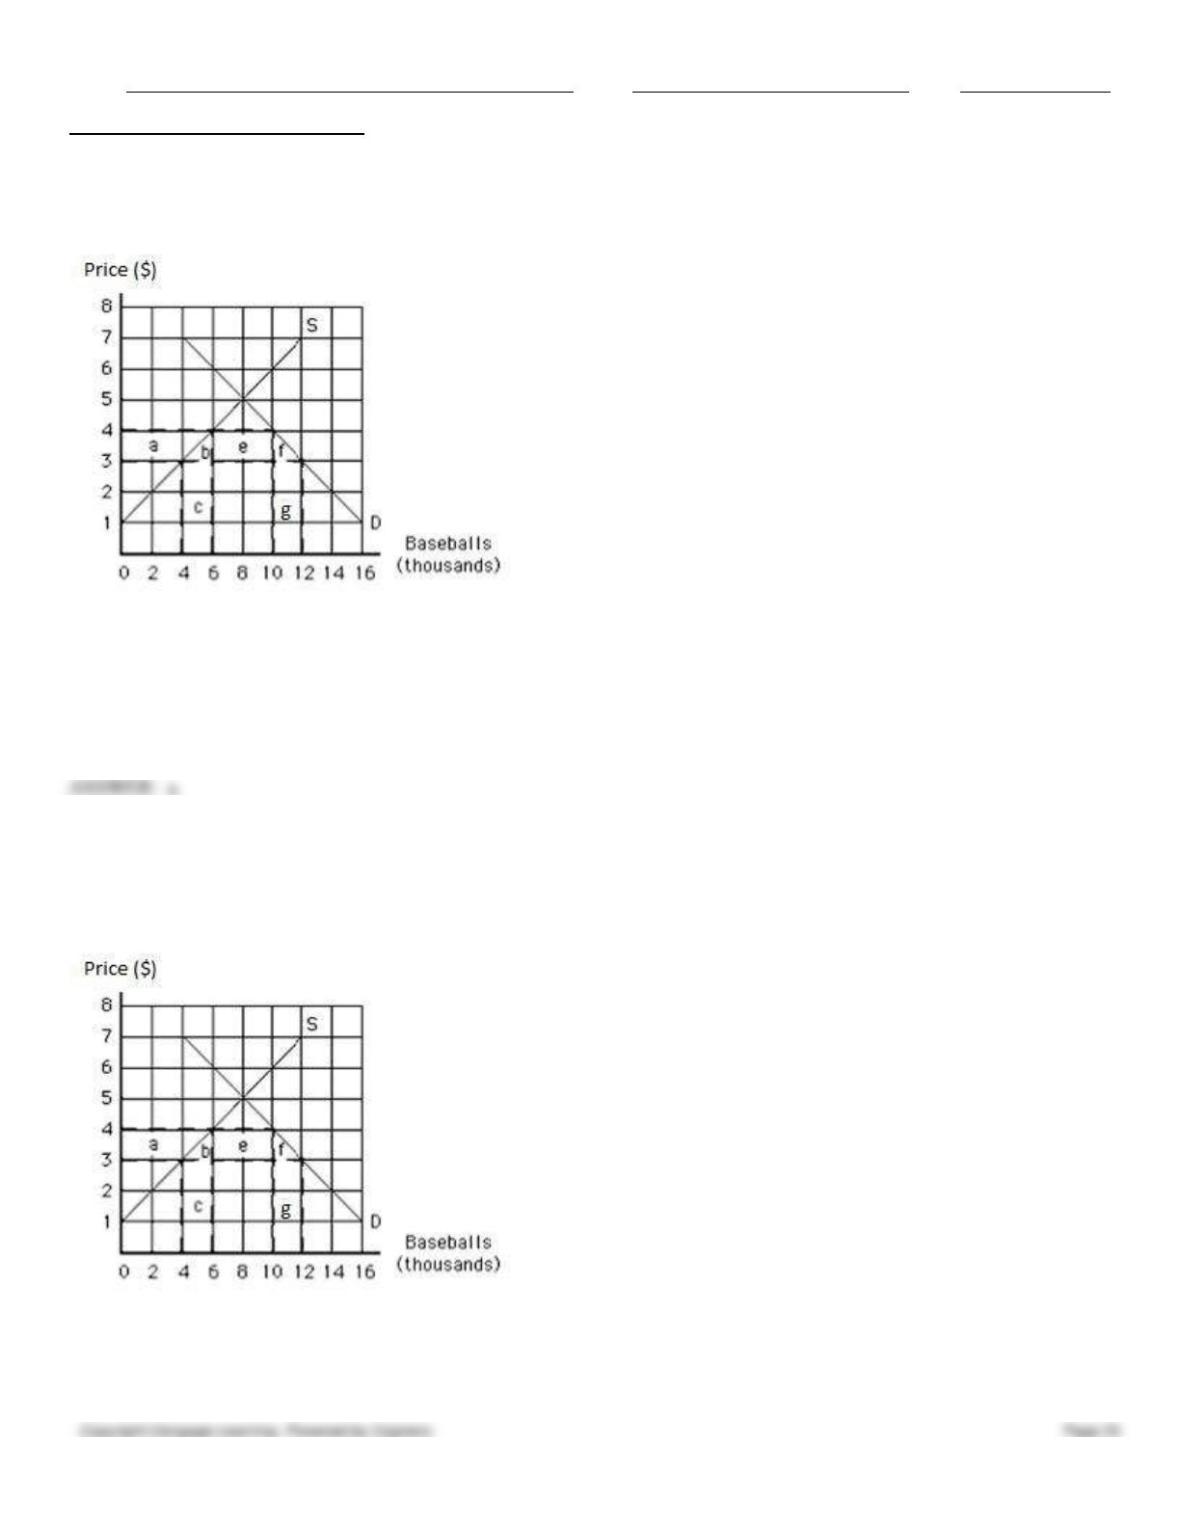
93. The following graph shows the supply of and demand for baseballs in the United States. If the world price of a
baseball is $3, then the quantity of baseballs demanded is _____.
Figure 19.3
a.
4,000
b.
6,000
c.
8,000
d.
10,000
e.
12,000
e
94. The following graph shows the supply of and demand for baseballs in the United States. If the world price is $3 per
baseball, then _____ baseballs are imported.
Figure 19.3
Name:
Class:
Date:
Chapter 19: International Trade
a.
4,000
b.
6,000
c.
8,000
d.
10,000
e.
12,000
c
95. The following graph shows the supply of and demand for baseballs in the United States. If the world price is $3 per
baseball and a tariff of $1 per baseball is imposed, then the number of baseballs purchased in the United States is _____.
Figure 19.3
a.
4,000
b.
6,000
c.
8,000
d.
10,000
e.
12,000
Name:
Class:
Date:
Chapter 19: International Trade
96. The following graph shows the supply of and demand for baseballs in the United States. If the world price is $3 per
baseball and a tariff of $1 per baseball is imposed, then the number of baseballs imported is _____.
Figure 19.3
a.
4,000
b.
6,000
c.
8,000
d.
10,000
e.
12,000
a
97. The following graph shows the supply of and demand for baseballs in the United States. If the world price is $3 per
baseball and a tariff of $1 per baseball is imposed, then the tariff revenue collected by the United States government is
_____.
Figure 19.3
a.
$4,000
b.
$16,000
c.
$20,000
Name:
Class:
Date:
Chapter 19: International Trade
d.
$24,000
e.
$48,000
a
98. The following graph shows the supply of and demand for baseballs in the United States. If the world price is $3 per
baseball and a tariff of $1 per baseball is imposed, then the tariff revenue collected by the United States government is
shown by the area _____.
Figure 19.3
a.
a
b.
b
c.
c
d.
f
e.
e
e
99. The following graph shows the supply of and demand for baseballs in the United States. If the world price is $3 per
baseball and a tariff of $1 per baseball is imposed, the net welfare loss of the tariff is shown by the area _____.
Figure 19.3
Name:
Class:
Date:
Chapter 19: International Trade
a.
g
b.
c
c.
a
d.
c and g
e.
b and f
e
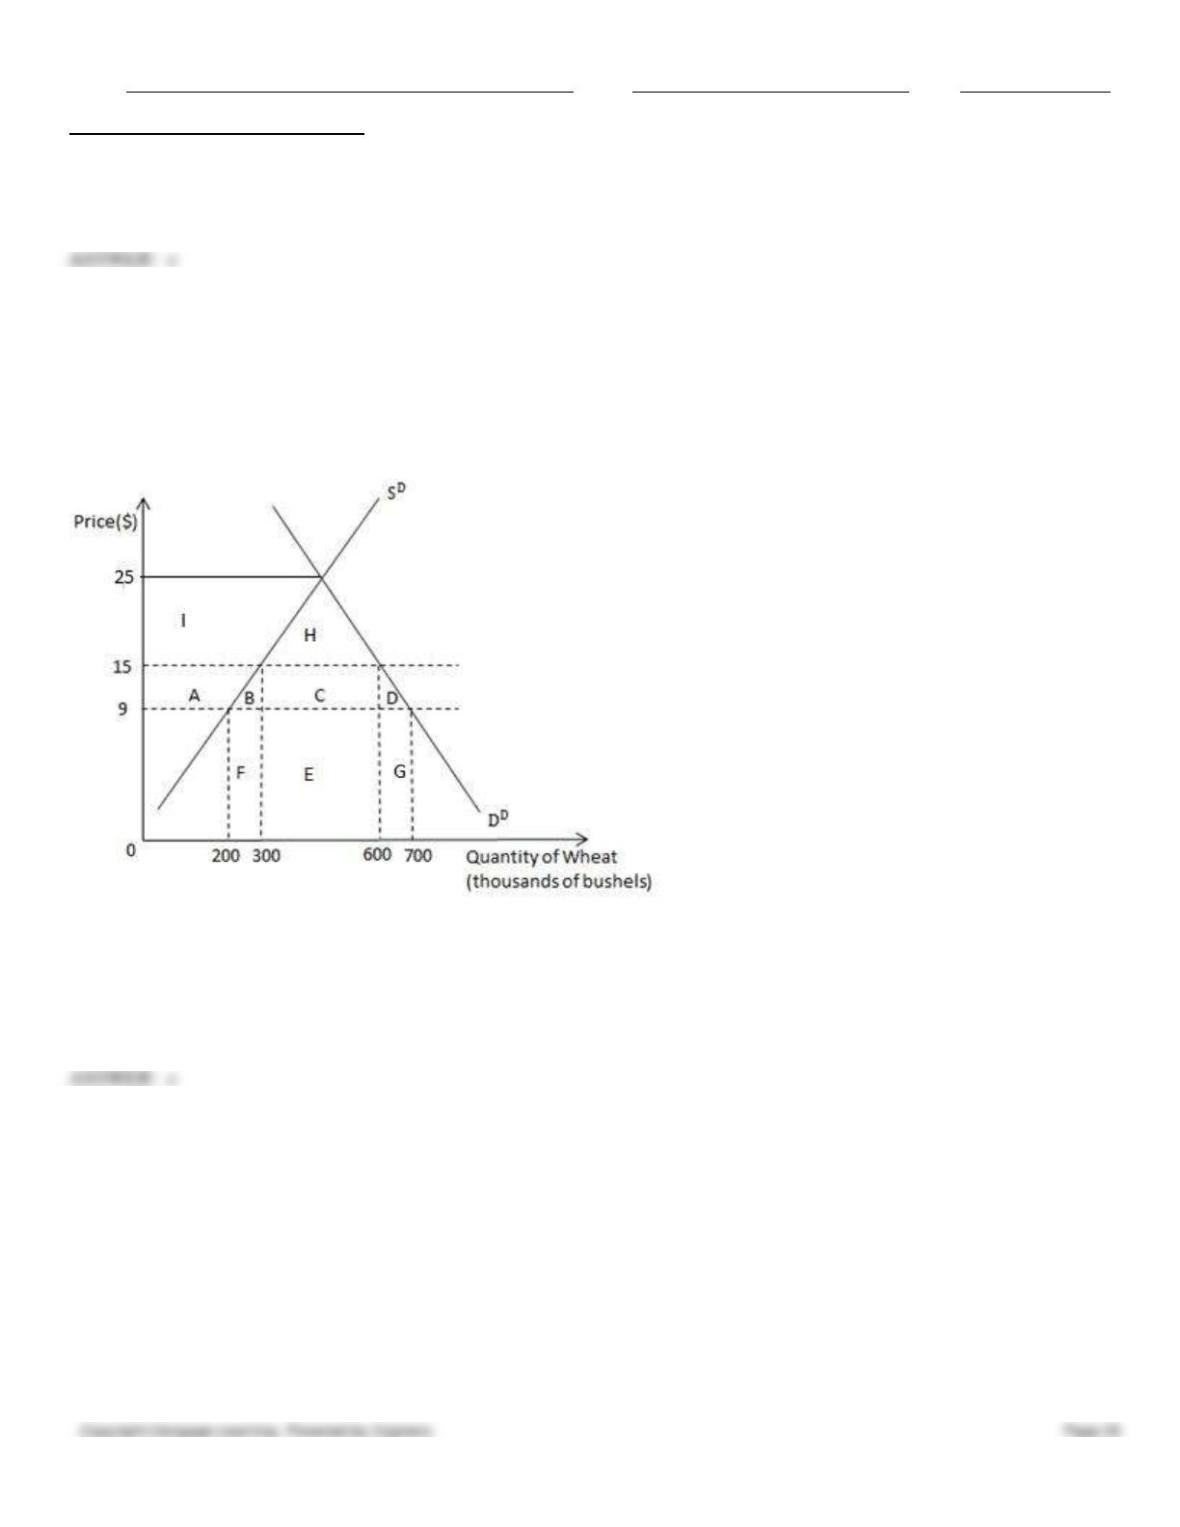
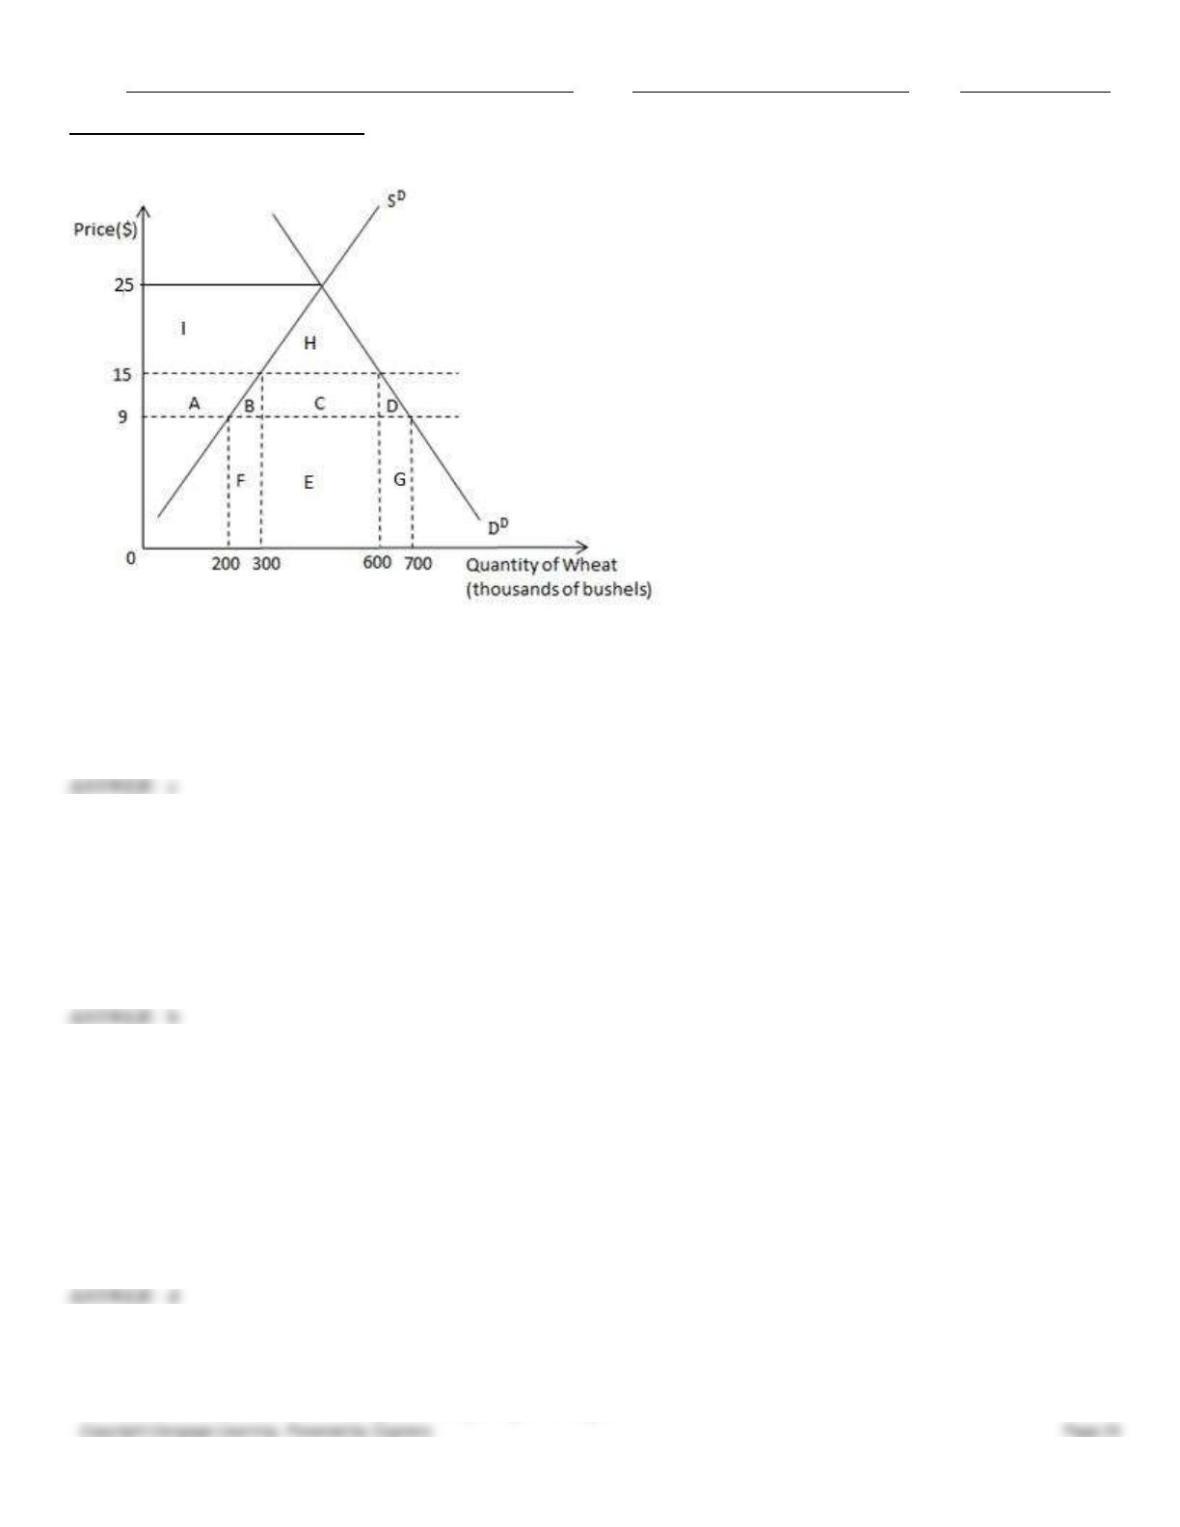
100. The following image shows the market for wheat for the country of Palatino. SD is the domestic supply of wheat, and
DD is the domestic demand for wheat. Suppose the world price of wheat is $9 per bushel of wheat. Suppose a specific
tariff of $6 is imposed on each bushel of wheat imported. Government revenue from the tariff equals:
Figure 19.4
a.
$45,000.
b.
$3,000,000.
Name:
Class:
Date:
Chapter 19: International Trade
c.
$1,800,000.
d.
$900,000.
e.
$50,000.
101. The following image shows the market for wheat for the country of Palatino. SD is the domestic supply of wheat, and
DD is the domestic demand for wheat. Suppose the world price of wheat is $9 per bushel. Suppose a specific tariff of $6 is
imposed on each bushel of wheat imported. The total loss in consumer surplus after the tariff is shown by the area _____.
Figure 19.4
a.
F and E
b.
G
c.
A, B, C, and D
d.
I
e.
H
c
102. The following image shows the market for wheat for the country of Palatino. SD is the domestic supply of wheat, and
DD is the domestic demand for wheat. Suppose the world price of wheat is $9 per bushel. Suppose a specific tariff of $6 is
imposed on each bushel of wheat imported. The net welfare loss from the tariff is represented by the area _____.
Figure 19.4
Name:
Class:
Date:
Chapter 19: International Trade
a.
A and C
b.
I and H
c.
B and D
d.
E
e.
F
103. A legal limit on the amount of a commodity that can be imported is known as:
a.
an ad valorem tariff.
b.
an import quota.
c.
an import concession.
d.
an import substitution.
e.
a specific tariff.
104. Suppose the government of an importing country is considering imposing either a tariff that would result in imports
falling to 1 million units per year or an import quota of 1 million units per year. Which of the following would be true?
a.
The domestic price of the imported good will rise higher with the tariff than with the quota.
b.
Consumers in the importing country will be worse off with the quota than with the tariff.
c.
Domestic producers that compete with the imports will be better off with the tariff than with the quota.
d.
The tariff will increase the revenue of the government of the importing country, while the quota will increase
the profits of the foreign exporting firms with quota rights.
e.
Tariffs raise the price of a good but quotas do not.
105. An effective import quota:
a.
lowers the price of imports.
b.
lowers the price of domestic goods competing with imports.

Name:
Class:
Date:
Chapter 19: International Trade
c.
increases the variety of goods available to the consumer.
d.
increases federal revenues.
e.
lowers the quantity of the imported good.
106. Quotas are favoured over free international trade by:
a.
consumers in the importing country and consumers in the exporting country.
b.
domestic producers in the importing country and foreign producers with quota rights.
c.
domestic producers and domestic consumers in the exporting country.
d.
foreign producers without quota rights and consumers in the importing country.
e.
foreign consumers and domestic producers in the exporting country.
107. Economists argue that U.S. government can earn federal revenue:
a.
from quotas by auctioning off quotas to foreign producers.
b.
by increasing the profitability of getting quota rights.
c.
by encouraging foreign governments to retaliate with quotas and tariffs of their own.
d.
from quotas, as quotas redistribute wealth from domestic consumers to domestic producers.
e.
by distributing quota rights to domestic exporters.
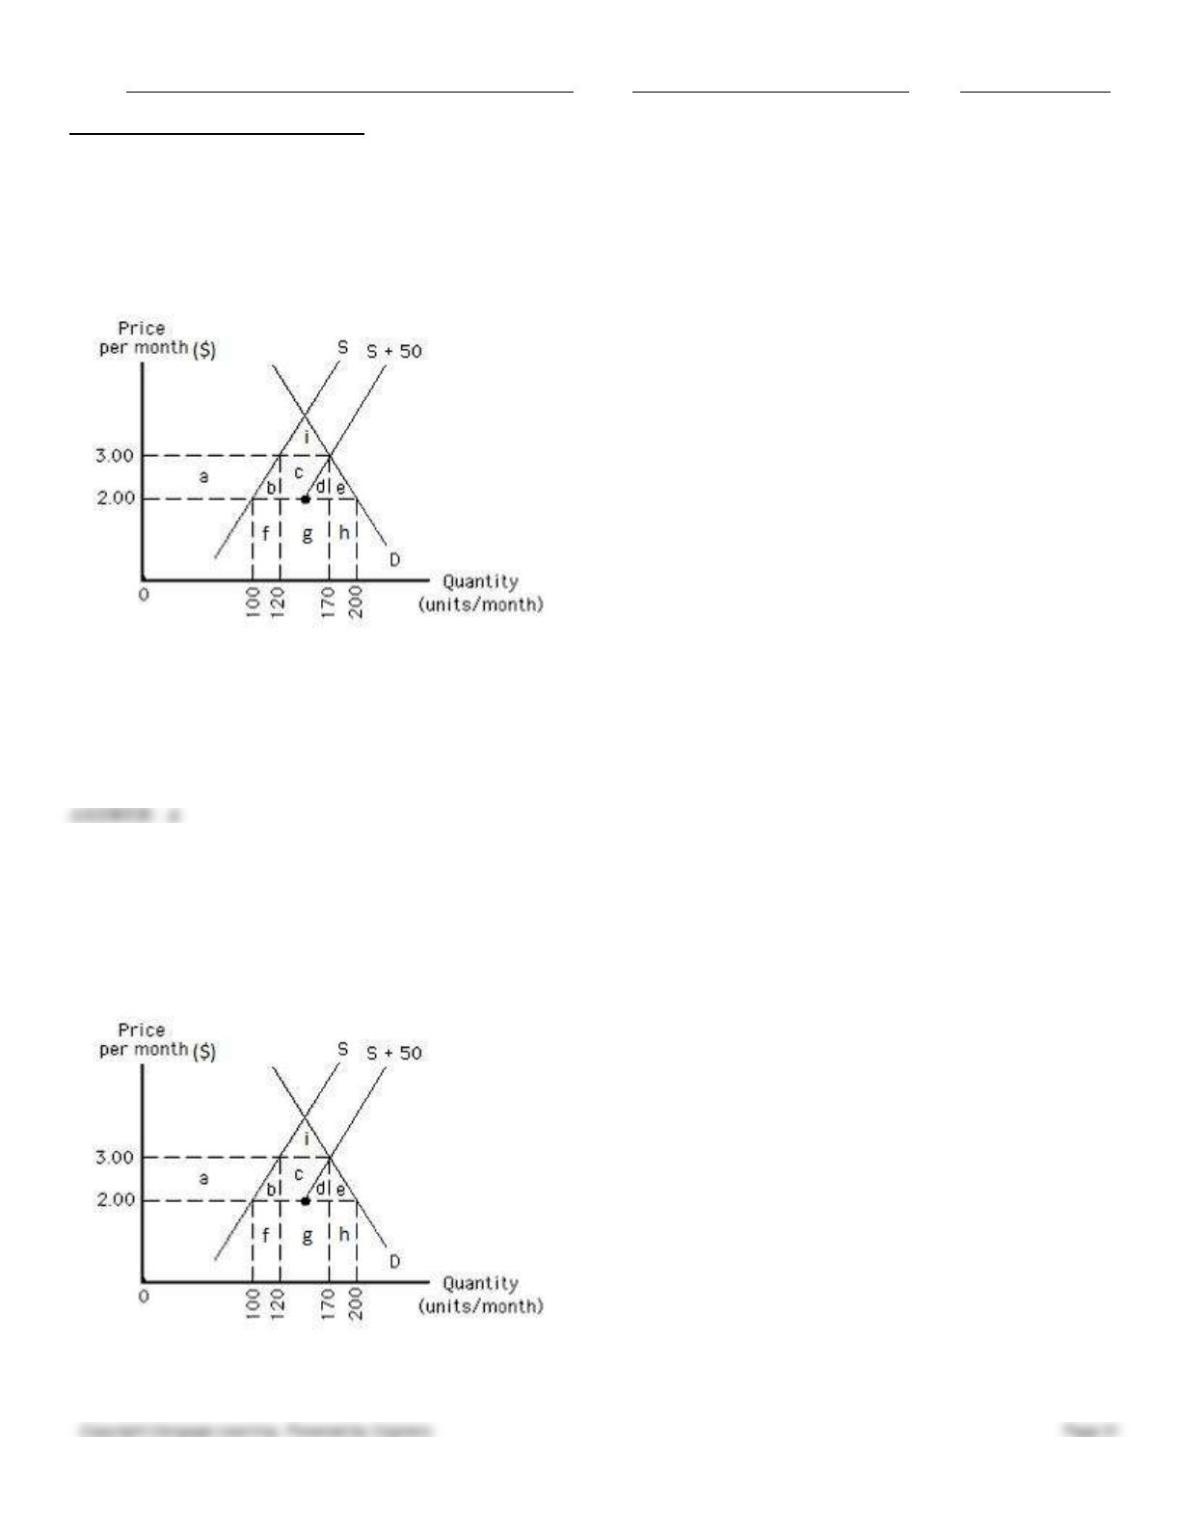
108. The following graph shows the demand for and the supply of a good in a country. If the world price of the good is
$2.00 per unit, the import quota that would least affect the level of imports in this country is_____.
Figure 19.5
a.
$3.00 per unit
b.
$2.00 per unit
c.
50 units per month
d.
100 units per month
e.
150 units per month
Name:
Class:
Date:
Chapter 19: International Trade
109. The following graph shows the demand for and the supply of a good in a country. If the world price of the good is
$2.00 per unit and an import quota of 50 units per month is imposed, then:
Figure 19.6
a.
domestic production will increase from 100 to 200 units per month.
b.
imports will increase from 25 to 50 units per month.
c.
domestic production will increase from 100 to 175 units per month.
d.
domestic production will increase from 100 to 125 units per month.
e.
domestic production will increase from 100 to 150 units per month.
110. The following graph shows the demand for and the supply of a good in a country. If the world price of the good is
$2.00 per unit and an import quota of 50 units per month is imposed, then the decrease in consumer surplus can be
represented by the area _____.
Figure 19.6
a.
f
b.
i