
Name:
Class:
Date:
Chapter 19: International Trade
True / False
1. International trade increases world economic efficiency for the same reasons that domestic trade increases national
economic efficiency.
a.
True
b.
False
True
2. International trade equalizes the opportunity cost of producing any good around the world.
a.
True
b.
False
False
3. In 2012, exports amounted to about 14 percent of U.S. GDP.
a.
True
b.
False
True
4. Japan is generally considered a closed economy.
a.
True
b.
False
False
5. If resources are equally adaptable to the production of different goods, the production possibilities frontier of a country
will be an upward-sloping, concave curve.
a.
True
b.
False
False
6. Whenever the opportunity costs of goods are significantly different in different countries, there are gains from
specialization and trade.
a.
True
b.
False
True
7. If the United States has an absolute advantage in producing computer components, it should export them worldwide.
a.
True
b.
False
False
8. U.S. consumers would be better off if they bought only U.S.-produced goods.
a.
True
b.
False
False
9. If a country has an absolute advantage in the production of every good, it cannot benefit from trade with other
Name:
Class:
Date:
Chapter 19: International Trade
countries.
a.
True
b.
False
False
10. It is possible for one country to have a comparative advantage in the production of all products.
a.
True
b.
False
False
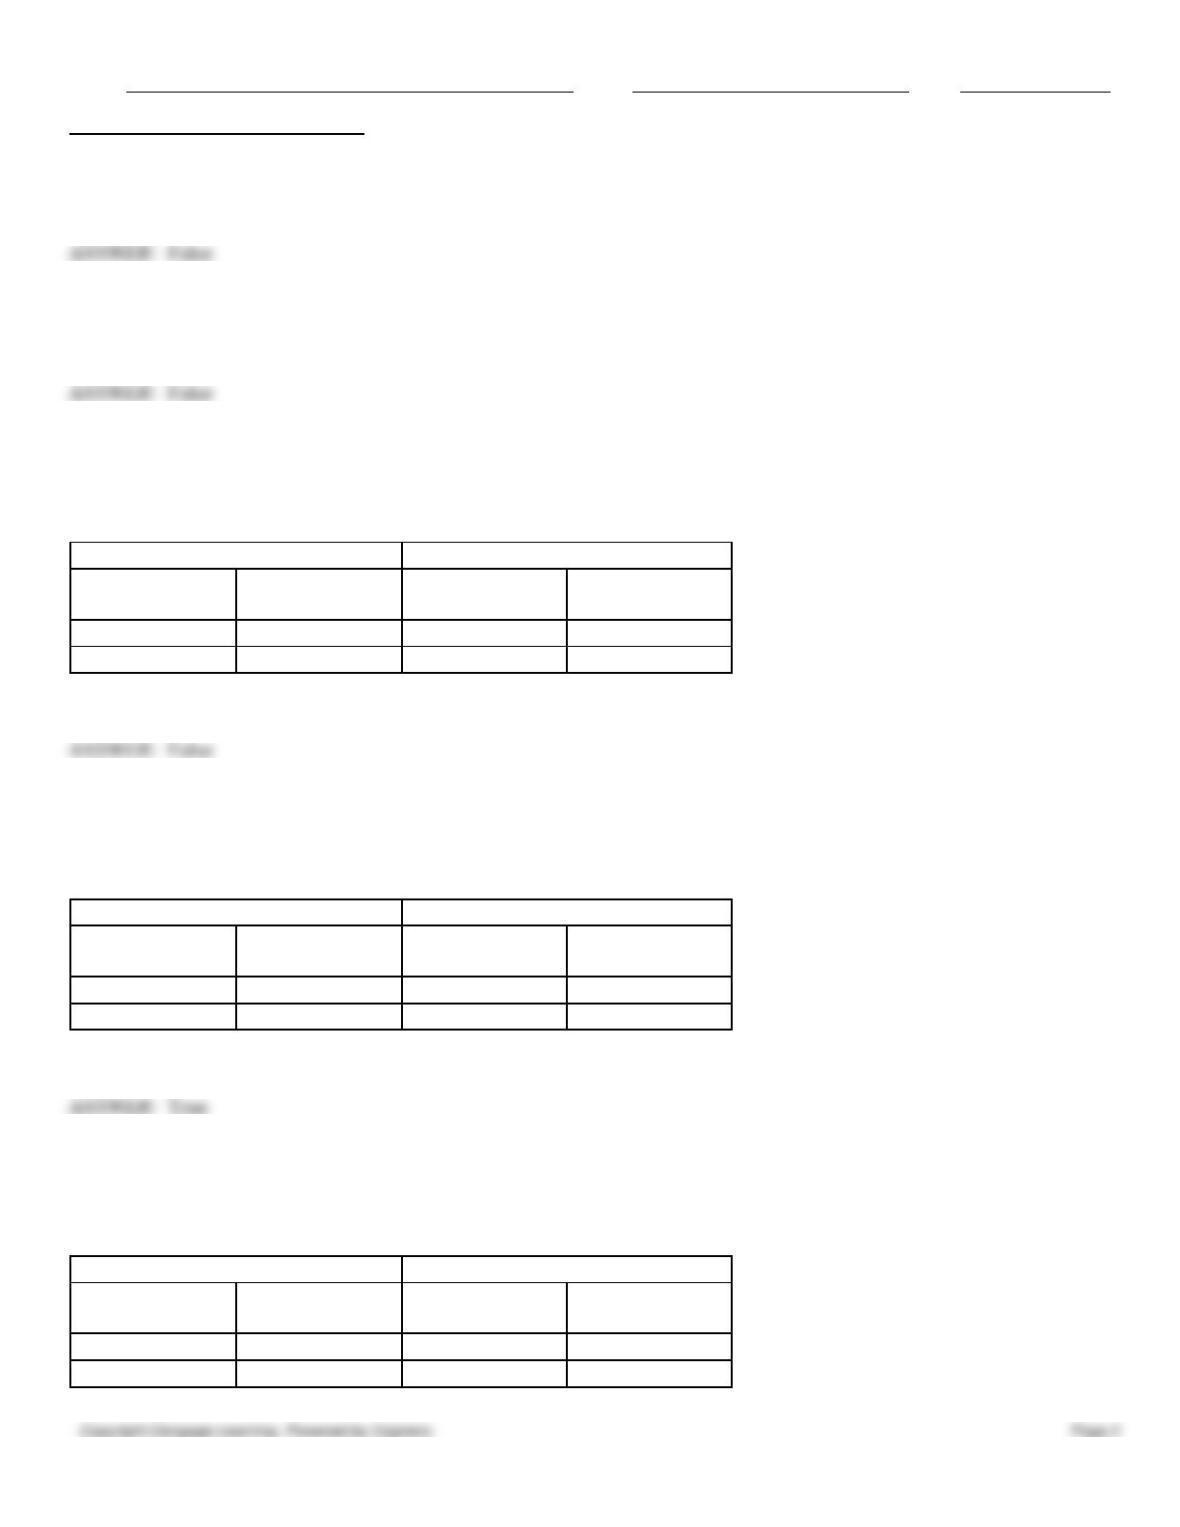
11. The following table shows per-day production data of rice and T-shirts for two countries, Cambria and Bodoni. Based
on the table, it can be said that Cambria has a comparative advantage in the production of rice.
Table 19.1
Cambria
Bodoni
Tons of rice per
day
T-shirts per day
Tons of rice per
day
T-shirts per day
20
0
100
0
0
800
0
1000
a.
True
b.
False
False
12. The following table shows per-day production data of rice and T-shirts for two countries, Cambria and Bodoni. Based
on the table, it can be said that Bodoni has a comparative advantage in the production of rice.
Table 19.1
Cambria
Bodoni
Tons of rice per
day
T-shirts per day
Tons of rice per
day
T-shirts per day
20
0
100
0
0
800
0
1000
a.
True
b.
False
True
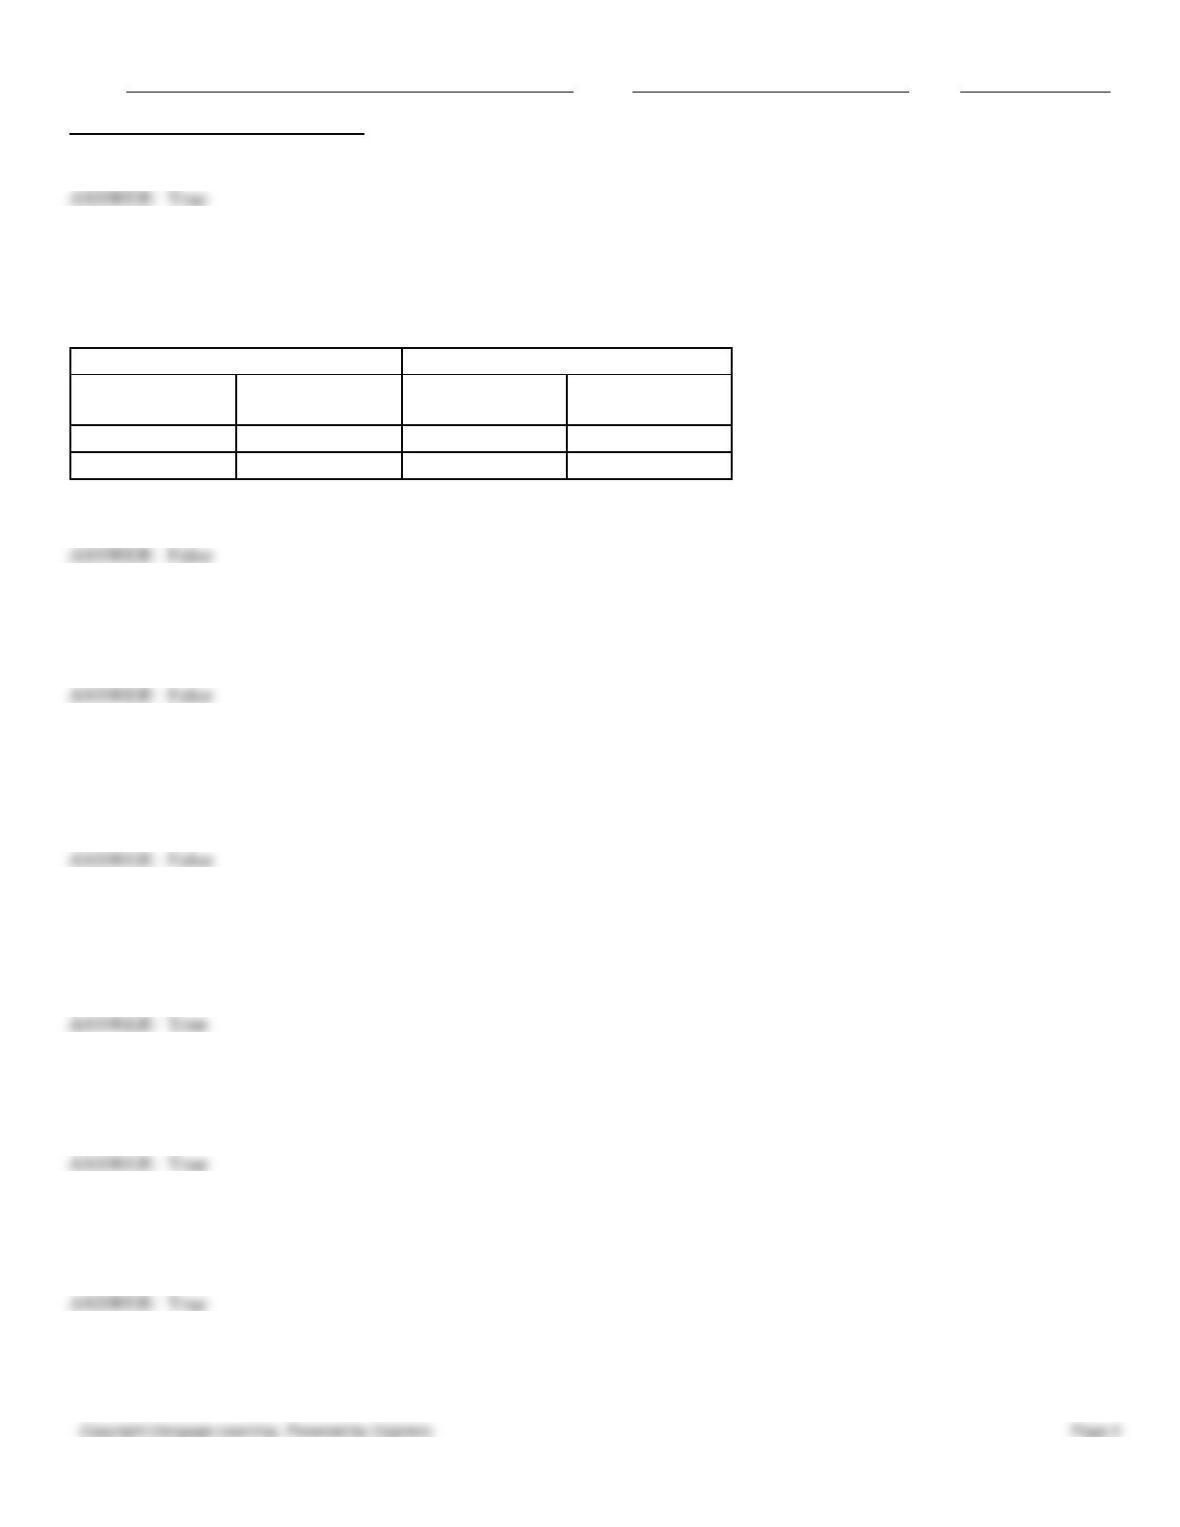
13. The following table shows per-day production data of rice and T-shirts for two countries, Cambria and Bodoni. Based
on the table, it can be said that Bodoni should produce rice and trade their rice for Cambria’s T-shirts.
Table 19.1
Cambria
Bodoni
Tons of rice per
day
T-shirts per day
Tons of rice per
day
T-shirts per day
20
0
100
0
0
800
0
1000
a.
True
Name:
Class:
Date:
Chapter 19: International Trade
b.
False
True
14. The following table shows per-day production data of rice and T-shirts for two countries, Cambria and Bodoni. Based
on the table, it can be said that trade between Bodoni and Cambria will benefit Cambria but not Bodoni.
Table 19.1
Cambria
Bodoni
Tons of rice per
day
T-shirts per day
Tons of rice per
day
T-shirts per day
20
0
100
0
0
800
0
1000
a.
True
b.
False
False
15. Specialization based on absolute advantage leads to gains from trade.
a.
True
b.
False
False
16. Countries export products they can produce cheaply in return for products that are unavailable domestically or are
cheaper elsewhere.
a.
True
b.
False
False
17. If production is subject to economies of scale, countries can gain from trade if each nation specializes in the
production of a good.
a.
True
b.
False
True
18. International trade increases the variety of goods and services available in a country.
a.
True
b.
False
True
19. Domestic producers of goods who compete with cheaper imports benefit from protectionism in the short run.
a.
True
b.
False
True
20. A tariff is a tax on either imports or exports.
a.
True

Name:
Class:
Date:
Chapter 19: International Trade
b.
False
True
21. If a tariff increases, everybody loses except the government imposing the tariff.
a.
True
b.
False
False
22. Ad valorem tariffs on imports are based on a percentage of an import’s value, while specific tariffs are based on a
lump sum per physical unit imported.
a.
True
b.
False
True
23. The world price of a good refers to the quantity of one good exchanged for a unit of another good.
a.
True
b.
False
False
24. An import quota is a tax on imports.
a.
True
b.
False
False
25. Tariffs and quotas are the only two devices used to restrict foreign trade.
a.
True
b.
False
False
26. Relative to quotas, tariffs lead to a greater change in the quantity of a good demanded by consumers.
a.
True
b.
False
False
27. Dumping refers to selling a commodity abroad at a price that is below its cost of production or below the price
charged in the domestic market.
a.
True
b.
False
True
28. International trade between countries typically produces a winner and a loser. Generally, it is the more economically
advanced country that gains at the expense of the less developed nation.
a.
True
b.
False
False

Name:
Class:
Date:
Chapter 19: International Trade
29. If wage rates are lower in Mexico than in Germany, labor costs per unit of output can still be higher in Mexico.
a.
True
b.
False
True
30. When a country imposes trade restrictions, the domestic producers who compete with imports may lose in the long run
if protection stifles innovation and leaves the industry vulnerable.
a.
True
b.
False
True
31. The declining industries argument was formulated as a rationale for protecting emerging domestic industries from
foreign competition.
a.
True
b.
False
False
32. Quotas and tariffs discourage foreign governments from retaliating with quotas and tariffs of their own.
a.
True
b.
False
False
Multiple Choice
33. The law of comparative advantage states that:
a.
each country should specialize in producing the good with the lowest opportunity cost.
b.
a country able to produce something using fewer resources than other countries would gain from specialization
and trade.
c.
international trade barriers slow the introduction of new goods and better technologies.
d.
countries can gain from trade if production is subject to economies of scale.
e.
countries must agree on how much of one good exchanges for another.
a
34. The production possibilities curve of a country will be a straight line if _____.
a.
the production of each commodity is subject to economies of scale
b.
the country completely specializes in the production of the good with the highest opportunity cost
c.
the country has an absolute advantage in the production of each commodity
d.
the resources in the country are equally adaptable to the production of each commodity
e.
the country completely specializes in the production of the good with the lowest opportunity cost
35. Autarky is:
a.
the situation of national self-sufficiency, in which there is no economic interaction with foreign producers or
consumers.

Name:
Class:
Date:
Chapter 19: International Trade
b.
the situation in which there is no legal limit on the amount of a commodity that can be imported.
c.
the situation in which countries export products they can produce more cheaply in return for products that are
unavailable domestically or are cheaper elsewhere.
d.
the situation in which world price is determined by the world supply and demand for a product.
e.
the situation in which each country specializes in making goods with the lowest opportunity cost.
a
36. Which of the following is true of autarky?
a.
Each country’s consumption possibilities are the same as its production possibilities.
b.
Equilibrium is attained with the maximum gains from specialization and trade.
c.
There is no legal limit on the amount of a commodity that can be imported.
d.
Countries export products they can produce more cheaply in return for products that are unavailable
domestically or are cheaper elsewhere.
e.
World price is determined by the world supply and demand for a product.
a
37. In determining comparative advantage, the cost of producing a good is measured in terms of:
a.
foreign currency.
b.
domestic currency.
c.
only gold.
d.
marginal cost of the resources employed.
e.
opportunities forgone.
38. Suppose workers in Transylvania can produce only two goods—yo–yos or sweatsocks. If the Transylvanian currency
is the daler, then the opportunity cost of producing yo–yos is measured in terms of _____.
a.
dalers
b.
dalers per yo–yo
c.
dalers per sweatsock
d.
yo–yos
e.
sweatsocks
e
39. For each watch Marina produces, it gives up the opportunity to make 50 pounds of cheese. Cambria can produce one
watch for every 100 pounds of cheese it produces. If specialization and trade were to occur between these two countries,
which of the following is true with regard to opportunity costs in the two countries?
a.
The opportunity cost of producing watches is higher in Marina than Cambria.
b.
The opportunity cost of producing cheese is higher in Marina than Cambria.
c.
The opportunity cost of producing cheese is identical in both countries.
d.
The opportunity cost of producing watches is lower in Cambria than Marina.
e.
In both countries combined, the opportunity cost of one watch is 150 pounds of cheese.
40. For each pound of blueberry cheesecake Abura produces, it gives up the opportunity to make 150 screwdrivers. Mayo
can produce one pound of blueberry cheesecake for every 300 screwdrivers it produces. If specialization and trade were to

Name:
Class:
Date:
Chapter 19: International Trade
occur between these two countries, which of the following is true with regard to opportunity costs in the two countries?
a.
The opportunity cost of producing cheesecakes is lower in Abura than Mayo.
b.
The opportunity cost of producing screwdrivers is lower in Abura than Mayo.
c.
The opportunity cost of producing cheesecakes is identical in both countries.
d.
The opportunity cost of producing screwdrivers is higher in Abura than Mayo.
e.
In Mayo, the opportunity cost of producing one unit of screwdriver is one pound of cheesecake.
41. For each fancy dress Cafilla produces, it gives up the opportunity to make 50 pounds of cheese. Bodoni can produce
one fancy dress for every 100 pounds of cheese it produces. If specialization and trade were to occur between these two
countries, which of the following would be consistent with the theory of comparative advantage?
a.
Cafilla has the comparative advantage in dresses and cheese.
b.
Bodoni has the comparative advantage in dresses and cheese.
c.
Bodoni has the comparative advantage in only dresses.
d.
Cafilla has the comparative advantage in only dresses.
e.
Cafilla has the comparative advantage in only cheese.
42. For each pair of jeans Casina produces, it gives up the opportunity to make 50 pounds of chocolate truffle. Marina can
produce one pair of jeans for every 100 pounds of chocolate truffle it produces. Suppose the data is converted into
production possibilities frontiers (PPFs), with constant opportunity costs, for both countries. While the pounds of
chocolate truffle produced is measured on the vertical axis, the pairs of jeans produced are measured along the horizontal
axis. Identify the correct statement in this case.
a.
The slope of Marina’s production possibilities frontier is equal to −50.
b.
The slope of Marina’s production possibilities frontier is flatter than Casina’s.
c.
The slope of Marina’s production possibilities frontier is equal to −0.02.
d.
The slope of Marina’s production possibilities frontier is steeper than Casina’s.
e.
The slope of Casina’s production possibilities frontier is equal to −0.01.
43. Suppose one worker in New Ralph Island can produce 40 walking sticks or 10 boomerangs each hour. The
opportunity cost of producing 1 walking stick is _____.
a.
40 boomerangs
b.
0.01 hour of labor
c.
4 boomerangs
d.
0.25 boomerangs
e.
0.5 hours of labor
44. International trade is most likely to occur whenever:
a.
nations have an absolute advantage in the production of goods.
b.
all of the trading nations are self-sufficient.
c.
world production equals world consumption.
d.
each of the trading nations gains from trade.
e.
labor is cheaper abroad.

Name:
Class:
Date:
Chapter 19: International Trade
45. Which of the following does not result in a mutually beneficial trade between two countries?
a.
One country having a higher opportunity cost of production of a good than the other
b.
One country having an abundant supply of natural resources than the other
c.
One country’s production being more efficient than the other
d.
One country having an absolute advantage over the other
e.
One country having a comparative advantage in producing a good than the other
46. If a country has an absolute advantage in producing a good, _____.
a.
the country is able to produce that good using fewer resources than other countries
b.
the opportunity cost of producing the good is the lowest in that country
c.
the productivity of workers in that country is lower than that in all countries
d.
the country produces as many units of the good as demanded domestically
e.
countries of the same size have the same opportunity cost of producing both goods
47. In a two-country, two-commodity framework, when one country has an absolute advantage in the production of both
commodities, _____.
a.
autarky is always preferred to trade
b.
differences in the opportunity cost of production between the two countries ensure that specialization and trade
result in mutual gains
c.
the country with the lowest opportunity cost of production is the least competitive in international markets
d.
the countries gain from mutual trade as long as tastes differ across countries
e.
the countries gain from specialization and exchange as long as they are the same size
48. The basis of the benefits of specialization is:
a.
comparative advantage.
b.
absolute advantage.
c.
the size of the country.
d.
identical production costs between two countries.
e.
agreeable terms of trade.
49. Which of the following factors is most significant in determining the pattern of international trade?
a.
Absolute advantage
b.
Diplomatic expertise
c.
Comparative advantage
d.
Overpowering military strength
e.
The size of a nation
Name:
Class:
Date:
Chapter 19: International Trade
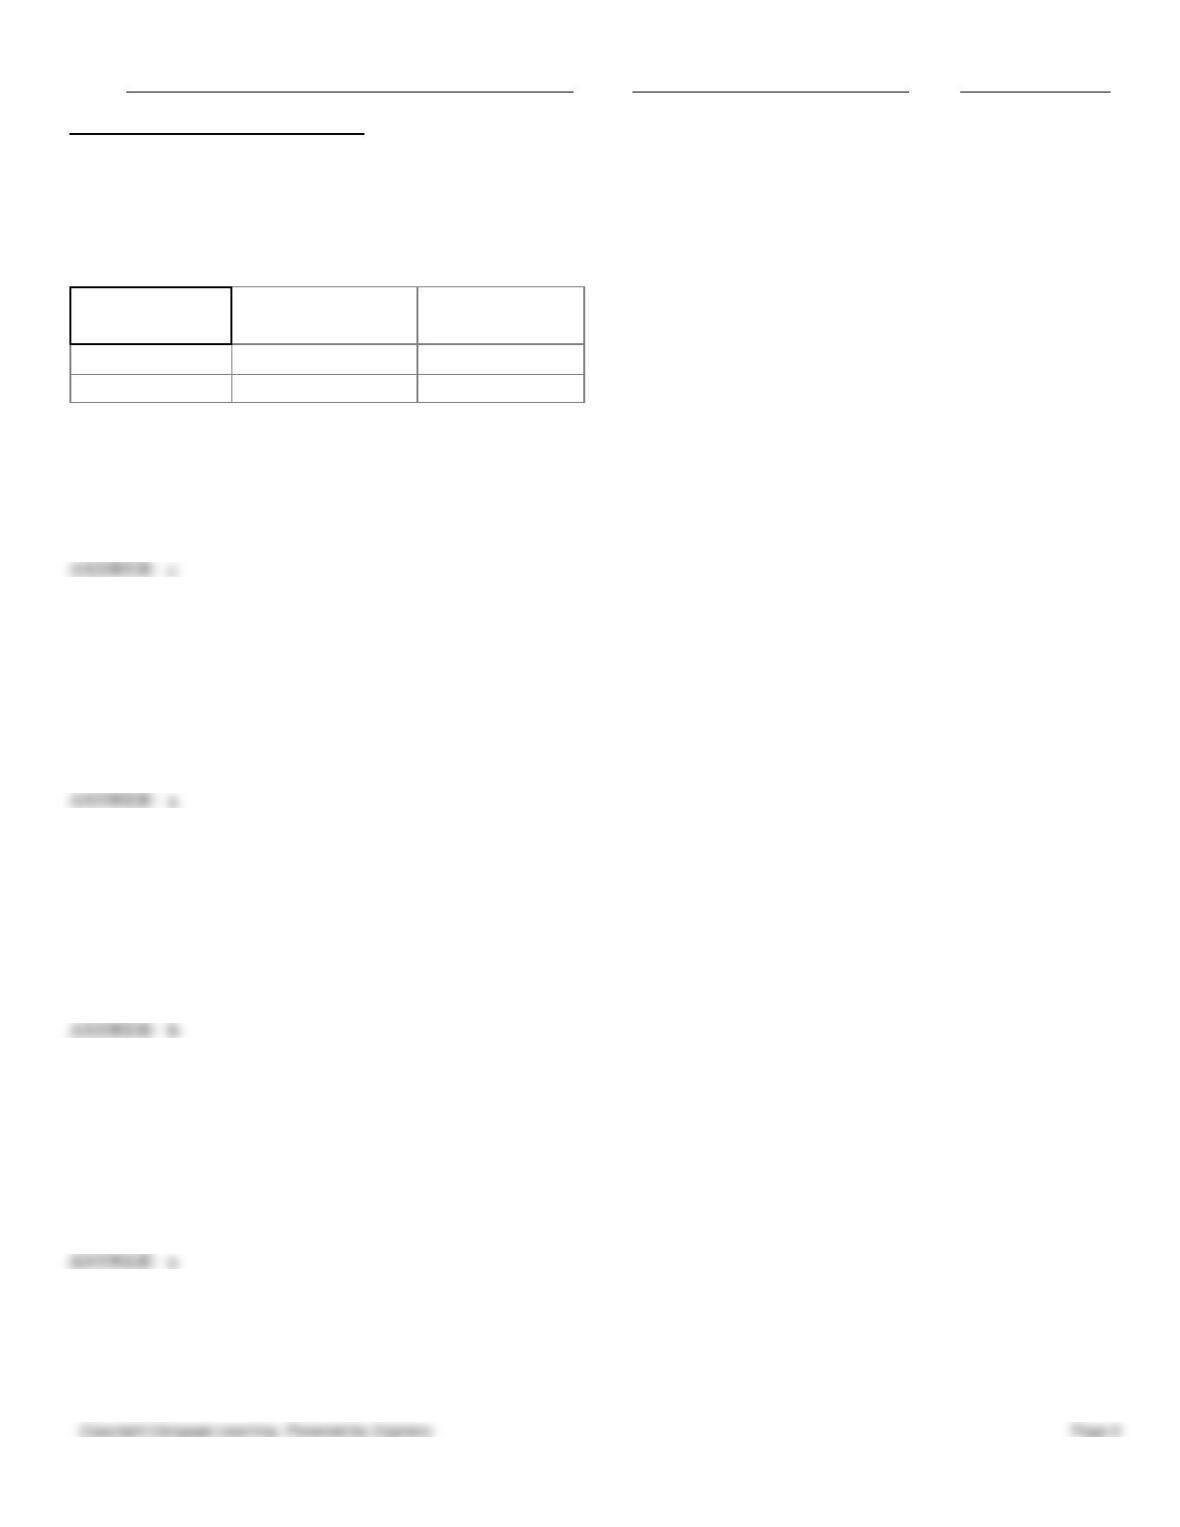
50. Suppose Aharoni and Kalinga are the only two countries in the world and they produce computers and shoes. Aharoni
has 100 workers, and Kalinga has 200 workers. The table below shows the per-day production possibilities for each
country. Aharoni has:
Table 19.1:
Computers
(units)
Shoes
(pairs)
Aharoni
600
300
Kalinga
200
400
a.
an absolute advantage in computers only.
b.
an absolute advantage in shoes only.
c.
a comparative advantage in computers.
d.
a comparative advantage in shoes.
e.
neither absolute advantage nor comparative advantage in computers.
c
51. Which of the following is true of the terms of trade?
a.
It is determined by supply and demand factors.
b.
It is a legal limit on the amount of a commodity that can be imported.
c.
It is determined by General Agreement on Tariffs and Trade.
d.
It is independent of the negotiations between trading partners.
e.
It is identical for all trading partners with differences in tastes.
a
52. The terms of trade refers to:
a.
the quantity of one good exchanged for a unit of another good.
b.
the world price of a good determined by the world supply and demand for the good.
c.
the quantity of a good demanded by U.S. consumers at a market-clearing price.
d.
the price of a good in a country after the imposition of a tariff.
e.
the maximum amount of credit that a country can borrow for a particular line of credit.
53. The consumption possibilities frontier shows:
a.
a nation’s possible combinations of goods available as a result of specialization and exchange.
b.
a nation’s opportunity cost of producing different goods for consumption.
c.
possible combinations of goods that residents of a nation consume at different income levels.
d.
the difference between the most that consumers would pay for a good and the actual amount they pay.
e.
a nation’s possible combinations of how much of one good exchanges for another.
a
54. Which of the following is true of a country’s production possibilities frontier?
a.
International trade makes it possible for a country’s consumption possibilities to exceed its production
possibilities.
b.
International trade requires that a country’s production possibilities exceed its consumption possibilities.

Name:
Class:
Date:
Chapter 19: International Trade
c.
A country’s production possibilities always equal its consumption possibilities.
d.
A country’s consumption possibilities can never equal its production possibilities because of leakages in the
system.
e.
The slope of a country’s production possibilities frontier is equal to the absolute advantage of producing a
particular good.
a
55. Which of the following is true of international trade?
a.
It allows a country to specialize in the production of certain goods and services.
b.
It leads to a reduction in the world production of goods and services.
c.
It allows a country to move to a lower consumption possibilities frontier.
d.
It allows a country’s consumption possibilities frontier to lie inside its production possibilities frontier.
e.
It makes a country’s production possibilities frontier a downward-sloping straight line.
a
56. World output will be maximized if each country:
a.
attempts to be self-sufficient.
b.
specializes in producing those goods in which it has a comparative advantage.
c.
specializes in producing those goods in which it has an absolute advantage.
d.
reduces its consumption possibilities.
e.
equals their consumption possibilities.
57. A country should export only those goods for which it has _____ relative to its trading partners.
a.
a higher absolute advantage
b.
lower terms of trade
c.
higher consumption possibilities
d.
a stronger domestic demand
e.
a lower opportunity cost
e
58. The source of gains from trade is _____.
a.
tariff revenue
b.
self-sufficiency
c.
terms of trade
d.
absolute advantage
e.
comparative advantage
e
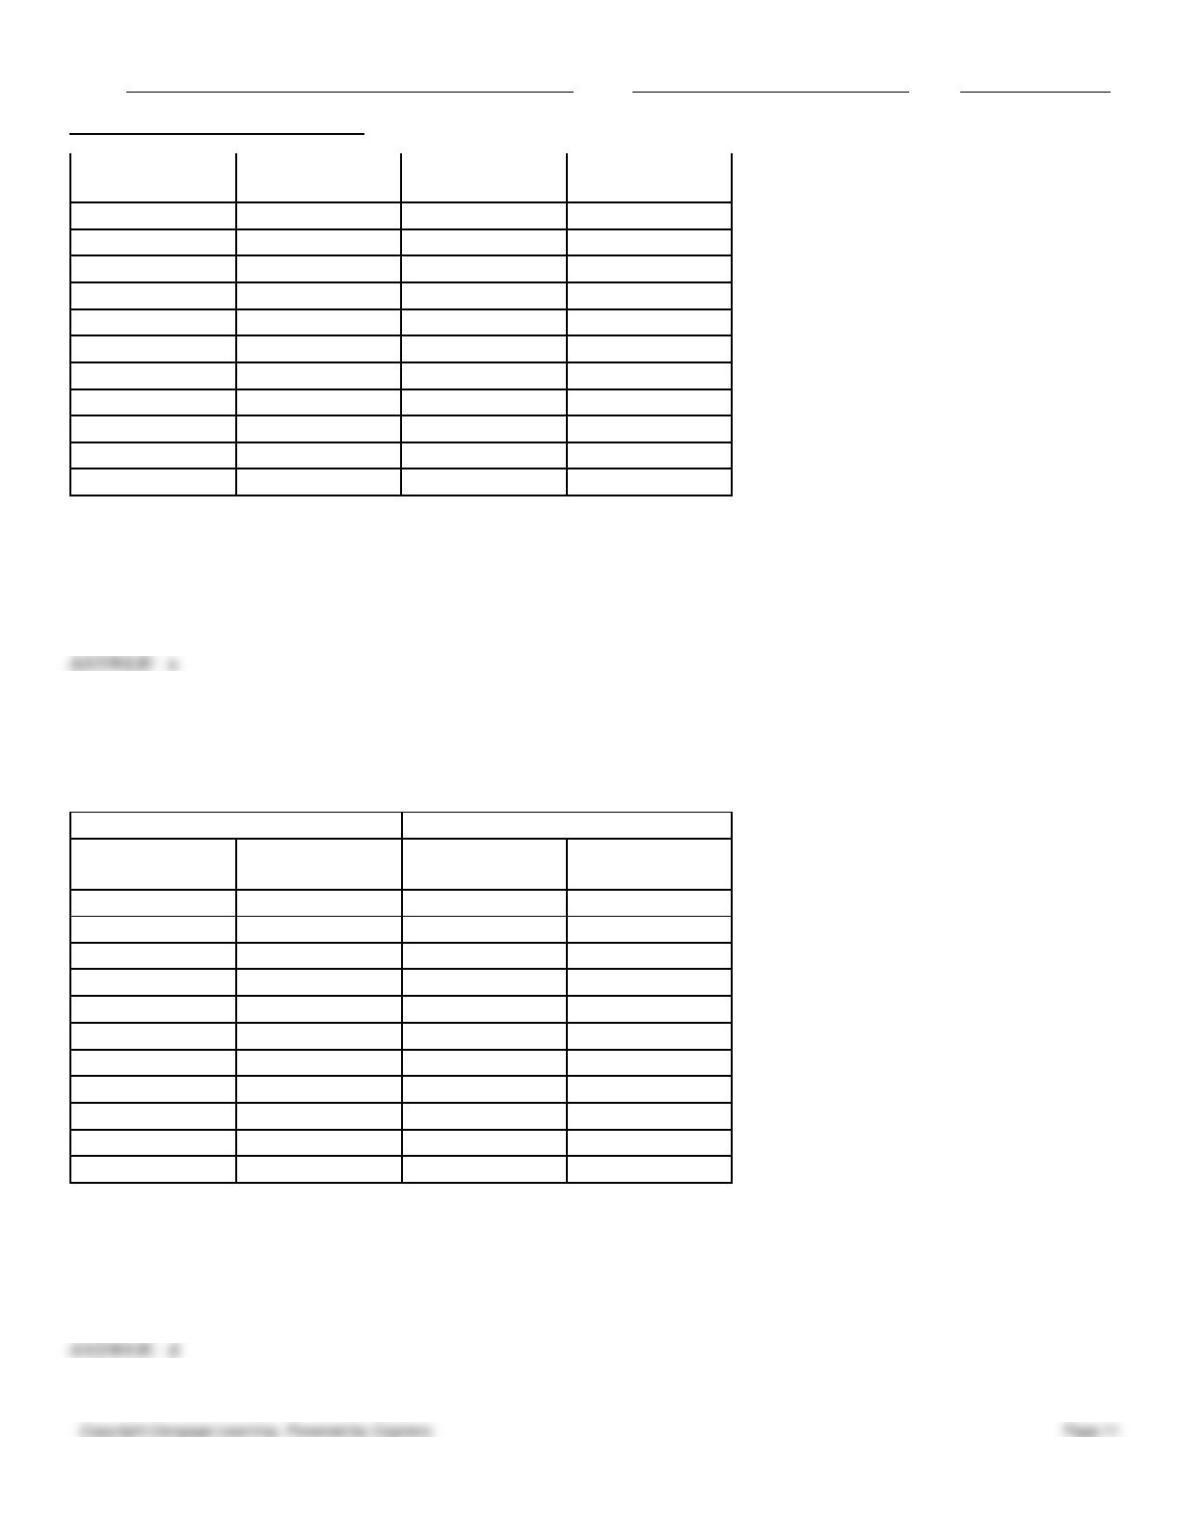
59. The following table shows per-day production data of rice and T-shirts for two countries, Cambria and Bodoni. Which
of the following is true in such a case?
Table 19.1
Cambria
Bodoni
Name:
Class:
Date:
Chapter 19: International Trade
Tons of rice per
day
T-shirts per day
Tons of rice per
day
T-shirts per day
20
0
100
0
18
80
90
100
16
160
80
200
14
240
70
300
12
320
60
400
10
400
50
500
8
480
40
600
6
560
30
700
4
640
20
800
2
720
10
900
0
800
0
1,000
a.
Bodoni has an absolute advantage in the production of both rice and T-shirts.
b.
Bodoni has an absolute advantage in the production of only rice.
c.
Bodoni has an absolute advantage in the production of T-shirts only.
d.
Cambria has an absolute advantage in the production of both rice and T-shirts.
e.
Cambria has an absolute advantage in the production of only T-shirts.
60. The following table shows per-day production data of rice and T-shirts for two countries, Cambria and Bodoni. Based
on the table, it can be said that the opportunity cost of a ton of rice in Bodoni is _____.
Table 19.1
Cambria
Bodoni
Tons of rice per
day
T-shirts per day
Tons of rice per
day
T-shirts per day
20
0
100
0
18
80
90
100
16
160
80
200
14
240
70
300
12
320
60
400
10
400
50
500
8
480
40
600
6
560
30
700
4
640
20
800
2
720
10
900
0
800
0
1000
a.
20 T-shirts
b.
3 T-shirts
c.
4 T-shirts
d.
10 T-shirts
e.
2 T-shirts
61. The following table shows per-day production data of rice and T-shirts for two countries, Cambria and Bodoni. Based
Name:
Class:
Date:
Chapter 19: International Trade
on the table, it can be said that the opportunity cost of 1 T-shirt in Bodoni is _____.
Table 19.1
Cambria
Bodoni
Tons of rice per
day
T-shirts per day
Tons of rice per
day
T-shirts per day
20
0
100
0
18
80
90
100
16
160
80
200
14
240
70
300
12
320
60
400
10
400
50
500
8
480
40
600
6
560
30
700
4
640
20
800
2
720
10
900
0
800
0
1000
a.
0.9 ton of rice
b.
0.5 ton of rice
c.
0.75 ton of rice
d.
0.01 ton of rice
e.
0.02 ton of rice
62. The following table shows per-day production data of rice and T-shirts for two countries, Cambria and Bodoni. Based
on the table, it can be said that the opportunity cost of 1 T-shirt in Cambria is _____.
Table 19.1
Cambria
Bodoni
Tons of rice per
day
T-shirts per day
Tons of rice per
day
T-shirts per day
20
0
100
0
18
80
90
100
16
160
80
200
14
240
70
300
12
320
60
400
10
400
50
500
8
480
40
600
6
560
30
700
4
640
20
800
2
720
10
900
0
800
0
1000
a.
4 tons of rice
b.
0.5 ton of rice
c.
0.75 ton of rice
d.
0.025 ton of rice
Name:
Class:
Date:
Chapter 19: International Trade
e.
2 tons of rice
63. The following table shows per-day production data of rice and T-shirts for two countries, Cambria and Bodoni. Based
on the table, it can be said that the opportunity cost of 1 ton of rice in Cambria is _____.
Table 19.1
Cambria
Bodoni
Tons of rice per
day
T-shirts per day
Tons of rice per
day
T-shirts per day
20
0
100
0
18
80
90
100
16
160
80
200
14
240
70
300
12
320
60
400
10
400
50
500
8
480
40
600
6
560
30
700
4
640
20
800
2
720
10
900
0
800
0
1000
a.
3 T-shirts
b.
10 T-shirts
c.
20 T-shirts
d.
30 T-shirts
e.
40 T-shirts
e
64. Differences in resource endowments are differences in:
a.
tariffs charged by each country.
b.
consumption patterns across nations.
c.
production patterns across nations.
d.
the quantity, but not the quality, of resources available in different nations.
e.
the quality and quantity of resources available in different nations.
e
65. The United States is a major exporter of _____.
a.
diamonds
b.
bananas
c.
coffee
d.
corn
e.
gold
66. Differences in tastes among nations:

Name:
Class:
Date:
Chapter 19: International Trade
a.
make gains from trade possible even in the absence of differences in resource endowments.
b.
make gains from trade possible only when there are differences in resource endowments.
c.
negate any potential gains from trade.
d.
are caused by differences in resource endowments.
e.
occur only among countries whose people are of different religions.
67. If production is subject to economies of scale, _____.
a.
countries can gain from trade if each nation specializes
b.
the domestic price will be above the world price and the quantity produced will be below the free trade level
c.
higher output levels result in higher average production costs
d.
every consumer gets to buy goods at their market-clearing prices
e.
autarky will be preferred to trade
68. One reason for international specialization is:
a.
a high world price for a good.
b.
higher trade restrictions imposed by a national government.
c.
diminishing returns to a variable factor of production.
d.
the different resource endowments throughout the world.
e.
the difference in benefits that consumers and producers get from domestic market exchange.
69. Which of the following results in international specialization?
a.
Differing consumer tastes
b.
Diseconomies of scale in production
c.
A high world price for a good
d.
Diminishing returns to a variable factor of production
e.
Differences in benefits that consumers and producers get from domestic market exchange
70. Which of the following reasons best explains U.S. imports of crude oil from Saudi Arabia and diamonds from South
Africa?
a.
Differences in resource endowments
b.
Economies of scale
c.
Differences in tastes
d.
Import tariffs
e.
Import quota
71. Which of the following reasons best explains why the United States is a net importer of crude oil and metals and a net
exporter of farm crops?
a.
Differences in resource endowments
b.
Economies of scale

Name:
Class:
Date:
Chapter 19: International Trade
c.
Differences in tastes
d.
Import quota
e.
Import tariffs
72. Which of the following reasons explains why many countries with relatively small populations import automobiles
from Japan, U.S., and Germany rather than produce them domestically?
a.
Differences in resource endowments
b.
Economies of scale
c.
Differences in tastes
d.
Import quota
e.
Import tariffs
73. Economies of scale in the production of a good implies that:
a.
the long-run average cost of production rises as the scale of operation expands.
b.
the marginal cost of production falls below zero as the scale of operation contracts.
c.
the long-run average cost of production falls as the scale of operation expands.
d.
the long-run average cost of production remains the same as the scale of operation increases.
e.
the marginal output decreases as the amount of a factor of production is incrementally increased.
74. Which of the following is not a reason for international specialization?
a.
Some countries have educated, trained workers, while other countries have unskilled workers.
b.
Tastes and preferences tend to be different in different countries.
c.
Economies of scale can allow larger, specialized producers to operate at lower average cost.
d.
People prefer having a choice of products.
e.
The world price of a good is determined by the world supply and demand for it.
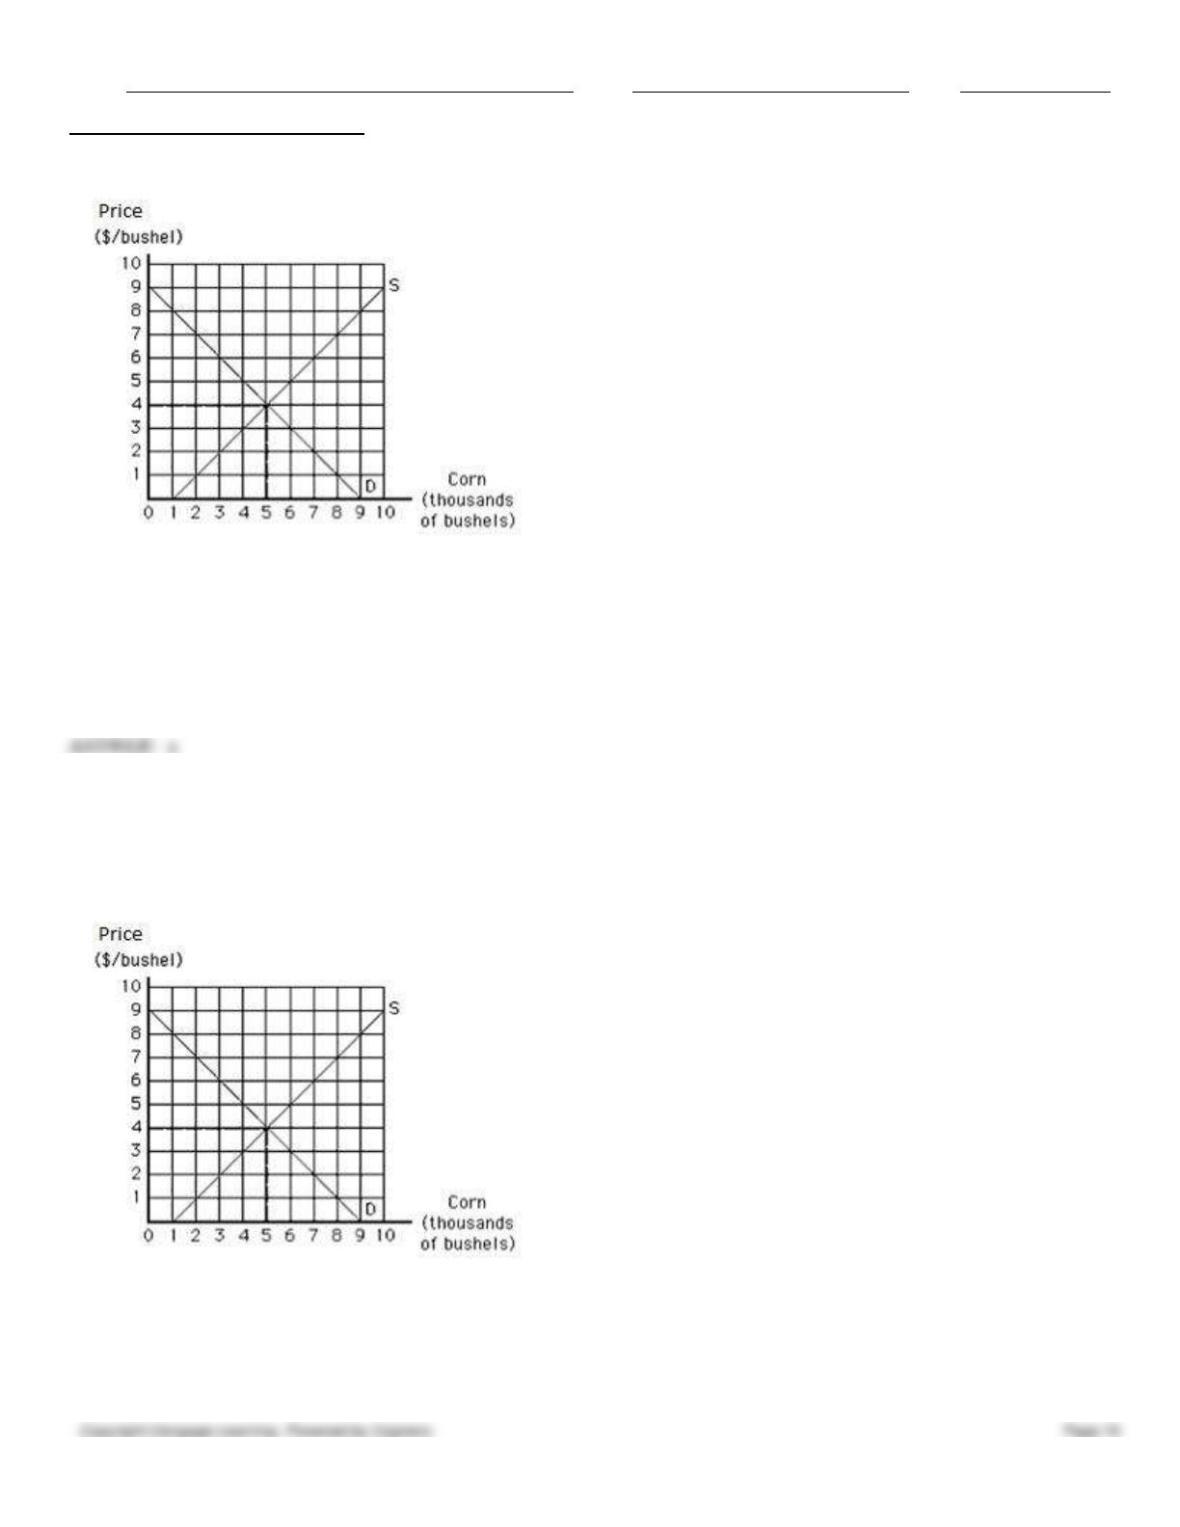
75. The following graph shows the market equilibrium for corn in the United States. If the world price of corn is $2 and
there are no trade restrictions, the United States will:
Figure 19.1
Name:
Class:
Date:
Chapter 19: International Trade
a.
produce 3,000 bushels of corn, consume 7,000 bushels of corn, and import 4,000 bushels of corn.
b.
produce 3,000 bushels of corn, consume 7,000 bushels of corn, and export 4,000 bushels of corn.
c.
have an excess supply of corn.
d.
produce 7,000 bushels of corn.
e.
produce 5,000 bushels of corn, consume 7,000 bushels of corn, and import 2,000 bushels of corn.
76. The following graph shows the market equilibrium for corn in the United States. If the world price of corn is $6 and
there are no trade restrictions, the United States will:
Figure 19.1
a.
produce 7,000 bushels of corn, consume 3,000 bushels of corn, and import 4,000 bushels of corn.
b.
produce 7,000 bushels of corn, consume 3,000 bushels of corn, and export 4,000 bushels of corn.
c.
have an excess demand for corn.
Name:
Class:
Date:
Chapter 19: International Trade
d.
produce 3,000 bushels of corn, consume 7,000 bushels of corn, and import 4,000 bushels of corn.
e.
produce 3,000 bushels of corn, consume 7,000 bushels of corn, and export 4,000 bushels of corn.
77. The following table shows the demand, supply, and price of tulips in the Netherlands. If the world price of tulips is $4
and there are no trade restrictions, the Netherlands will:
Table 19.2
Domestic Supply and Demand
for Tulips in the Netherlands
Demand
Supply
Q
P($)
Q
P($)
12,000
0
6,000
0
10,000
1
7,000
1
8,000
2
8,000
2
6,000
3
9,000
3
4,000
4
10,000
4
a.
produce 10,000, consume 4,000, and import 6,000 tulips.
b.
produce 10,000, consume 4,000, and export 6,000 tulips.
c.
produce 4,000, consume 10,000, and import 6,000 tulips.
d.
produce 9,000, consume 6,000, and export 6,000 tulips.
e.
import all of the tulips that it consumes.
78. The following table shows the demand, supply, and price of tulips in the Netherlands. If the world price of tulips is $1
and there are no trade restrictions, the Netherlands will:
Table 19.2
Domestic Supply and Demand
for Tulips in the Netherlands
Demand
Supply
Q
P($)
Q
P($)
12,000
0
6,000
0
10,000
1
7,000
1
8,000
2
8,000
2
6,000
3
9,000
3
4,000
4
10,000
4
a.
produce 7,000, consume 10,000, and export 3,000 tulips.
b.
produce 10,000 and consume 10,000 tulips.
c.
produce 9,000, consume 6,000, and export 6,000 tulips.
d.
import all of the tulips that it consumes.
e.
consume all of the tulips that it produces.
79. The following table shows the demand, supply, and price of tulips in the Netherlands. If the world price of tulips is $4
and there are no trade restrictions, the Netherlands will:
Name:
Class:
Date:
Chapter 19: International Trade
Table 19.2
Domestic Supply and Demand
for Tulips in the Netherlands
Demand
Supply
Q
P($)
Q
P($)
12,000
0
6,000
0
10,000
1
7,000
1
8,000
2
8,000
2
6,000
3
9,000
3
4,000
4
10,000
4
a.
produce 10,000, consume 4,000, and import 6,000 tulips.
b.
produce 10,000 and consume 10,000 tulips.
c.
produce 8,000 and consume 8,000 tulips.
d.
import all the tulips it consumes.
e.
consume only some of the tulips it produces.
80. If there are no trade restrictions, a country will import a particular good if:
a.
domestic quantity supplied equals domestic quantity demanded at the world price.
b.
there is excess domestic quantity demanded at the world price.
c.
the quantity of the good demanded by the domestic consumers decreases.
d.
the quantity of the good supplied by the domestic producers increases.
e.
the world price of the good is higher than its domestic price.
81. Unless there are barriers to prevent free international trade, a country becomes an importer:
a.
when the world price exceeds the domestic price.
b.
when the domestic price exceeds the world price.
c.
when there is an excess supply in the domestic market.
d.
when it wants to expand its scale of operation.
e.
when the opportunity cost of producing a good is lower relative to other countries.
82. When a country imposes a per-unit tariff on an imported good or service, _____.
a.
the price that domestic consumers pay for the import falls
b.
the quantity of the good or service imported into the country declines
c.
the quantity of the good or service imported into the country increases
d.
the price at which any supplier can sell output in the world market decreases
e.
the quantity of the good or service demanded by the consumers increases
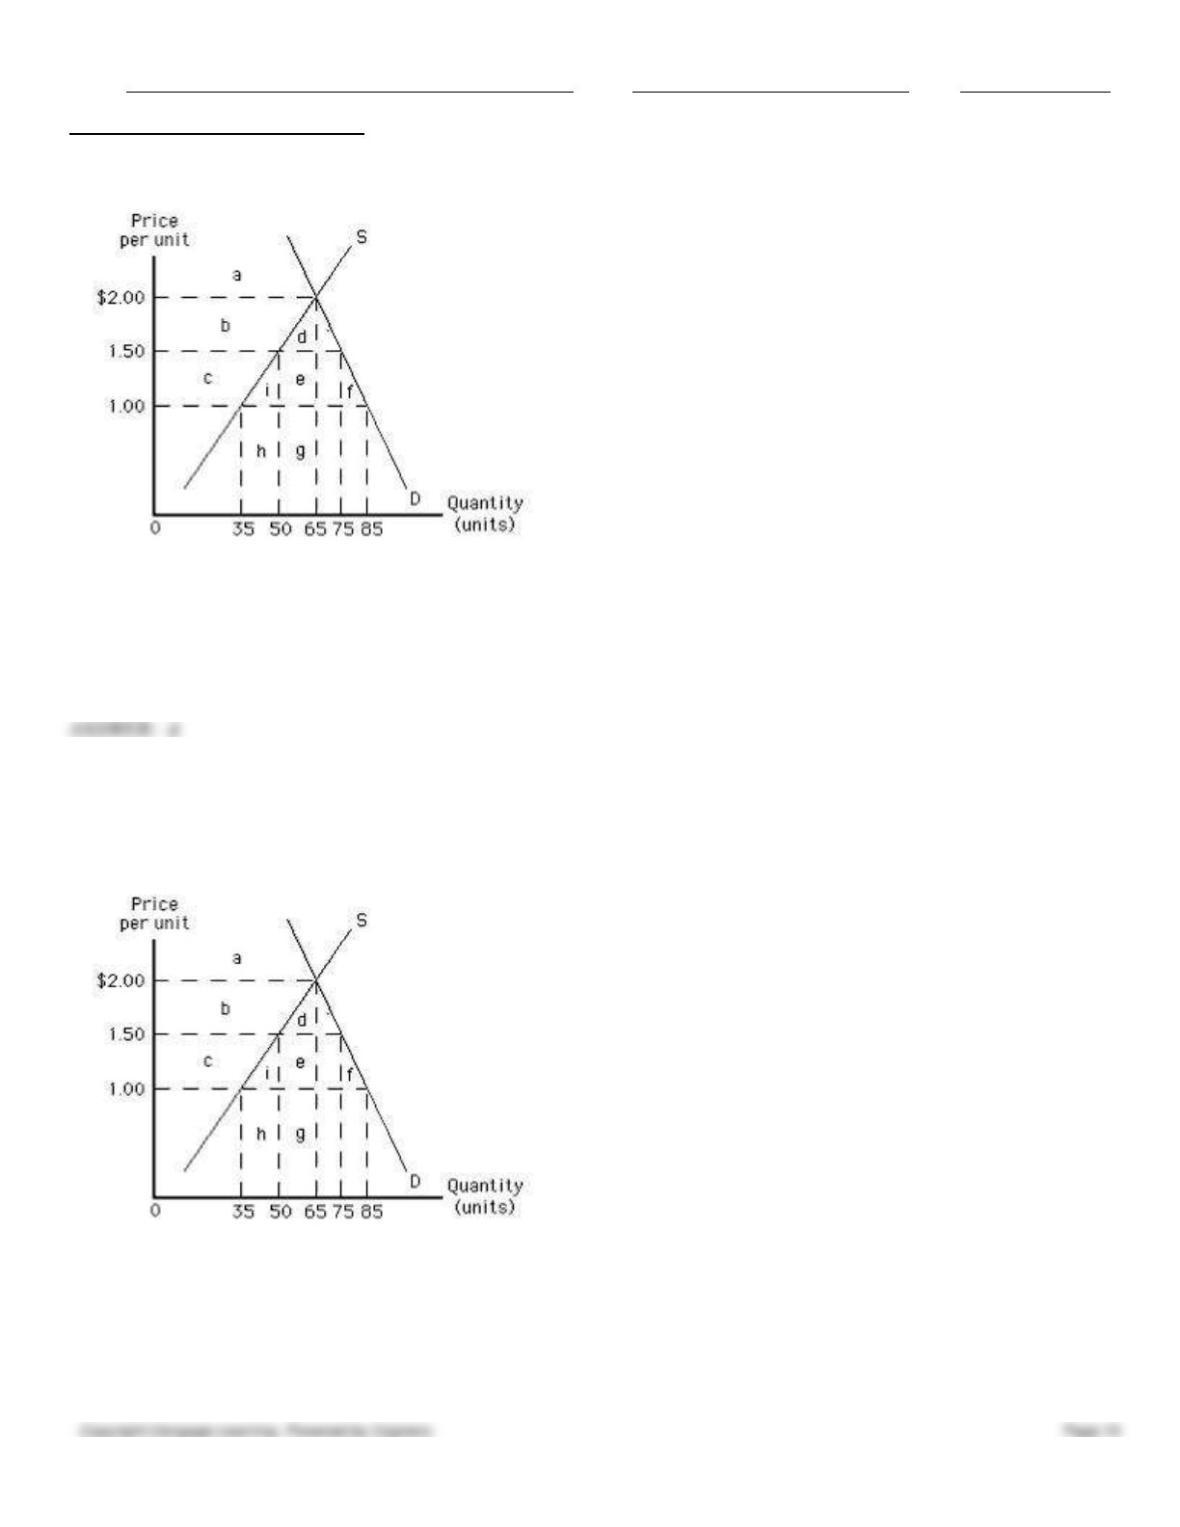
83. The following graph shows the demand for and domestic supply of a good in a country. If the country decides to trade,
then at a world price of $1.00 _____.
Name:
Class:
Date:
Chapter 19: International Trade
Figure 19.2
a.
20 units will be exported
b.
20 units will be imported
c.
50 units will be exported
d.
50 units will be imported
e.
10 units will be exported
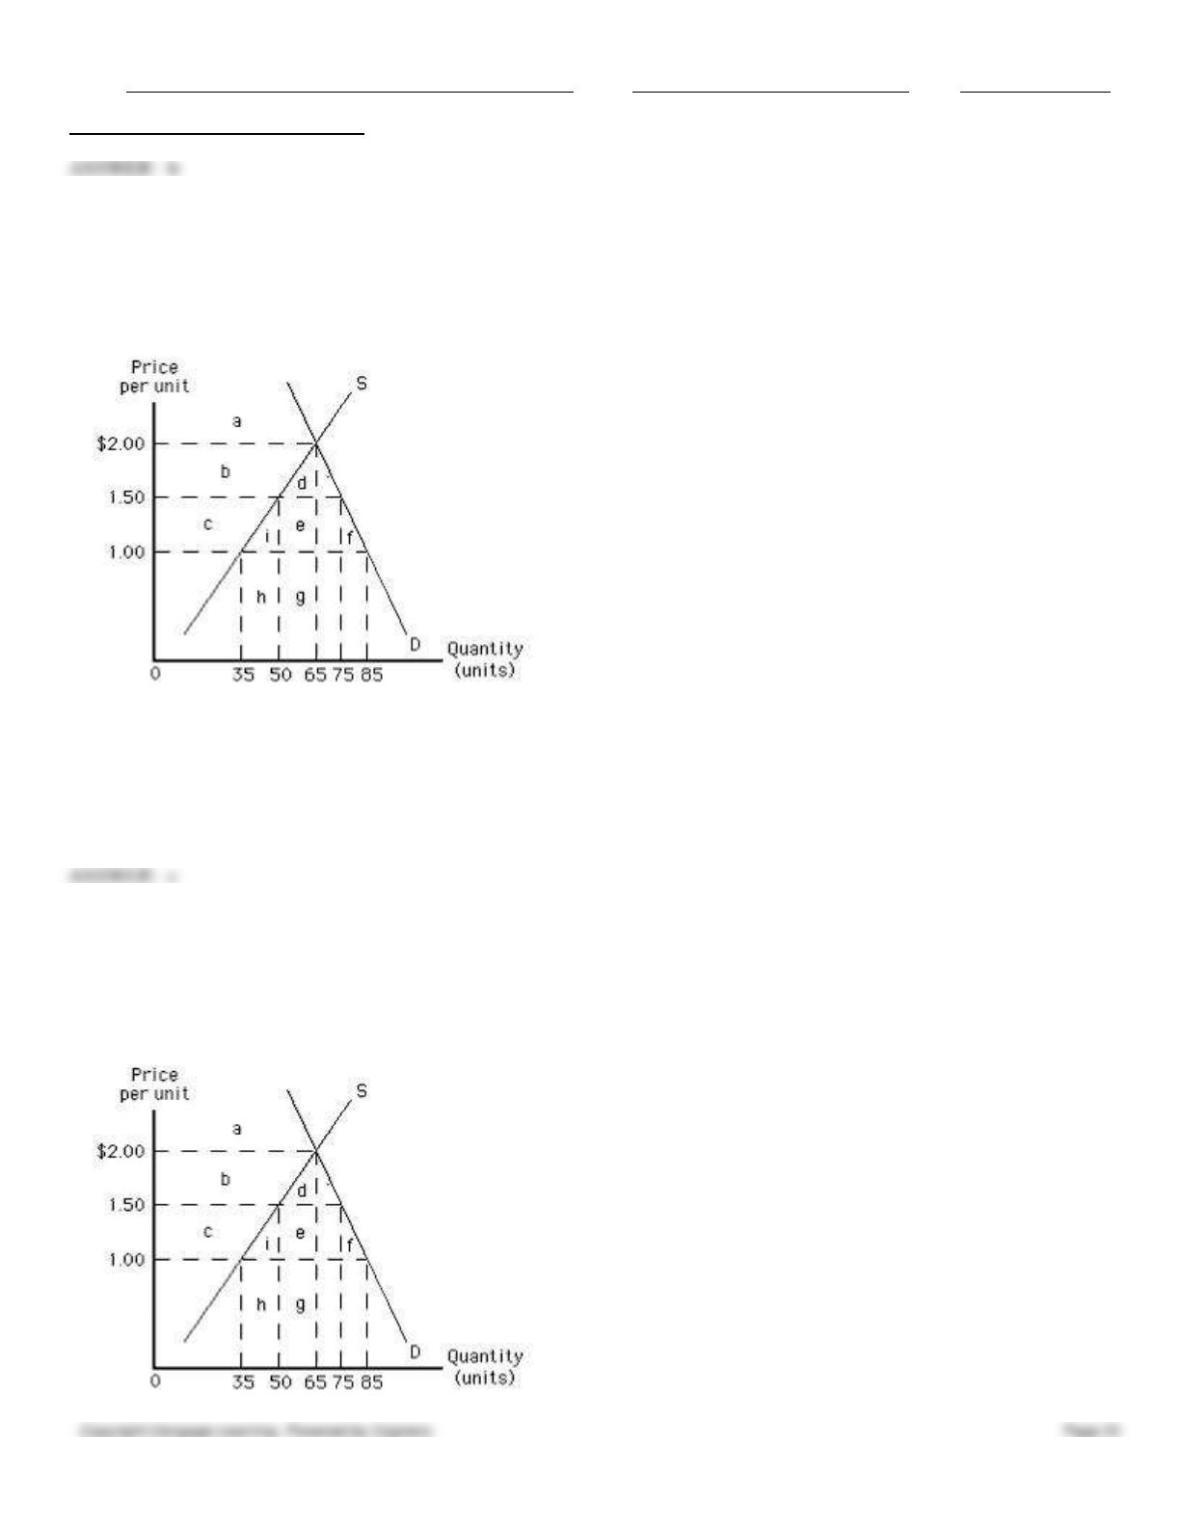
84. The following graph shows U.S. demand for and domestic supply of a good. Suppose the world price of the good is
$1.00 per unit and a specific tariff of $0.50 per unit is imposed on each unit of imported good. In such a case, _____.
Figure 19.2
a.
25 units will be exported
b.
25 units will be imported
c.
50 units will be exported
d.
50 units will be imported
e.
10 units will be exported
Name:
Class:
Date:
Chapter 19: International Trade
b
85. The following graph shows U.S. demand for and domestic supply of a good. Suppose the world price of the good is
$1.00 per unit and a specific tariff of $0.50 per unit is imposed on each unit of imported good. In such a case, the loss of
consumer surplus as a result of a tariff of $0.50 per unit is represented by the area _____.
Figure 19.2
a.
a
b.
b + d
c.
c + i + e + f
d.
c
e.
d
c
86. The following graph shows U.S. demand for and domestic supply of a good. Suppose the world price of the good is
$1.00 per unit and a specific tariff of $0.50 per unit is imposed on each unit of imported good. In such a case, the gain in
producer surplus as a result of a tariff of $0.50 per unit is represented by the area _____.
Figure 19.2