38. Nonexclusion Concept. Many public goods display the attribute of being nonexclusionary in consumption.
A.
Explain the nonexclusion concept.
B.
Do educational TV broadcasts display both the nonrival and nonexclusion attributes?
C.
With the emergence and popularity of cable TV, is an optimal amount of educational TV likely to be provided by the private sector?
39. Hidden Preferences Problem. Public goods that incorporate both the nonrival consumption and
nonexclusive attributes involve a number of difficulties in demand estimation.
A.
What is the hidden preferences problem?
B.
How is the hidden preferences problem overcome in practice?
C.
Is the hidden preferences problem relevant for all public goods, or only for those that also display the nonexclusion characteristic?
40. Demand Estimation for Public Goods. Assume that students and nonstudents have revealed their group
demands for secondary education, a public good, in the local school district as follows:
P1
= $5,000 – Q
(Student demand)
P2
= $2,500 – Q
(Nonstudent demand)
where P is price and Q is the number of student educated per year in the local school district.
A.
Calculate the total or aggregate demand for secondary education.
B.
The marginal cost of secondary education is given by the expression:
MC
= $500 + $5Q
where MC is marginal cost and Q is again the number of students.
Determine the socially optimal amount of publicly-supported secondary education in the local school district.
Total demand
= P1 + P2
= $5,000 – Q + $2,500 – Q
= $7,500 – $2Q
Demand
= Supply
P1 + P2
= MC
$7,500 – $2Q
= $500 + 5Q
= 7,000
Q
= 1,000
And,
P
= $7,500 – $2(1,000) = $5,500
(Demand)
P
= $500 + $5(1,000) = $5,500
(Supply)
41. Demand Estimation for Public Goods. Assume that patients and nonpatients have revealed their group
demands for hospital emergency room service, a public good, as follows:
Q
= 20,000 – 50P
(Patients demand)
Q
= 20,000 – 200P
(Nonpatients demand)
where Q is the number of emergency room patients per year at the local hospital and P is the price of emergency room service.
A.
Calculate the total or aggregate demand for emergency room service.
B.
The marginal cost of emergency room service is given by the expression:
MC
= $50 + $0.02Q
where MC is marginal cost and Q is again the number of patients.
Determine the socially optimal amount of publicly-supported emergency room service.
For patient demand:
Q
= 20,000 – 50P
= Q – 20,000
P
= $400 – $0.02Q
For nonpatient demand:
Q
= 20,000 – 200P
-200P
= Q – 20,000
P
= $100 – $0.005Q
Then,
Total demand
= Patient demand + Nonpatient demand
= $400 – $0.02Q + $100 – $0.005Q
= $500 – $0.025Q
B.
The socially optimal amount of publicly-supported emergency room service is determined by the intersection of demand and supply:
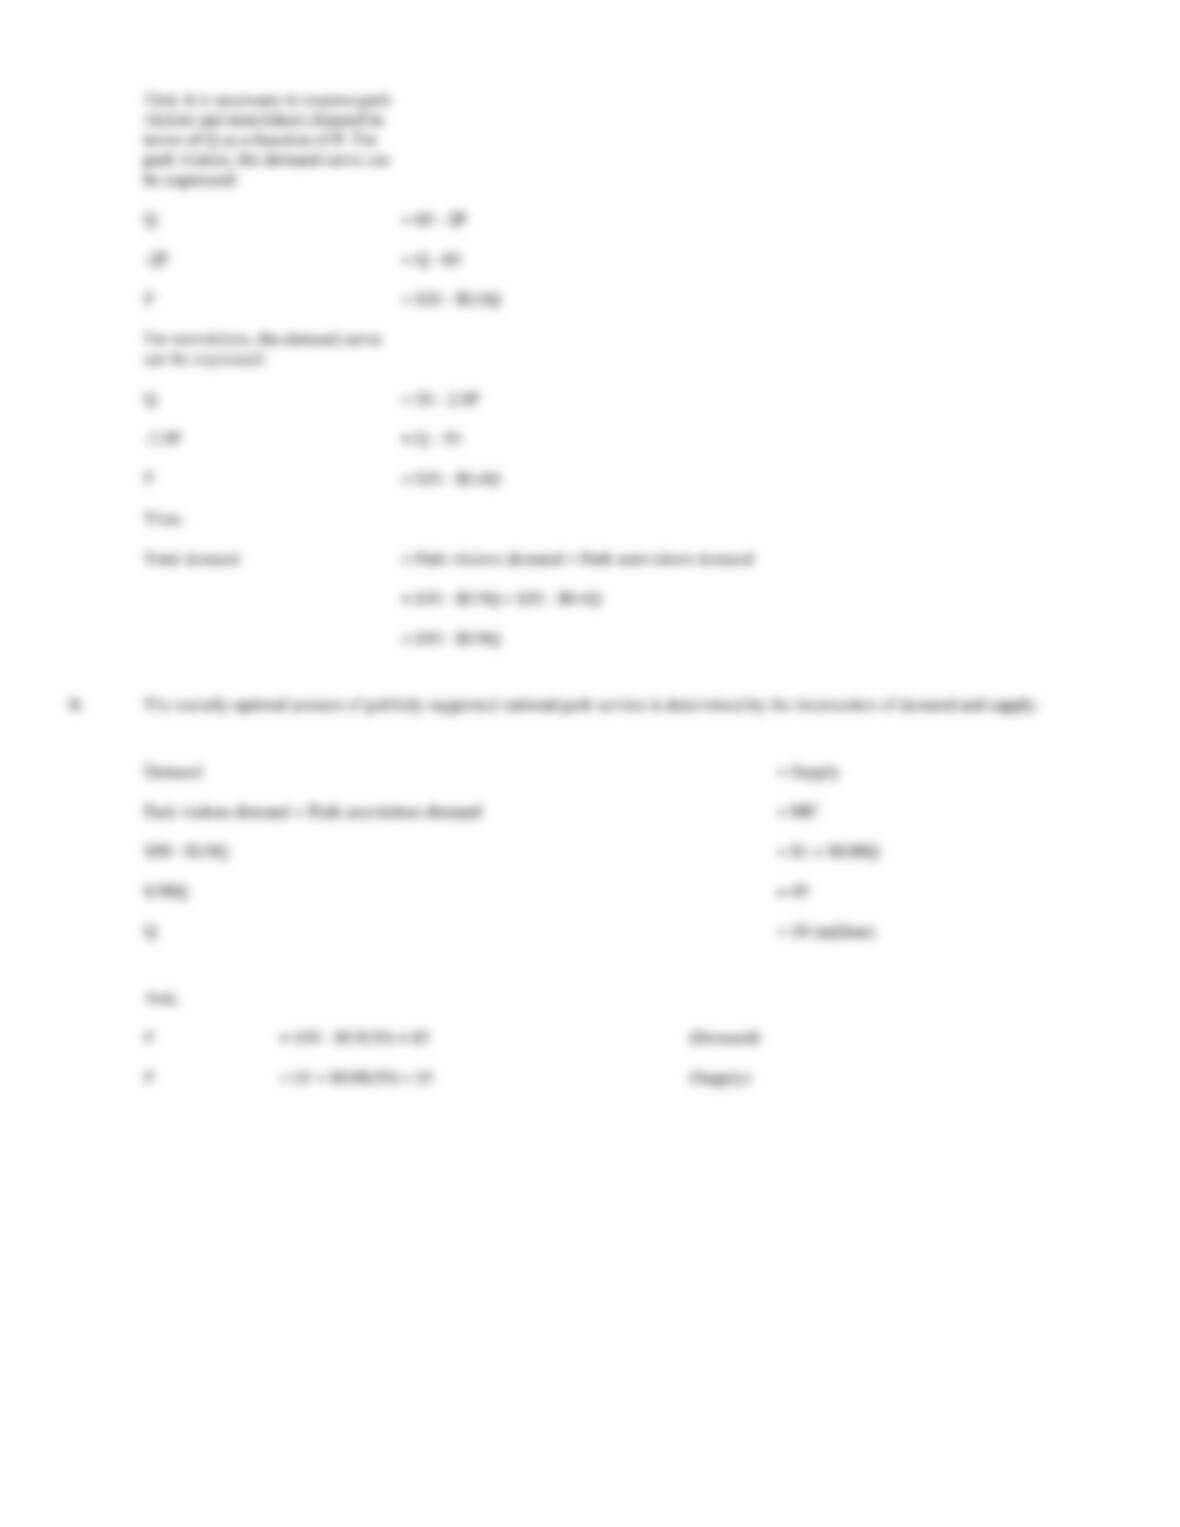
42. Demand Estimation for Public Goods. Assume that park visitors and nonvisitors have revealed their
group demands for national park service, a public good, as follows:
Q
= 60 – 2P
(Park visitor demand)
Q
= 50 – 2.5P
(Park nonvisitors demand)
where Q is the number of persons that attend national parks (in millions) and P is the price of admission.
A.
Calculate the total or aggregate demand for national park service.
B.
The marginal cost of national park service is given by the expression:
MC
= $1 + $0.08Q
where MC is marginal cost and Q is again the number of park visitors (in millions). Determine the socially optimal amount of
publicly-supported national park service.
Total or aggregate demand for public goods such as national park service is determined by a vertical summation of individual park
Demand
= Supply
Patient demand + Nonpatient demand
= MC
$500 – $0.025Q
= $50 + $0.02Q
0.045Q
= 450
Q
= 10,000
And,
P
= $500 – $0.025(10,000) = $250
(Demand)
P
= $50 + $0.02(10,000) = $250
(Supply)
43. Demand Estimation for Public Goods. The nonrival consumption concept gives rise to fundamental
differences between demand estimation for public goods and demand estimation for private goods.
A.
Explain the graphical difference between aggregating individual demand for public goods versus private goods.
B.
Can the aggregate value of a given public good ever be less than the maximum value placed upon it by a single individual?
Q
= 60 – 2P
= Q – 60
P
= $30 – $0.5Q
Q
= 50 – 2.5P
-2.5P
= Q – 50
P
= $20 – $0.4Q
Then,
Total demand
= Park visitors demand + Park nonvisitors demand
= $30 – $0.5Q + $20 – $0.4Q
= $50 – $0.9Q
The socially optimal amount of publicly-supported national park service is determined by the intersection of demand and supply:
Demand
= Supply
Park visitors demand + Park nonvisitors demand
= MC
$50 – $0.9Q
= $1 + $0.08Q
0.98Q
= 49
Q
= 50 (million)
And,
P
= $50 – $0.9(50) = $5
(Demand)
P
= $1 + $0.08(50) = $5
(Supply)
44. Size of Government. Both unregulated private markets and government-administered resources have their
strengths and weaknesses.
A.
Discuss a primary weakness of the unregulated private-sector allocation of economic resources.
B.
Discuss a primary weakness of government-administered social programs or public-sector investment projects.
efficient and equitable allocation of economic resources extremely difficult.
45. Theory of Regulation. The Badger Power & Light Company generates electricity, and in the process emits
sulfur dioxide into the local atmosphere. As a concerned citizen, you are appalled at the aesthetic and
environmental implications of the company’s policies, as well as the potential health hazard to the local
population.
A.
Pollution is a negative production externality and an example of market failure. What might you cite as reasons why markets fail?
B.
In analyzing remedies to the current situation, consider two general types of controls to limit pollution:
Regulations—licenses, permits, compulsory standards, and so on.
Charges—excise taxes on polluting fuels (coal, oil, and so forth), pollution discharge taxes, and others.
Review each of these methods of pollution control.
1.
Determine the incentive structure for the polluter under each form of control.
2.
Decide who pays for a clean environment under each form of control. (Note that each form of control has definite implications about
who owns the property rights to the environment.)
3.
Defend a particular form of control on the basis of your analysis, including both efficiency and equity considerations.
Markets can fail due to:
(i)
Structural problems: Fewness in the number of buyers and/or sellers.
(ii)
Incentive problems: If some product benefit (cost) is not reflected in firm revenues (costs), then non-optimal production
quantities and output prices will result due to improper firm incentives.
Methods of pollution control:
(a)
Regulation: Incentive is to avoid regulation, be made a “special case.”
(b)
Charges: Incentive is to reduce pollution in order to avoid charges.
(a)
Regulation: Company (its customers) pays to reduce pollution.
(b)
Charges: Company (its customers) pays to reduce pollution. again, society’s right to a clean environment is implied.
46. Theory of Regulation. The New England Power & Light Company generates electricity, and in the process
emits sulfur dioxide into the local atmosphere. As a concerned citizen, you are appalled at the aesthetic and
environmental implications of the company’s policies, as well as the potential health hazard to the local
population.
A.
Pollution is a negative production externality and an example of market failure. What might you cite as reasons why markets fail?
B.
In analyzing remedies to the current situation, consider two general types of controls to limit pollution:
Regulations—licenses, permits, compulsory standards, and so on.
Payments—various types of government aid to help companies install pollution-control equipment. Aid can take the form of forgiven
local property taxes, income tax credits, special accelerated depreciation allowances for pollution-control equipment, low-cost
government loans, and so on.
Review each of these methods of pollution control and:
1.
Determine the incentive structure for the polluter under each form of control.
2.
Decide who pays for a clean environment under each form of control. (Note that each form of control has definite implications about
who owns the property rights to the environment.)
3.
Defend a particular form of control on the basis of your analysis, including both efficiency and equity considerations.
Markets can fail due to:
ves:
(a)
Regulation: Insures due process, a day in court, for the polluter.
(b)
Charges: Polluter should pay full costs of production consumption.
47. Costs of Regulation. The Montana Coal Company sells coal to electric utilities in the Pacific Northwest.
Unfortunately, Montana’s coal has high particulate content and, therefore, the company is adversely affected by
state and local regulations governing smoke and dust emissions at its customer’s electricity-generating plants.
Montana’s total cost and marginal cost relations are:
TC
= $187,500 + $5Q + $0.0003Q2
MC
= ¶TC/ ¶Q = $5 + $0.0006Q
where Q is tons of coal produced per month and TC includes a normal rate of return on investment.
A.
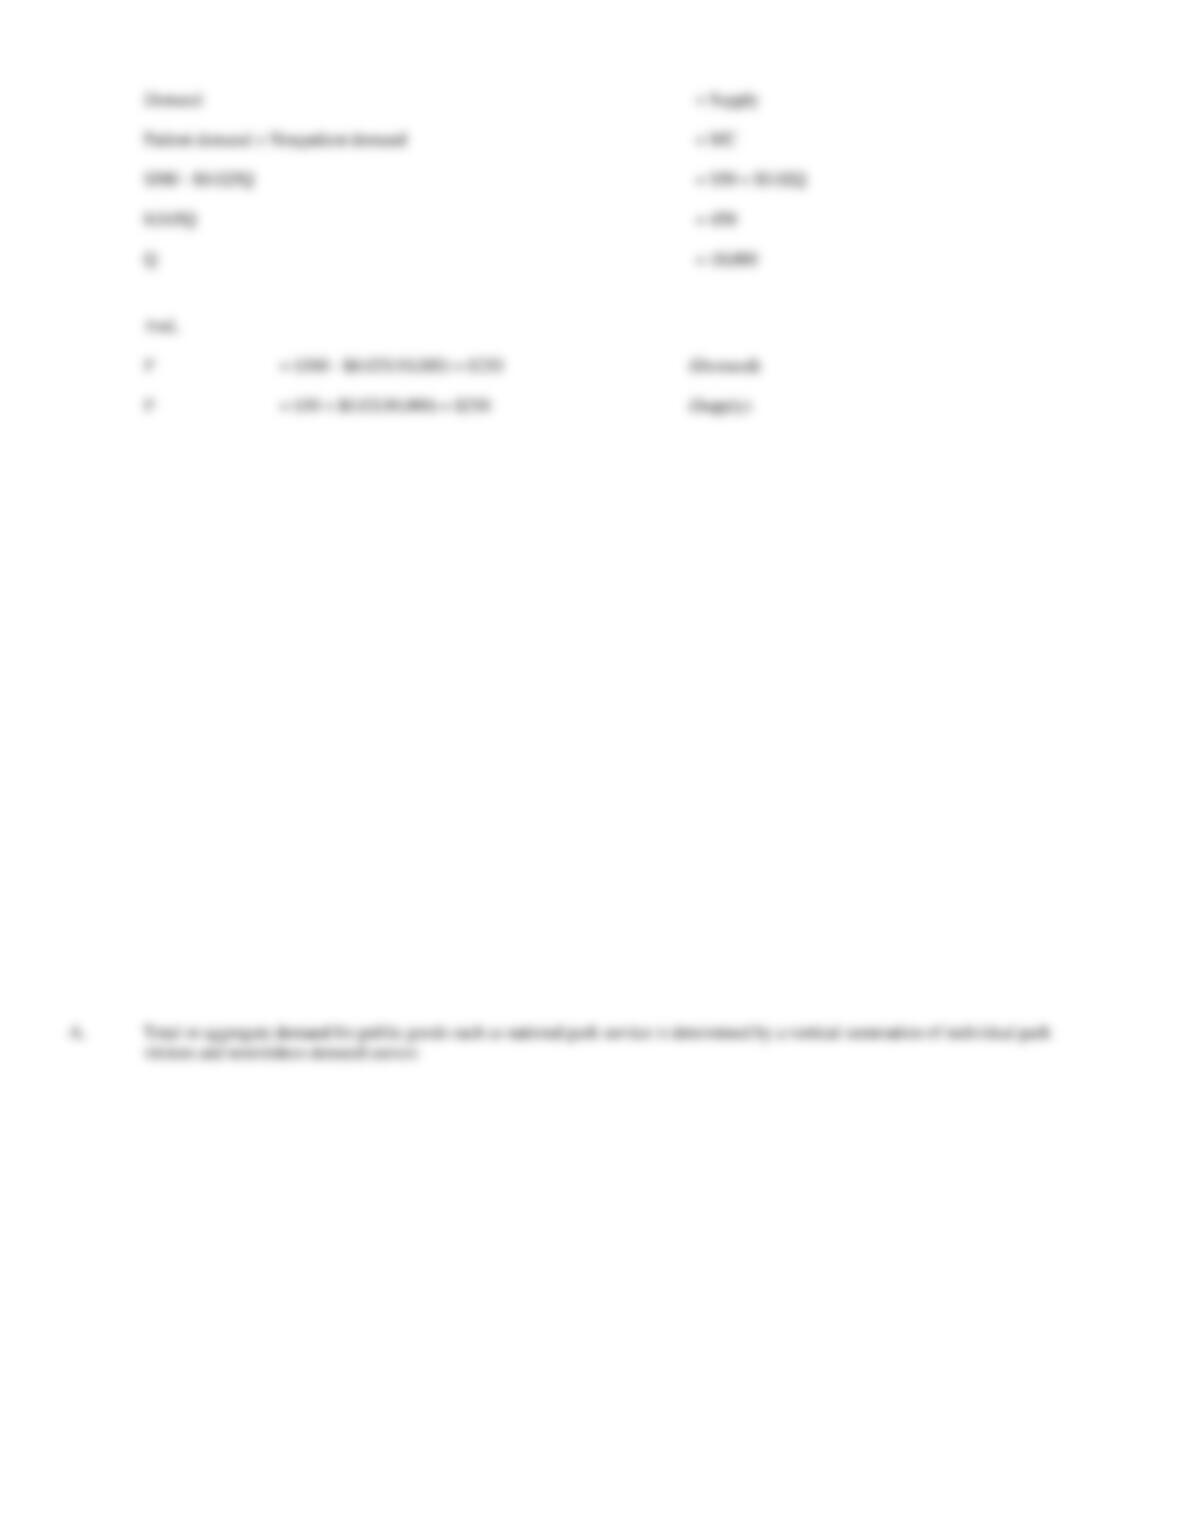
Calculate Montana’s profit at the profit-maximizing activity level if prices in the industry are stable at $20 per ton, and therefore
P = MR = $20.
B.
Calculate Montana’s optimal price, output, and profit levels if a new state regulation results in a $5 per ton cost increase that can be
fully passed onto customers.
C.
Determine the effect on output and profit if Montana is only able to pass onto consumers only $1 of the projected cost increase, and
must absorb the remaining $4 per ton cost increase.
Set MR = MC to find the profit-maximizing activity level:
= MC
= $5 + $0.0006Q
0.0006Q
= 15
Q
= 25,000
p
= TR – TC
= $20(25,000) – $187,500 – $5(25,000) – $0.0003(25,0002)
= $0
B.
If the $5 regulation-induced cost increase can be fully passed onto customers, then MR = $25 = $20 + $5. Therefore, the optimal P =
MR = $25 and the optimal activity level is unaffected because:
MR + $5
= MC + $5
= $10 + $0.0006Q
0.0006Q
= 15
Q
= 25,000
p
= TR – TC
= $25(25,000) – $187,500 – $10(25,000) – $0.0003(25,0002)
= $0
48. Benefit-cost Analysis. The economic valuation of human life has consequences for a broad range of
management decisions in both the private and public sectors. Because resources are limited for individual
companies and for society as a whole, rational decision makers cannot argue that any individual company or
society should spend “whatever it takes” to save a human life.
A.
Explain how public sector managers might obtain reliable life value estimates based upon actual economic behavior.
B.
Describe some of the limitations of such life value estimates based upon actual economic behavior.
= MC + $4
= $9 + 0.0006Q
0.0006Q
= 12
Q
= 20,000
p
= TR – TC
49. Privatization. With airline regulation, high prices were eaten away by ever-rising costs for new airplane
equipment, fancy meals, and redundant employees. In the post-deregulation period, passenger fares have
plummeted as consumers made known their preference for safe and reliable service with cheap airfares. Critics
of public sector management of the U.S. Post Office contend that experience with airline deregulation suggests
that privatization of the U.S. Post office would lead to dramatic cost reductions and service improvements.
A.
Explain how breaking the U.S. Post Office monopoly could help reduce the cost and improve the quality of first-class mail delivery.
B.
Explain why privatizing the U.S. Post Office might not lead to such advantages.
50. Economics of Health Care. Technological progress in the form of new medical knowledge, medicines,
treatments, and medical devices has allowed Americans and people worldwide to live longer, healthier lives. As
new treatment options become available, it is not surprising that the United States and other major industrialized
countries continue to shift more resources to health care. Research suggests that between 50 and 75 percent of
the growth rate in health expenditures in the United States is attributable to technological progress in health care
goods and services. However, the increase in resources devoted to health care has led to concern about its
affordability, both for families and for the Nation as a whole. The United States expends a higher fraction of
GDP on health care than does any other industrialized country. According to an international comparison
released in 2003, the United States spent 13.9 percent of GDP on health care in 2001, while the average among
industrialized countries was 8.4 percent of GDP. Measures of health outcomes such as longevity and infant
mortality, however, are not markedly different in the United States than in other advanced economies that spend
substantially less on health care.
A.
Use a normal good (demand-side) argument to explain why the U. S. consumer, among the richest in the world, spends a higher
percentage of income on health care than do consumers in most poorer countries.
B.
Use a supply-side argument to explain why the costs of providing health care services appear higher for Americans than for other
world-wide beneficiaries of health care innovation.
organization were focused on the timely and cost-effective meeting of customer needs.
delivery, FAX transmission of letters and other correspondence, and a wide variety of electronic message and image delivery systems.