70) If a tax was instituted such that every dollar collected in taxes from high income households
resulted in a distribution of $.80 to low income households
A) efficiency and equality of incomes would both decrease.
B) equality of incomes would increase but efficiency would decrease.
C) efficiency would increase but equality of incomes would decrease.
D) efficiency and equality of incomes would both increase.
71) One way the United States has tried to encourage welfare recipients to acquire human capital
is by
A) providing a free college education.
B) setting a 1-year limit on temporary assistance.
C) tax rebates.
D) requiring a adult member of the household to either work or perform community service.
72) Which of the following REDUCES equality of income or wealth relative to the market
distribution?
A) government payments to the poor
B) a regressive income tax
C) high taxes on bequests
D) non-assortative mating
73) Suppose that the income tax in the United States was such that all households had to pay 20
percent of their income to the government as taxes. This tax is an example of
A) a regressive tax.
B) a proportional tax.
C) a progressive tax.
D) an efficient tax.
74) The “big tradeoff” refers to the point that governmental redistribution of income causes
A) less efficiency because it weakens incentives to work.
B) less efficiency because it strengthens incentives to work.
C) more efficiency because it weakens incentives to work.
D) more efficiency because it strengthens incentives to work.
5 News Based Questions
1) According to an Asian Development Bank report in 2007, China’s Gini coefficient, a
statistical measure of wealth distribution in society, soared to 47.3 in 2004 from 40.7 in 1993,
putting the country at a level more typical of Latin America. China experienced ________.
A) a decrease in income inequality
B) an increase in income inequality
C) a decrease in income
D) an increase in income
2) When China embarked on market changes towards urbanization and manufacturing in 1978,
urban disposable incomes were 2.6 times greater than rural net income. By 2008 they were 3.3
times bigger. These market changes have led to
A) increased income inequality between rural and urban populations.
B) a decreased Gini ratio.
C) the Lorenz curve for income to move closer to the line of equality.
D) a movement towards a bell-shaped distribution of income.
3) When China embarked on market changes towards urbanization and manufacturing in 1978,
urban disposable incomes were 2.6 times greater than rural net income. By 2008 they were 3.3
times bigger. Which of the following have the market changes sketched above have most likely
NOT caused?
A) Increased income inequality between rural and urban populations
B) A movement towards a bell-shaped distribution of income
C) An increased Gini ratio
D) The Lorenz curve for income to move further away to the line of equality
4) Pamela Michelle Scott, a low income single mom, had just finished her monthly shopping to
purchase 30 days’ worth of meat from Hollins Market. She’s reared five healthy children and said
that she made good use of the free health clinics and food stamps. Pamela benefits from free
health clinics which are ________ and food stamps which is a ________.
A) Social Security programs; subsidized service
B) unemployment compensation programs; Social Security program
C) subsidized services; welfare program
D) welfare programs; unemployment compensation program
5) The 2010 Federal Personal Income six tax brackets range from 10 percent for individuals
earning less than $8,025 to 35 percent for those earning over $357,700. The personal income tax
system is
A) regressive.
B) progressive.
C) proportional.
D) flat-rate.
6) The Lithuanian tax rate for all citizens’ income is 24 percent and in Estonia, the tax rate is 21
percent. Lithuanian and Estonian income tax systems are examples of ________ taxes.
A) proportional
B) progressive
C) regressive
D) equality
7) The 2010 U.S. Federal Personal Income six tax brackets range from 10 percent for individuals
earning less than $8,025 to 35 percent for those earning over $357,700 whereas the Lithuanian
tax rate for all citizens’ income is 24 percent. The Lithuanian income tax system is a ________
tax and the U.S. income tax system is a ________ tax.
A) progressive; proportional
B) regressive; progressive
C) proportional; regressive
D) proportional; progressive
8) The Lithuanian tax rate for all citizens’ income is 24 percent. If the Lithuanian government
was concerned about income inequality, they should change the tax system from a system that is
currently ________ to a system that is ________.
A) progressive; proportional
B) regressive; progressive
C) proportional; progressive
D) proportional; regressive
9) Netflix, an online DVD rental service, was established in 1997. In 2008, Netflix has more than
8.2 million subscribers. This technology has ________ in the labor market for video rental
clerks.
A) decreased demand
B) increased demand
C) increased supply
D) decreased supply
10) Netflix, an online DVD rental service, was established in 1997. In 2010, Netflix has more
than 10 million subscribers. This technology has ________ in the labor market for computer
software programmers.
A) decreased demand
B) increased supply
C) decreased supply
D) increased demand
11) Median household income in the United States has increased from $38,771 in 1967 to
$51,017 in 2012. Based only on this fact, we can conclude that
A) Inequality is increasing in the United States.
B) Inequality is decreasing in the United States.
C) Inequality is not changing in the United States.
D) We cannot conclude anything about inequality in the United States without more information.
Household percent
Percent of
total income,
1990
Percent of
total income,
2011
Lowest 20 percent
3.8
3.4
Second 20 percent
9.6
8.7
Middle 20 percent
15.9
14.8
Next highest 20
percent
24.0
23.4
Highest 20 percent
46.6
49.7
12) Using the table provided above, what can be concluded about the Gini ratio and what does
this mean for income equality?
A) The Gini ratio is increasing which means there is greater income inequality.
B) The Gini ratio is increasing which means there is greater income equality.
C) The Gini ratio is decreasing which means there is greater income equality.
D) The Gini ratio is decreasing which means there is greater income inequality.
13) Using the table provided above, which of the following statements is TRUE?
A) Income inequality is decreasing.
B) Incomes are increasing.
C) Incomes are decreasing.
D) Income inequality is increasing.
14) Using the table provided above to construct Lorenz curves representing 1990 and 2011, what
do you discover and how is this interpreted?
A) The Lorenz curve for 1990 is further away from the line of equality than the curve for 2011.
This means that inequality is decreasing.
B) The Lorenz curve for 1990 is further away from the line of equality than the curve for 2011.
This means that inequality is increasing.
C) The Lorenz curve for 2011 is further away from the line of equality than the curve for 1990.
This means that inequality is increasing.
D) The Lorenz curve for 2011 is further away from the line of equality than the curve for 1990.
This means that inequality is decreasing.
15) According to the 2007/2008 United Nations Human Development Report, the Gini ratio for
Portugal is 38.5, Norway is 25.8, the United States is 40.8, and Russia is 39.9. Which of these
four countries has the highest level of income equality?
A) Portugal
B) United States
C) Norway
D) Russia
16) According to the 2007/2008 United Nations Human Development Report, the Gini ratio for
Portugal is 38.5, Norway is 25.8, the United States is 40.8, and Russia is 39.9. Which of these
four countries has the lowest level of income equality?
A) Portugal
B) United States
C) Norway
D) Russia
6 Essay Questions
1) In the United States, do the poorest 20 percent of the households receive more or less than 5
percent of total income?
2) What is a Lorenz curve and what does it show?
3) “If the distribution of income was equal, the Lorenz curve would be a straight, 45° line.” Is the
previous statement or in?
4) What do the Lorenz curves for wealth and income in the United States look like? Which is
closer to the line of equality?
5) What is the difference between wealth and income?
6) Which is distributed more equally: income or wealth?
7) What is the main reason that the distribution of measured wealth is more unequal than the
distribution of income?
8) How do income and wealth change over a person’s lifetime? How does this affect the
distribution of income at a point in time?
9) What effect does the age of a household have when estimating the degree of inequality in
income among households?
10) What is the Gini ratio?
11) “Over the past two decades, the distribution of income in the United States has become more
equal.” Is the previous statement or in? Briefly explain your answer.
12) How has income inequality changed in recent years? What factors account for the changes?
13) Of age, marital status, family size, education, and race, which is the single biggest factor
affecting the household income distribution?
14) Is the poverty rate the lowest among Hispanic households, black households, or white
households?
15) What is “human capital”? How is it important in the determination of a worker’s wage rate?
16) How does the demand for high-skilled workers compare to the demand for low-skilled
workers? Why does this difference exist?
17) At any wage rate, the quantity of welders willing to work is less than the quantity of tomato
pickers. Why?
18) Describe the effect education and training have on outcomes in the labor market.
19) What factors explain why high-skilled workers are paid more than low-skilled workers?
20) Some economists argue that discrimination based on race and sex cannot lead to persistent
wage differentials. What is their argument?
21) What factors make inheritances a source of increased economic inequality?
22) What is meant by the term “assortative mating” and how does it affect the distribution of
wealth?
23) What are the three ways that the government redistributes income in the United States?
Briefly discuss each.
24) What is the difference between market income and money income? Which is more equally
distributed?
25) With respect to income redistribution programs, what is meant by “The Big Tradeoff,” and
what causes it?
26) Explain how redistributing income creates a deadweight loss.
27) A government redistribution of income program is proposed with the aim of making the
income distribution the same as the 45° line in a Lorenz curve diagram. What implications does
the idea of the “big tradeoff” have for the program?
7 Numeric and Graphing Questions
Household
percentage
Percent of
income
Alpha
Percent of
income
Beta
Lowest 20 percent
5
3
Second 20 percent
10
6
Third 20 percent
20
12
Fourth 20 percent
30
24
Highest 20 percent
35
55
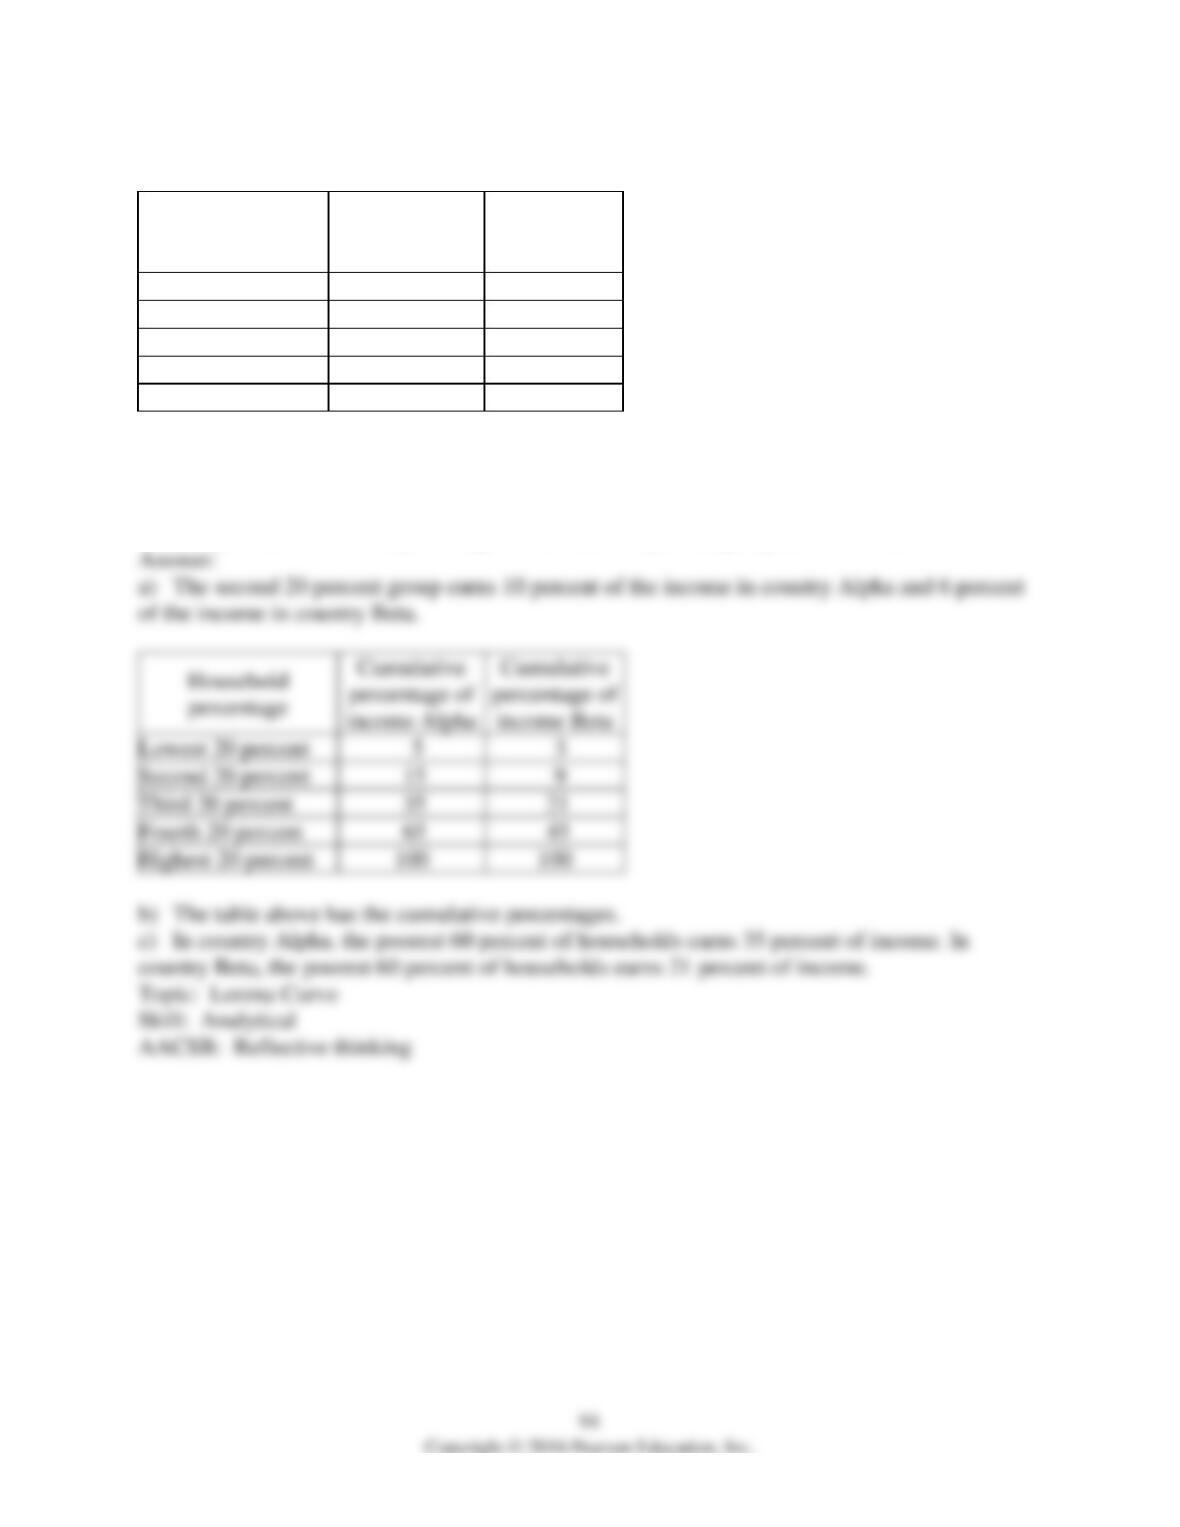
1) The above table shows the distribution of income in two imaginary countries, Alpha and Beta.
a) What does the table tell you about the second 20 percent group in each country?
b) Calculate the cumulative percentage for both countries.
c) Interpret the cumulative percentage for the third 20 percent group in both countries.
Lowest 20 percent
3
Second 20 percent
9
Third 20 percent
Fourth 20 percent
Highest 20 percent

95
Household
percentage
Percent of
income
Alpha
Percent of
income
Beta
Lowest 20 percent
5
3
Second 20 percent
10
6
Third 20 percent
20
12
Fourth 20 percent
30
24
Highest 20 percent
35
55
2) The above table shows the distribution of income in two imaginary countries, Alpha and Beta.
a) In the figure above, draw the Lorenz curves for Alpha and Beta.
b) Compare the distribution of income in Alpha with that in Beta. Which distribution is more
unequal?
c) What would be the distribution of income in a country with perfect income equality?