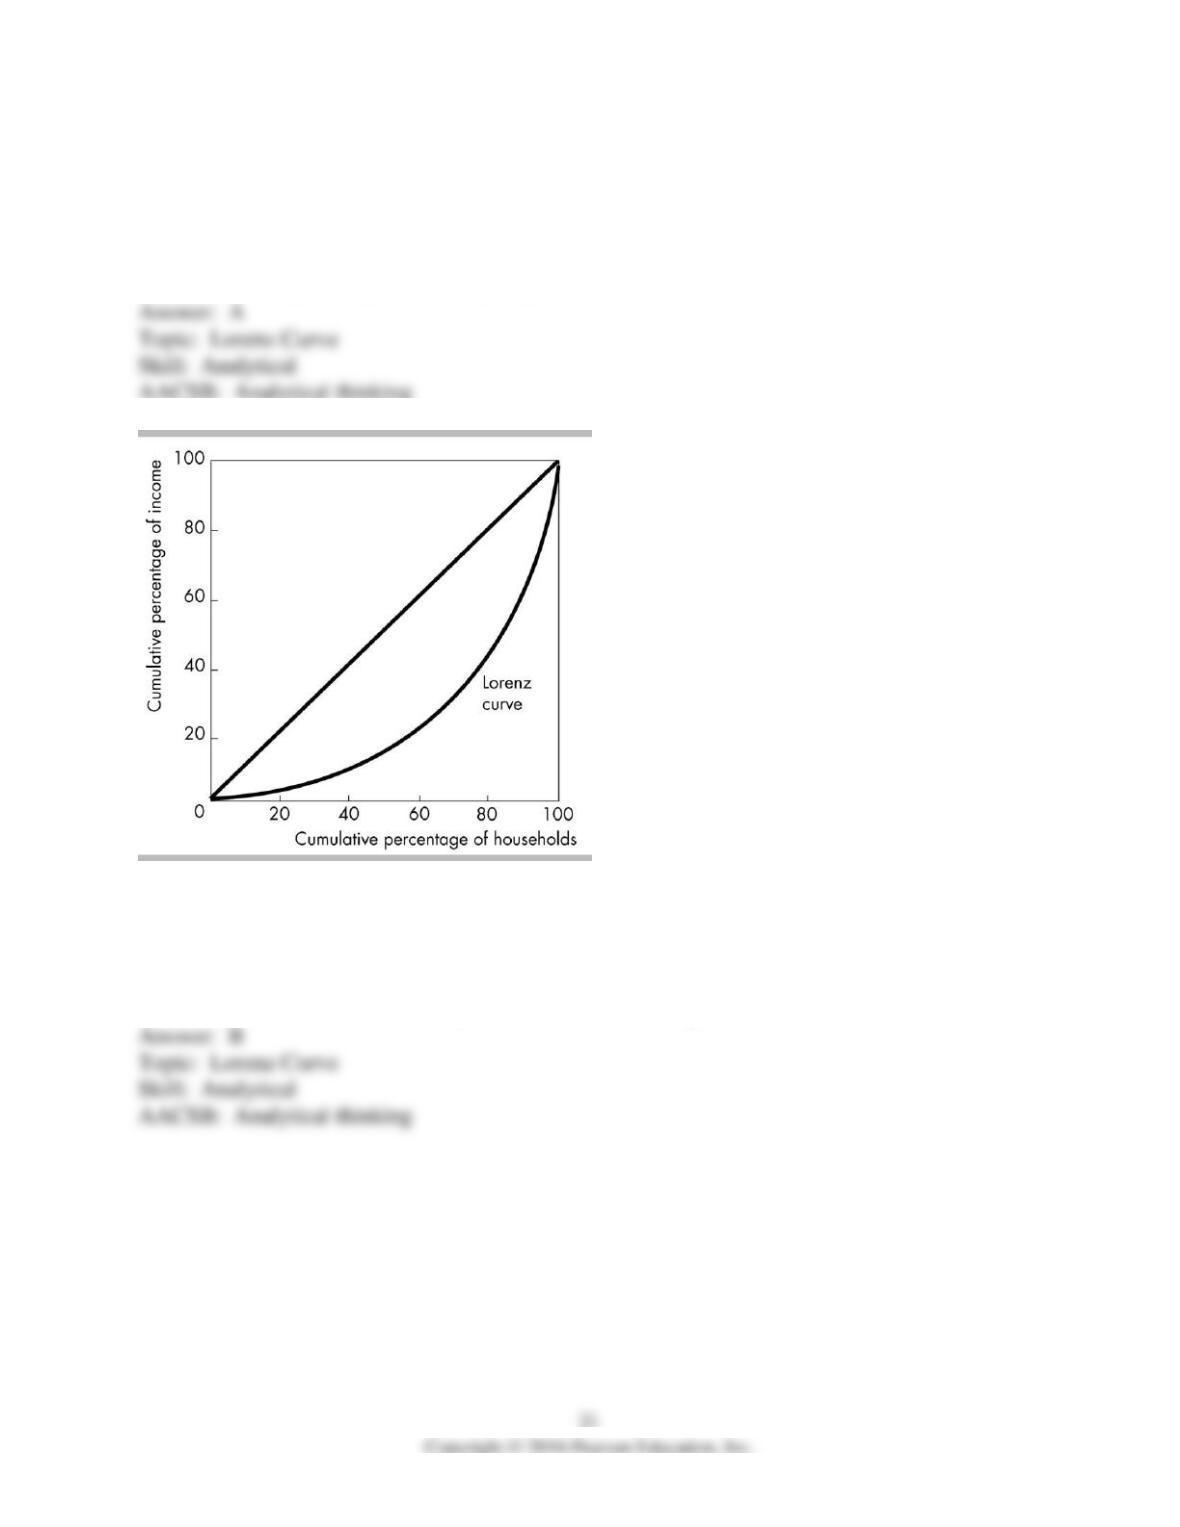
68) In the above figure, the Lorenz curve for income is shown. If the data used are from the
United States, and the U.S. Lorenz curve for wealth was added to the diagram, it would be
A) further from the line of equality than the Lorenz curve for income.
B) closer to the line of equality than the Lorenz curve for income.
C) above the line of equality.
D) the same as the Lorenz curve for income.
69) The Lorenz curve in the above figure implies that
A) income is equally distributed.
B) the lowest fifth of households account for less than 20 percent of income.
C) the highest fifth of households account for less than 20 percent of income.
D) the lowest fifth of households account for more than 20 percent of income.
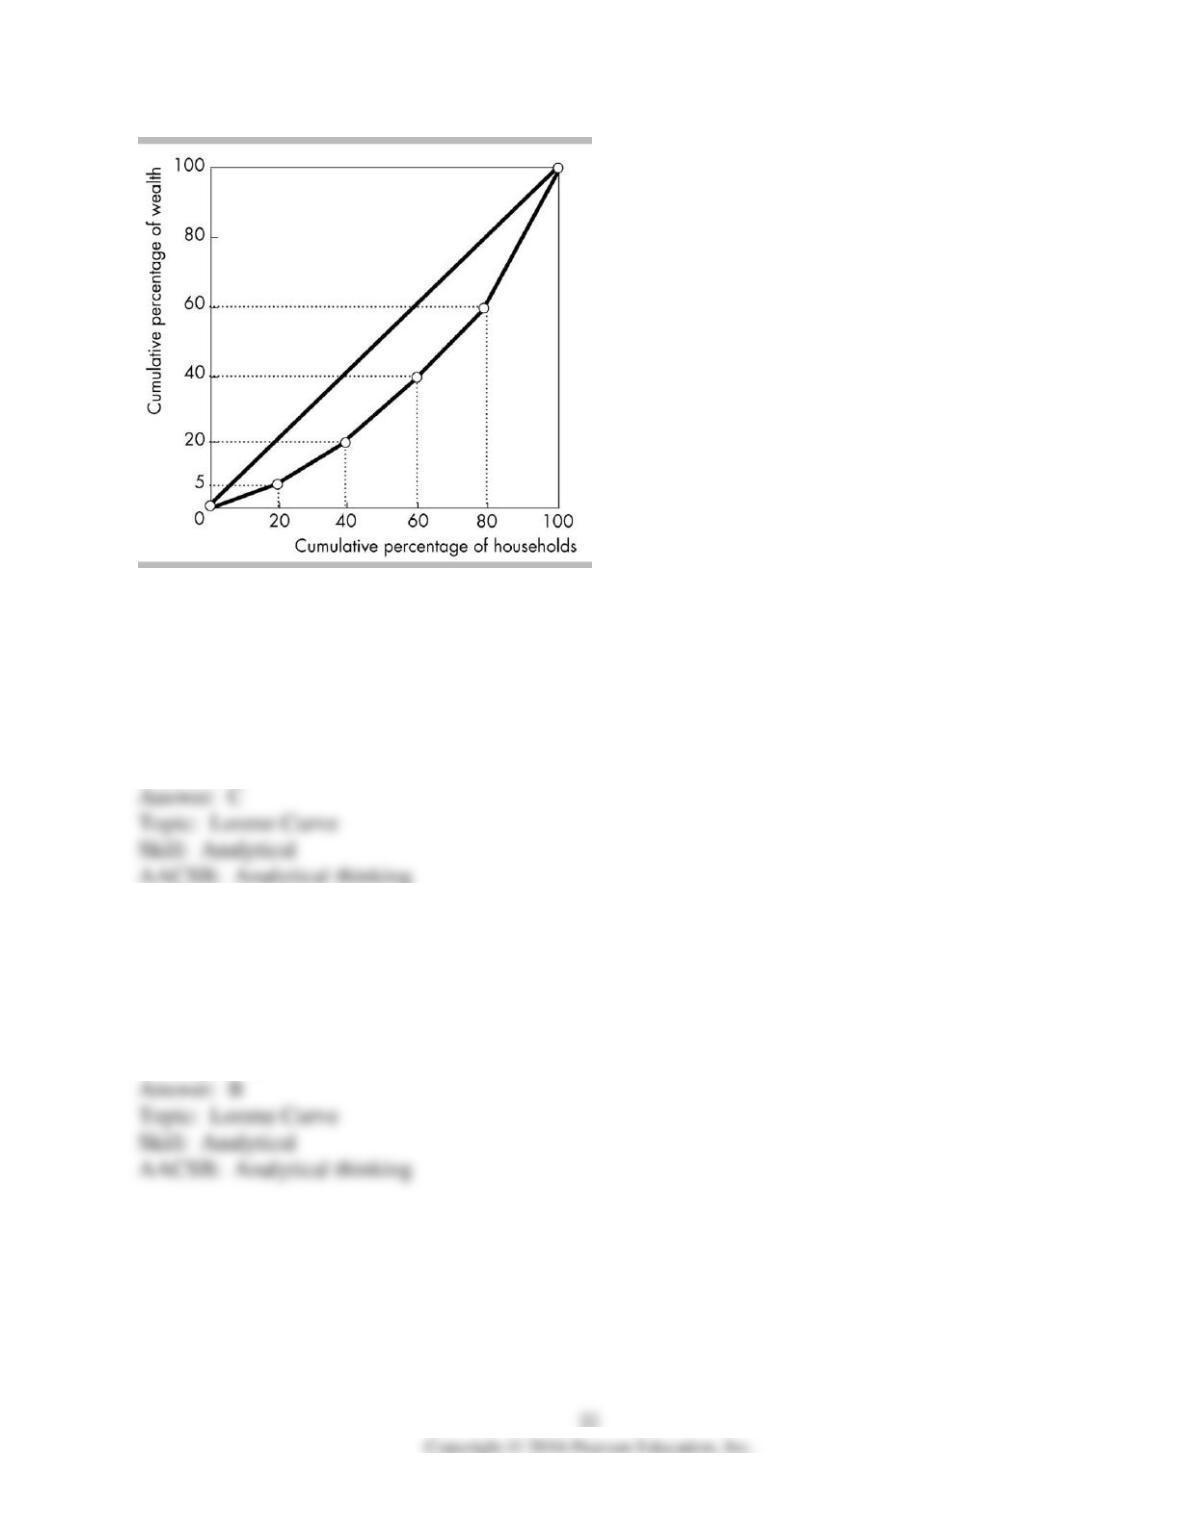
70) In the figure above, the lowest 20 percent of all households own ________ percent of all
wealth, the next lowest 20 percent own ________ percent of all wealth and the richest 20 percent
own ________ percent of all wealth.
A) 20; 20; 20
B) 20; 40; 100
C) 5; 15; 40
D) 5; 20; 60
71) The above figure shows the Lorenz curve for wealth for the nation of Rusha. What percent of
wealth is owned by the poorest quintile?
A) 0 percent
B) 5 percent
C) 20 percent
D) 35 percent

72) The above figure shows the Lorenz curve for wealth for the nation of Rusha. What percent of
wealth is owned by the wealthiest quintile?
A) 0 percent
B) 5 percent
C) 40 percent
D) 60 percent
73) The above figure shows the Lorenz curve for wealth for the nation of Rusha. The wealthiest
forty percent of the population own what percent of wealth?
A) 40 percent
B) 50 percent
C) 60 percent
D) 100 percent
74) The above figure shows the Lorenz curve for wealth for the nation of Rusha. The poorest
forty percent of the population own what percent of wealth?
A) 0 percent
B) 10 percent
C) 20 percent
D) 40 percent
75) The above figure shows the Lorenz curve for wealth for the nation of Rusha. If the
government were to confiscate all of the wealth from the poorest twenty percent of the
population and give it to the wealthiest twenty percent, the Lorenz curve would
A) not change.
B) shift farther away from the line of equality.
C) shift closer to the line of equality.
D) flip above the line of equality.
76) The above figure shows the Lorenz curve for wealth for the nation of Rusha. If the
government were to confiscate half of the wealth from the wealthiest twenty percent of the
population and give it to the poorest twenty percent, then
A) wealth distribution would be more equal.
B) wealth distribution would be unchanged.
C) wealth distribution would be more unequal.
D) the Lorenz curve would shift rightward.
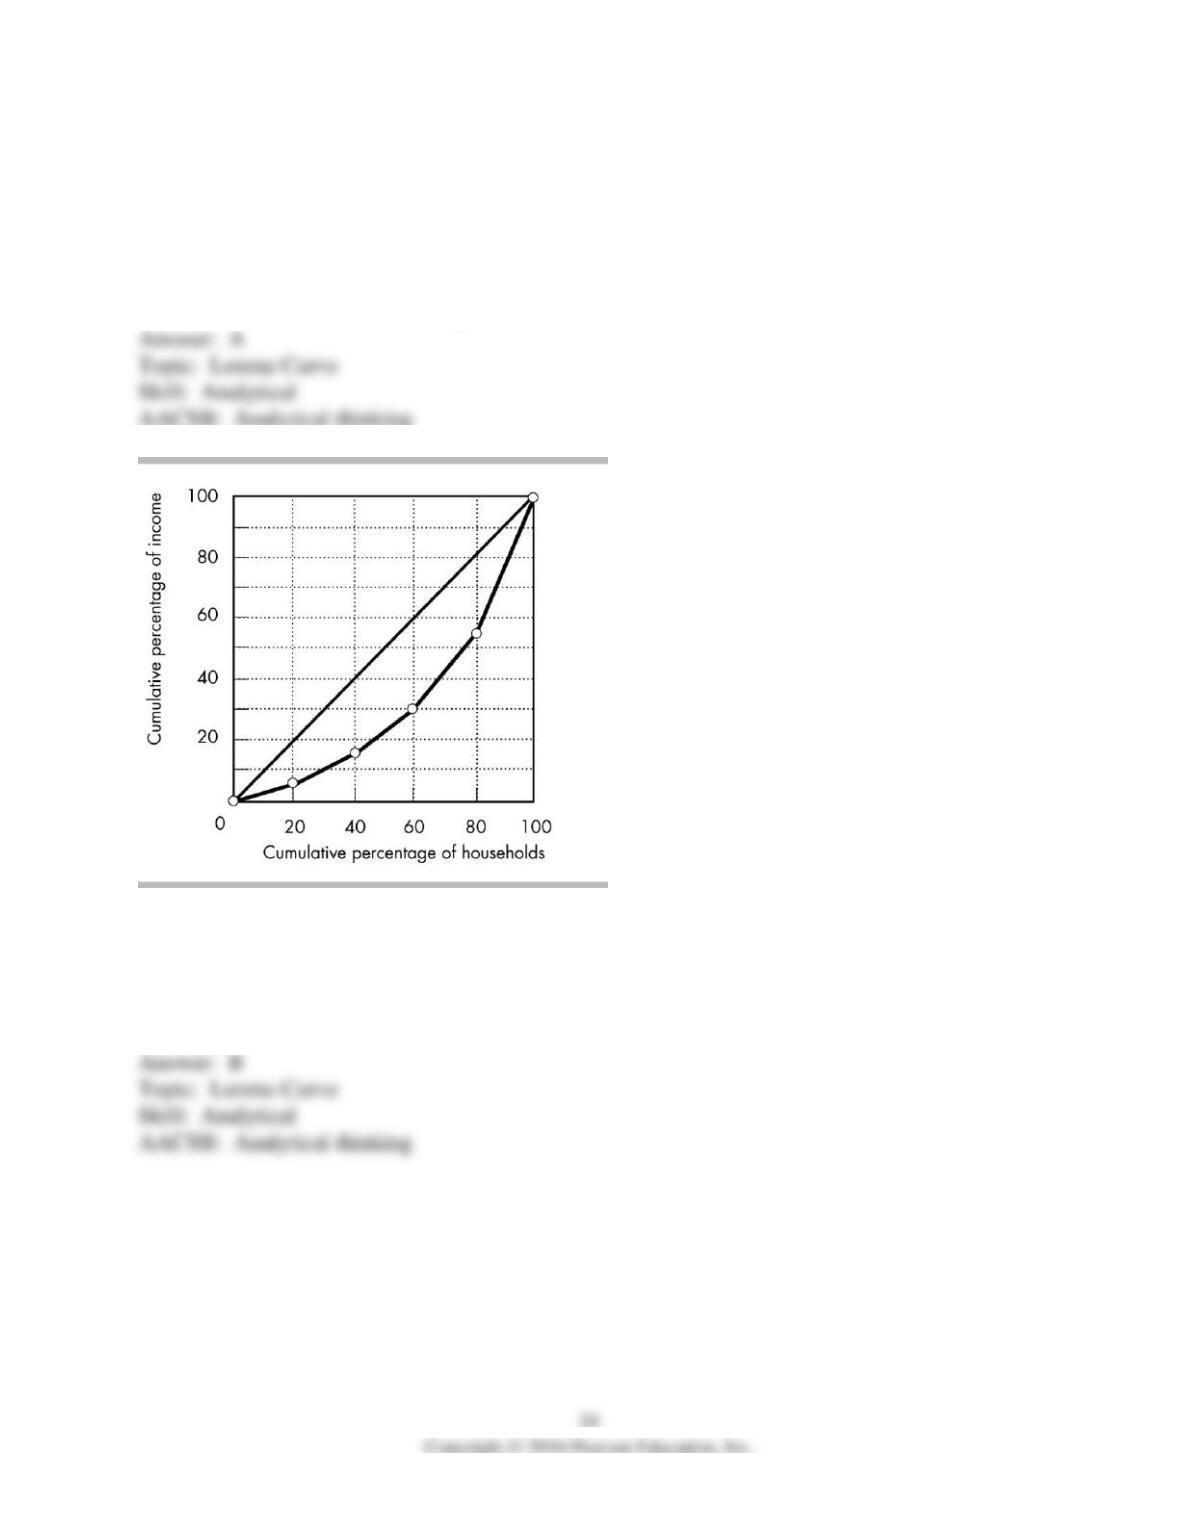
77) In the figure above, the richest 20 percent of households receive ________ of total income.
A) 55 percent
B) 45 percent
C) 80 percent
D) 60 percent
78) In the figure above, the poorest 20 percent of households receive ________ of total income.
A) 20 percent
B) 10 percent
C) 5 percent
D) 15 percent
79) In the figure above, the poorest 40 percent of households receive ________ of total income.
A) 20 percent
B) 10 percent
C) 30 percent
D) 15 percent
80) In the figure above, the richest 40 percent of households receive ________ of total income.
A) 70 percent
B) 30 percent
C) 60 percent
D) 80 percent
81) In the figure above, the second poorest 20 percent of households receive ________ of total
income.
A) 5 percent
B) 10 percent
C) 15 percent
D) 20 percent
82) In the figure above, the second richest 20 percent of households receive ________ of total
income.
A) 55 percent
B) 35 percent
C) 25 percent
D) 45 percent
83) In the figure above, if income were distributed equally across all households, the richest 20
percent of households would receive ________ of total income.
A) 45 percent
B) 25 percent
C) 20 percent
D) 15 percent
84) In the figure above, if income were distributed equally across all households, the poorest 10
percent of households would receive ________ of total income.
A) 5 percent
B) 10 percent
C) 15 percent
D) 20 percent
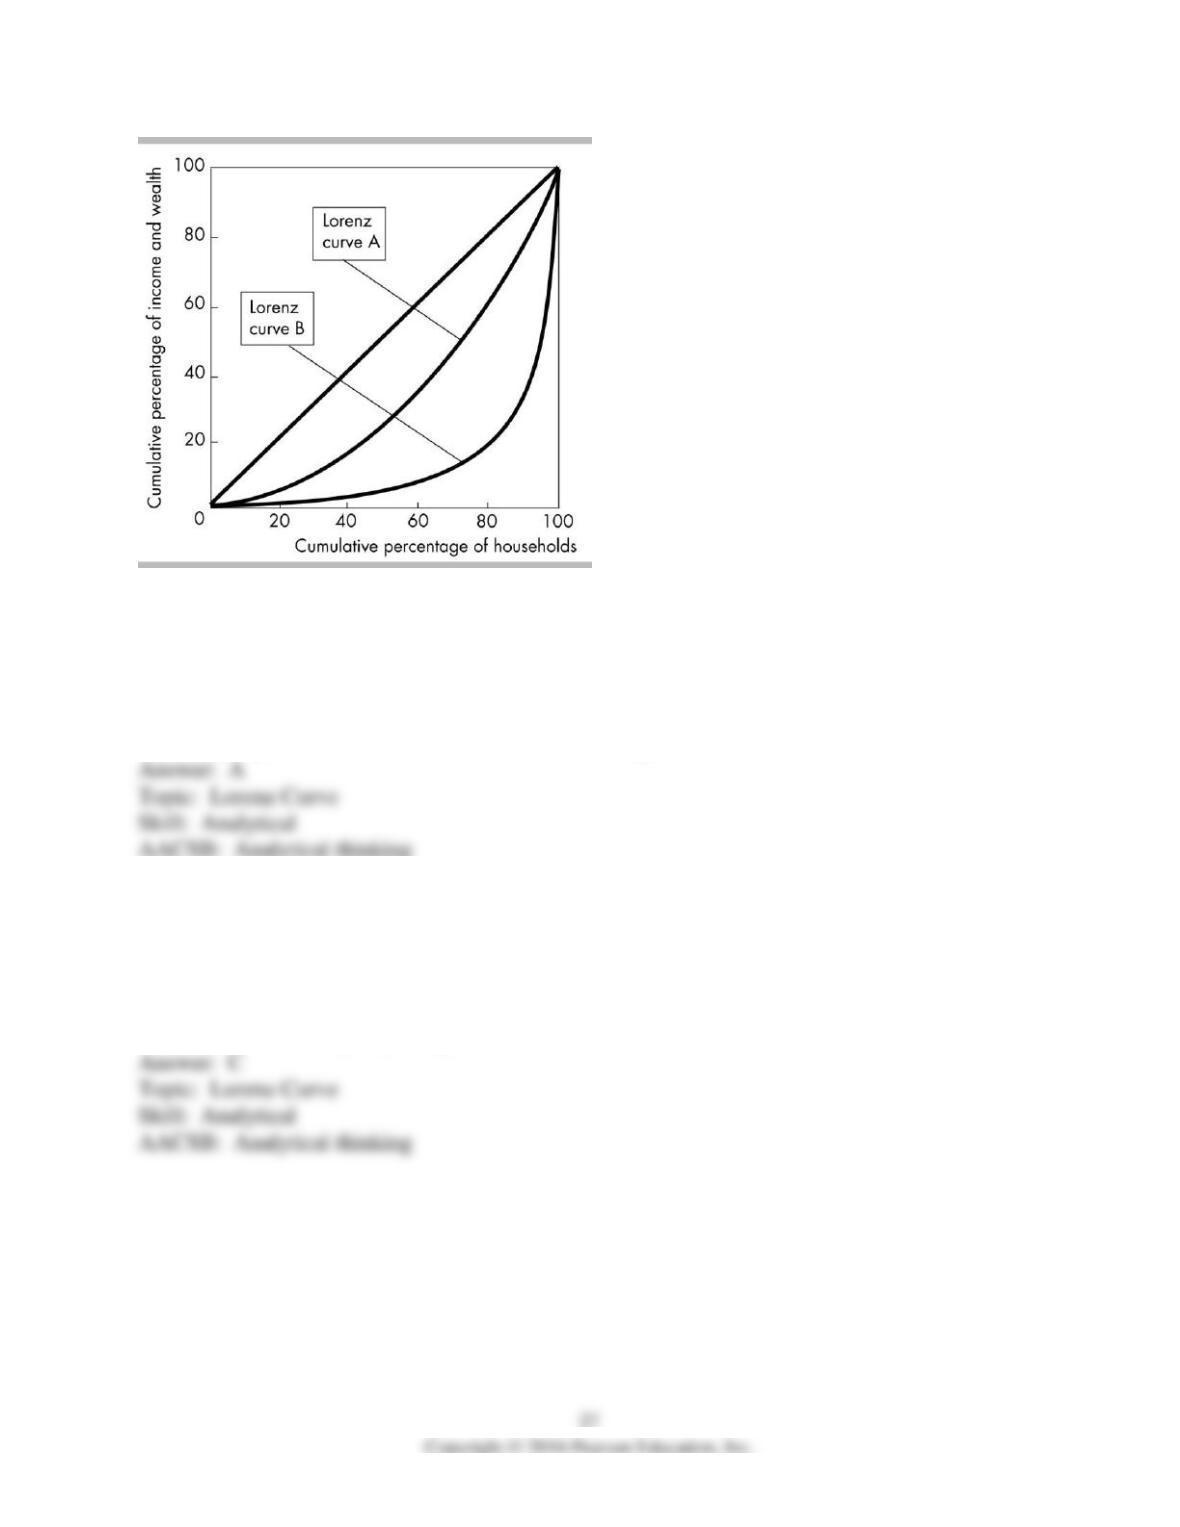
85) The figure shows two Lorenz curves. Suppose both Lorenz curves measure income. Lorenz
curve A shows ________ Lorenz curve B.
A) income is more equally distributed than the income shown in
B) income is less equally distributed than the income shown in
C) the first quintile earns less income than the first quintile earned in
D) the fifth quintile earns more income than the fifth quintile earned in
86) The above figure shows two Lorenz curves. Suppose both Lorenz curves measure wealth.
Then, the curves show that wealth is
A) greater along Lorenz curve A.
B) greater along Lorenz curve B.
C) distributed more equally along Lorenz curve A.
D) distributed more equally along Lorenz curve B.

87) The above figure shows two Lorenz curves. Lorenz curve A shows the distribution of income
and Lorenz curve B shows the distribution of wealth. Which statement below is CORRECT?
A) The Lorenz curve for wealth shows that wealth is distributed less equally because wealth does
not include human capital.
B) The Lorenz curve for income shows that income is distributed less equally because income
does not include income from stocks and bonds.
C) The Lorenz curves show wealth is greater than income.
D) The Lorenz curves show income is greater than wealth.
88) The Lorenz curves in the above figure imply that
A) income is distributed more unequally than wealth.
B) wealth is distributed more unequally than income.
C) both wealth and income are distributed equally.
D) both wealth and income are distributed at the same level of inequality.
89) Which of the following statements is TRUE?
A) Both wealth and income measure variables over a period of time.
B) Wealth measures a variable at a point in time and income measures a variable over a period of
time.
C) Wealth measures a variable over a period of time, and income measures a variable at a point
in time.
D) Both wealth and income measure variables at a point in time.
90) Wealth differs from income in that
A) income measures value at a point in time and wealth measures value over a period of time.
B) income measures value over a period of time and wealth measures value at a point in time.
C) income is what you own and wealth is what you earn.
D) wealth can be measured in dollars and income cannot.
91) Mr. Scrooge owns assets worth $100 million. The rate of return on his assets is 5 percent per
year. Mr. Scrooge’s wealth is ________, and his income is ________.
A) $5 million a year; $100 million
B) $100 million; $5 million a year
C) $100 million; $105 million
D) $5 million a year; $100 million a year
92) In the United States, the wealthiest 20 percent of households own about ________ of total
wealth.
A) 44 percent
B) 53 percent
C) 62 percent
D) 83 percent
93) In the United States, the wealthiest 10 percent of households own about ________ of total
wealth.
A) 40 percent
B) 66 percent
C) 90 percent
D) 55 percent
94) In the United States, the poorest 50 percent of households own about ________ of total
wealth.
A) 1 percent
B) 10 percent
C) 20 percent
D) 30 percent
95) For the United States, Lorenz curves show that
A) income is more equally distributed than wealth.
B) income is less equally distributed than wealth.
C) incomes have increased over time.
D) blacks and Hispanics became better off in the 1990s.
96) Income is distributed ________ equally than wealth and the Lorenz curve for ________ lies
closer to the line of equality.
A) more; income
B) more; wealth
C) less; income
D) less; wealth
97) In the United States, the Lorenz curve for wealth is ________ from the 45-degree line than is
the Lorenz curve for income, which means that the distribution of wealth is more ________ than
the distribution of income.
A) farther away from; unequal
B) farther away from; equal
C) closer to; unequal
D) closer to; equal
98) The measured distribution of ________ is a more accurate indicator of the degree of
economic inequality than the measured distribution of ________ because ________ data does
not include ________.
A) income; wealth; wealth; human capital
B) wealth; income; income; holdings of real estate
C) wealth; income; income; human capital
D) income; wealth; wealth; employment information
99) Measured wealth is a less accurate indicator of economic inequality than is measured income
because measured wealth excludes
A) owner-occupied housing.
B) financial assets.
C) depreciation.
D) human capital.
100) Which of the following is TRUE regarding the distribution of wealth and the distribution of
income?
A) The distribution of wealth is a less accurate measure of inequality because it excludes human
capital.
B) The distribution of wealth is a more accurate measure of inequality because it includes
houses.
C) The distribution of income is a less accurate measure of inequality because it excludes the
value of things you own.
D) The distribution of income is a less accurate measure of inequality because not everyone has a
job.
101) If human capital was included in the measurement of wealth, the measurement of wealth
would be
A) more equal and more accurate.
B) more equal and less accurate.
C) less equal and more accurate.
D) less equal and less accurate.
102) Measured distributions of wealth that do not consider the role of human capital
A) are more equal than the distribution of income.
B) overstate the inequality in wealth distribution.
C) are more equal than the distribution of consumption.
D) understate the inequality in wealth distribution.
103) Sue has human capital worth $500,000 and nonhuman capital of $100,000. Todd has human
capital worth $10,000 and nonhuman capital of $50,000. The return on each type of capital is 10
percent a year. Sue’s income is ________ and Todd’s income is ________.
A) $10,000; $5,000
B) $50,000; $1,000
C) $600,000; $60,000
D) $60,000; $6,000
104) Sue has human capital worth $500,000 and nonhuman capital of $100,000. Todd has human
capital worth $10,000 and nonhuman capital of $50,000. The return on each type of capital is 10
percent a year. According to the Census Bureau in the national wealth and income survey, Sue is
________.
A) as wealthy as Todd
B) 10 times wealthier than Todd
C) twice as wealthy as Todd
D) 50 times wealthier than Todd
105) Lifetime income is distributed
A) less equally than annual income and less equally than measured wealth.
B) less equally than annual income and more equally than measured wealth.
C) more equally than annual income and less equally than measured wealth.
D) more equally than annual income and more equally than measured wealth.
106) Of the following, which is the most accurate indicator of the degree of inequality?
A) distribution of annual income
B) distribution of lifetime income
C) distribution of wealth
D) distribution of the sum of wealth and annual income
107) The lifetime income distribution of income is a ________ accurate indicator of the degree
of economic inequality than the distribution of ________.
A) less; of annual income
B) more; of annual income
C) less; of wealth
D) less; annual Lorenz curves
108) In the country of Konswano there are 4 people. Each person lives for 40 years. In their first
10 years, they earn no income. In the next 20 years, they earn $40,000 per year and in the last 10
years they earn no income. Each year their consumption is $20,000. If everyone in Konswano is
25 years old, then the Lorenz curve for income is ________.
A) above the Lorenz curve for wealth
B) above the line of equality
C) equal to the line of equality
D) below the Lorenz curve for wealth
109) In the country of Konswano there are 4 people. Each person lives for 40 years. In their first
10 years, they earn no income. In the next 20 years, they earn $40,000 per year and in the last 10
years they earn no income. Each year their consumption is $20,000. If the people in Konswano
are aged 5, 15, 25, and 35, then the distribution of annual income ________.
A) is equal to the line of equality
B) is above the line of equality
C) has greater inequality than when everyone is 25 years old
D) has greater equality than when everyone is 25 years old
110) Since 1970, the distribution of income in the United States
A) generally has become more equal.
B) generally has become less equal.
C) has become more equal than the distribution of wealth.
D) has shown no discernible trend.
111) In recent years, average household income in the United States was highest for households
headed by someone aged
A) 35 to 44.
B) 45 to 54.
C) 55 to 64.
D) 65 and over.
112) Which of the following CORRECTLY describes characteristics of people who earn high
incomes?
I. Older, retired households have the highest incomes.
II. Married couples earned higher incomes than single people.
III. Households with Bachelor’s degrees have higher incomes than households with doctorate
degrees.
A) I and II
B) I and III
C) II and III
D) II only
113) Which of the following groups is the LEAST likely to be poor?
A) college graduates
B) minorities
C) single females
D) people without high school degrees
114) Which household characteristic has the largest effect on household income distribution?
A) the size of the household
B) the age of householders
C) the race of household members
D) the level of educational attainment of household members
115) ________ is the single biggest factor affecting income distribution in the United States.
A) Location of household
B) Type of household
C) Education
D) Age of household
116) The biggest single factor affecting family income distribution is the
A) householder’s age.
B) householder’s marital status.
C) household size.
D) householder’s education.
117) Education
A) does not really add to one’s human capital.
B) does not really affect one’s income.
C) is a major factor affecting one’s income.
D) explains all the differences in male-female incomes.
118) The Gini ratio is a measure of
A) income inequality.
B) wealth distribution.
C) income distribution.
D) income as compared to wealth.
119) Since 1970, the U.S. Gini ratio has
A) increased.
B) decreased.
C) increased and then decreased.
D) decreased and then increased.
120) If the area between the line of equality and the Lorenz curve is 1,250, and the entire area
beneath the line of equality is 5,000, the Gini ratio is
A) 0.25.
B) 4.00.
C) 0.33.
D) 0.80.
121) If the area between the line of equality and the Lorenz curve is 1,000, the Gini ratio is
A) 0.8.
B) 0.2.
C) 0.1.
D) 0.5.
122) The U.S. Gini ratio for income has ________ within recent decades, which means
economic inequality has ________.
A) decreased; increased
B) decreased; decreased
C) increased; decreased
D) increased; increased
123) Over the period from 1971 to 2012, the U.S. Gini ratio for household income ________,
which means income inequality in the United States ________.
A) increased; increased
B) increased; decreased
C) decreased; increased
D) decreased; decreased
124) Over the past decade, the incomes of the top 1 percent have increased while the incomes of
the middle class declined. These changes mean that the Lorenz curve moved ________ the 45
degree line and the Gini ratio has ________.
A) closer to; decreased
B) closer to; increased
C) further away from; decreased
D) further away from; increased
125) In the U.S. in 2012 the poverty level for a family of four was about
A) $23,000.
B) $34,000.
C) $10,000.
D) $15,000.
126) In the U.S. in 2012 the percentage of the Americans living below the poverty line was about
A) 15 percent.
B) 20 percent.
C) 5 percent.
D) 27 percent.
127) The mean (average) U.S. family income in 2012 was approximately
A) $15,000.
B) $71,000.
C) $51,000.
D) $100,000.
128) In a Lorenz diagram for income, the line of equality shows
A) the most equitable income distribution.
B) how unequally incomes are distributed.
C) how much redistribution occurs.
D) the income distribution if everyone received the same income.
129) The closer an income Lorenz curve is to the line of equality, the
A) slower income is growing.
B) more equally income is distributed.
C) less equally income is distributed.
D) faster income is growing.
130) Which of the following would show the LEAST amount of inequality?
A) Measured annual income.
B) Measured annual wealth.
C) Lifetime income.
D) Measured annual income and annual wealth are equally distributed and are more equally
distributed than lifetime wealth.
131) Of the approximate total population of 300 million people in America, about how many
have incomes below the official poverty level?
A) approximately 13 million
B) approximately 46 million
C) approximately 73 million
D) approximately 104 million
132) Over the past decade, the incomes of the top 1 percent have increased disproportionately
higher
than that of the middle class. These changes mean that the Lorenz curve moved ________ the 45
degree line and the Gini ratio has ________.
A) closer to; decreased
B) closer to; increased
C) further away from; decreased
D) further away from; increased
2 Inequality in the World Economy
1) Income is distributed very unequally in ________ and very equally in ________.
A) Finland and South Africa; Brazil and Sweden
B) Brazil and South Africa; Finland and Sweden
C) Finland and Sweden; Brazil and South Africa
D) Brazil and Sweden; Finland and South Africa
2) Among the United States, Finland, and South Africa, income is distributed most equally in
________ and least equally in ________.
A) the United States; South Africa
B) Finland; South Africa
C) Finland; the United States
D) South Africa; the United States
3) The distribution of world income is ________ the distribution of U.S. income.
A) more equal than
B) less equal than
C) the same as
D) not comparable to