Chapter 19 – Agriculture: Economics and Policy
19-1
CHAPTER 19
Agriculture: Economics and Policy
A. Short-Answer, Essays, and Problems
1. Describe the diversity in the agriculture industry as it relates to farm commodities.
2. What is the difference between farm commodities and food products? How does the number of competing
firms change as farm commodities are processed into food?
3. Why study the economics of agriculture in the United States? Give five reasons.
4. Describe the short-run situation in U.S. agriculture. What are its causes?
5. Explain why the demand for food is inelastic in terms of the substitution effect and diminishing returns.
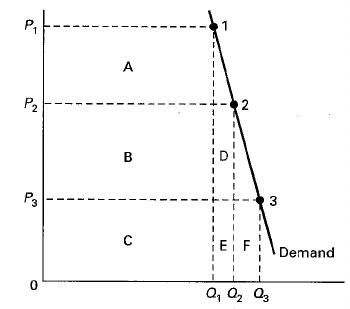
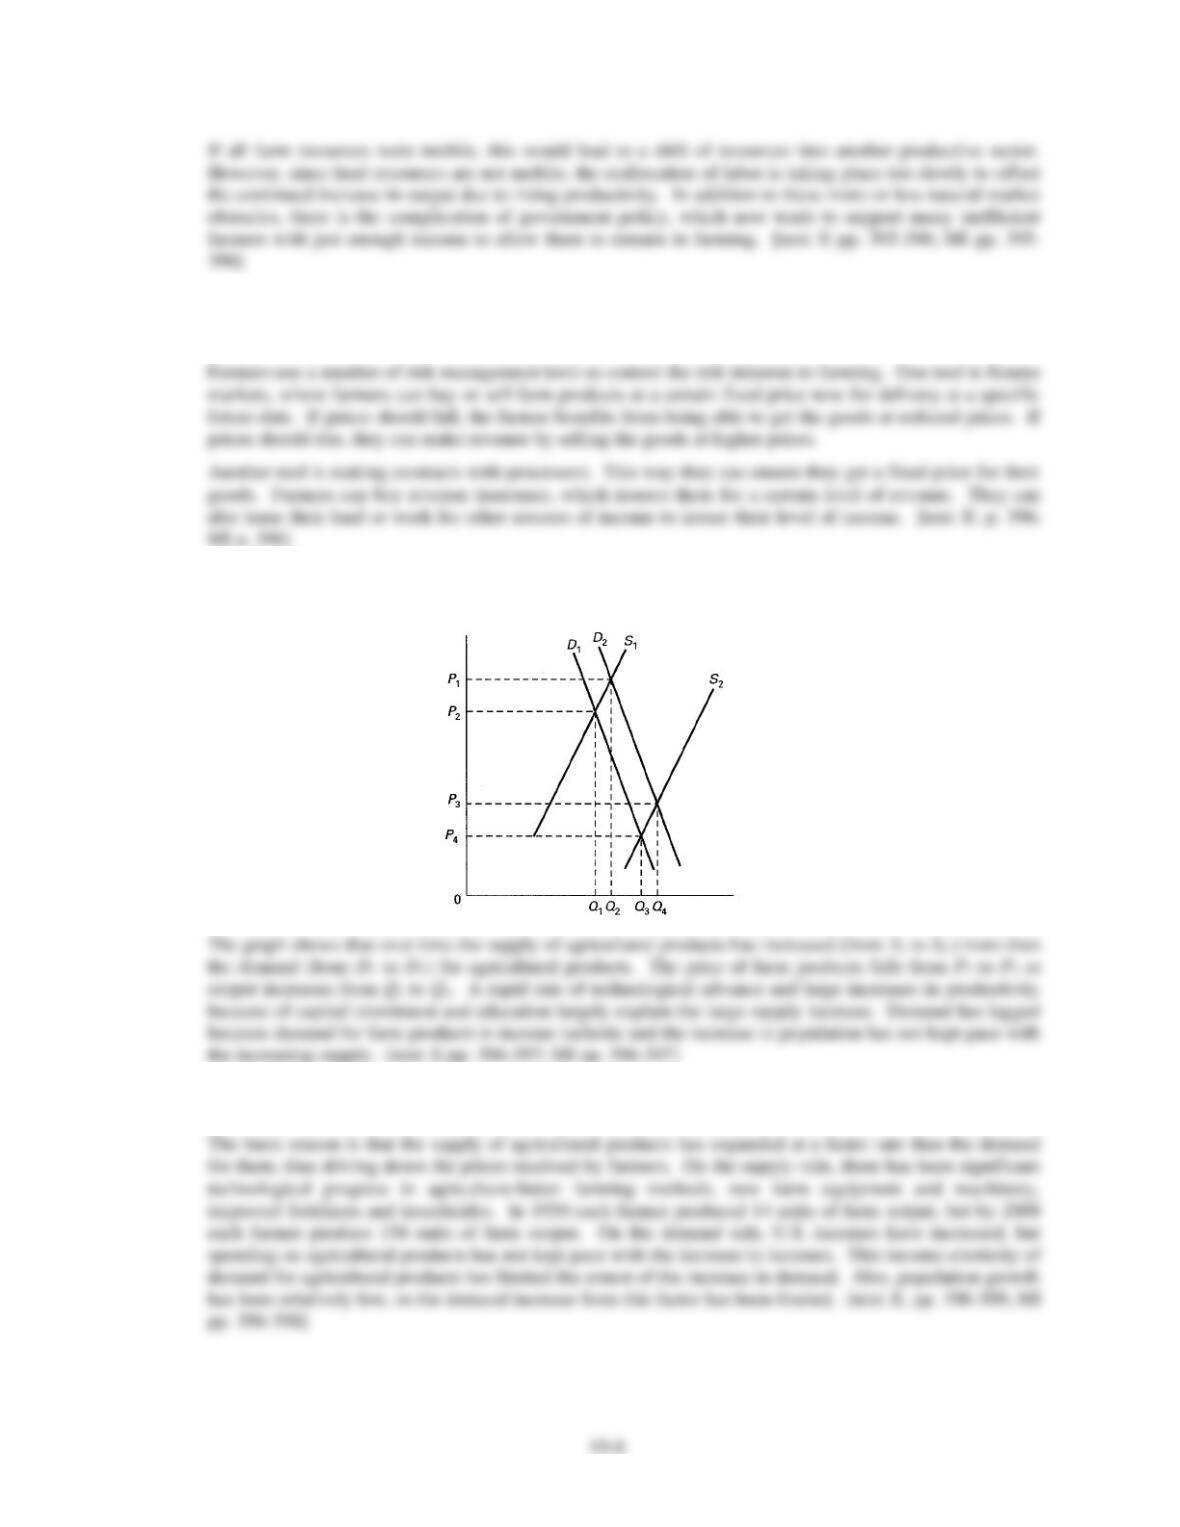
6. Use the below graph to show what happens to total revenue when: (a) price falls from P1 to P2; (b) price
rises from P3 to P2. Explain your answer in terms of areas of total revenue gained or lost using the
alphabetical letters representing different areas on the graph. (c) Is demand elastic or inelastic? How do
you know?
7. Why would a farmer continue farming in the short run, even though his ATC was greater than the price he
received for his crops?
8. How do U.S. exports of agricultural products affect the demand for agricultural products?
9. In the long run, what would happen if the demand for agricultural products suddenly became elastic?
Explain.
10. (Consider This) What are some risk management techniques used by farmers to reduce the uncertainty in
farming?
Chapter 19 – Agriculture: Economics and Policy
19-2
11. Use the below axes to draw a supply and demand diagram that illustrates the long–run situation in
agriculture. Explain the problem.
12. Why has agriculture become a declining industry over the past half century? Explain.
13. In what ways did government subsidize agriculture over the past sixty years? What were the most
important aspects of this assistance?
14. What has been the rationale made over the years to justify government subsidies for agriculture?
15. Why are the prices received by farmers less stable than the prices paid by farmers?
16. The following table gives the index of prices farmers paid in three different years. The price farmers
received in year 1, the base year, for a certain agricultural product was $4.00 per bushel. Compute the
parity price of the product in years 2 and 3 and enter them in the table. Compute the parity ratio and enter
it into the table.
Year Index of prices paid Parity price Price received Parity ratio
1 100 $4.00 $4.00 100%
2 125 _____ 4.25 _____%
3 175 _____ 5.00 _____%
17. What are the major economic effects on output, prices, and farmers’ income from government price
supports that set minimum prices for farm products?
18. Explain the economic effects of farm price supports on society in terms of the allocation of resources to
agriculture and three other social costs.
19. What are the environmental costs of price support programs for farmers?
20. Describe the international costs associated with farm price supports.
Chapter 19 – Agriculture: Economics and Policy
19-3
21. In columns 1 and 2 in the following table is a demand schedule for agricultural product A.
(1)
Price (2)
Bushels of A demanded (3)
Bushels of A demanded
$4.00 1200 1160
3.60 1240 1200
3.20 1280 1240
2.80 1320 1280
2.40 1360 1320
2.00 1400 1360
1.60 1440 1400
1.20 1480 1440
(a) What is the characteristic of elasticity in the price range given?
(b) By how much would the income of producers change if the amount of A produced should increase
from 1200 to 1400 bushels?
(c) If the amount of A produced were 1400 bushels and the demand for A decreased from that shown in
columns 1 and 2 to that shown in columns 1 and 3, what would happen to the income of farmers?
(d) Assume that the government supports a price of $3.60, that the demand for A is that shown in columns
1 and 2, and that farmers grow 1440 bushels of A. What will be the total income of farmers at the
support price? How much of this income will come from consumers and how much from government?
22. In columns 1 and 2 in the following table is a demand schedule for agricultural product A.
(1)
Price (2)
Bushels of A demanded (3)
Bushels of A demanded
$5.001000 950
4.501025 1000
4.001050 1025
3.501075 1050
3.001100 1075
2.501125 1100
2.001150 1125
1.501175 1150
(a) What is the characteristic of elasticity in the price range given?
(b) By how much would the income of producers change if the amount of A produced should increase
from 1000 to 1100 bushels?
(c) If the amount of A produced were 1100 bushels and the demand for A decreased from that shown in
columns 1 and 2 to that shown in columns 1 and 3, what would happen to the income of farmers?
(d) Assume that the government supports a price of $4.50, that the demand for A is that shown in columns
1 and 2, and that farmers grow 1150 bushels of A. What will be the total income of farmers at the
support price? How much of this income will come from consumers and how much from government?
Chapter 19 – Agriculture: Economics and Policy
19-4
23. Use the following information and table to answer the next two questions. Suppose the demand for wheat
during a certain time is that shown in the table below. The Federal government wishes to support the price
of wheat at $4.25 a bushel.
Price
(per bushel) Quantity demanded
(in thousands of bushels)
$5.00 2000
4.75 2040
4.50 2080
4.25 2120
4.00 2160
3.75 2200
3.50 2240
(a) What would the competitive market price of wheat be if the output of wheat were 2200 thousand
bushels during that year? What would the government take?
(b) What would the competitive market price of wheat be if the output were 2000 bushels during that
period of time? What action would the government take?
24. Use the following information and table to answer the next two questions. Suppose the demand for wheat
during a certain time is that shown in the table below. The Federal government wishes to support the price
of barley at $3.40 a bushel.
Price
(per bushel) Quantity demanded
(in thousands of bushels)
$4.00 1000
3.80 1025
3.60 1050
3.40 1075
3.20 1100
3.00 1125
2.80 1150
(a) What would the competitive market price of barley be if the output of barley were 1100 thousand
bushels during that year? What action would the government take?
(b) What would the competitive market price of barley be if the output were 1025 bushels during that
period of time? What action would the government take?
25. The table below provides price, demand and supply information for soybeans. Use this information to
answer the following questions.
Price (per bushel) Quantity demanded
(in thousand of bushels) Quantity supplied
(in thousand of bushels)
$5.00 2000 2500
4.80 2025 2400
4.60 2050 2300
4.40 2075 2200
4.20 2100 2100
4.00 2125 2000
3.80 2150 1900
3.60 2175 1800
3.40 2200 1700
(a) Without government intervention, what is the equilibrium price and quantity for soybeans? What is
the producer surplus gained by the farmers?
(b) Suppose farmers produce a bumper crop this year, increasing quantity by 250 bushels at every price.
What is the equilibrium price and quantity? What is the new consumer surplus?
(c) Suppose the government decides to maintain the price at $4.40. What would be the impact on the
creation of a surplus or a shortage, the producer surplus, and the consumer surplus?
26. The demand schedule for agricultural product A is given in columns 1 and 2 of the following table.
Chapter 19 – Agriculture: Economics and Policy
19-5
(1)
Price (2)
Bales of A demanded (3)
Bales of A demanded
$4.50 20,000 22,000
4.25 20,400 22,400
4.00 20,800 22,800
3.75 21,200 23,200
3.50 21,600 23,600
3.25 22,000 24,000
3.00 22,400 24,400
(a) What would happen to the income of farmers if farmers were persuaded by the government to reduce
the size of their crop from 22,000 to 20,000 bales?
(b) If the crop production remained constant at 22,000 bales and the demand for A increased to that shown
in columns 1 and 3, what would the income of farmers be?
27. What supply and what demand approaches have been used to reduce surpluses of farm commodities?
28. “More research should be devoted to projects which will reduce rather than increase agricultural surpluses.”
Is this a sound approach? Explain.
29. “To reduce agricultural output by a certain percent, an even larger percent reduction in acres planted is
required.” Explain.
30. (Consider This) List two secondary effects from the increased price of corn as part of the promotion of
ethanol.
31. What have been three major criticisms of agricultural policies over the past half-century?
32. How does the politics of farm policy explain why costly and expensive farm programs have persisted in the
United States despite a decline in the farm population and in the political power of the farm vote?
33. What factors explain why there has been a decline in the political support for agricultural subsidies in
recent years?
34. Explain the economic effects of farm programs on the European Union and in the United States on world
trade.
35. Suppose that the U.S. government is trying to garner support from Central American countries to pass the
newest free trade agreement, Central American Free Trade Agreement (CAFTA). Why might Central
American countries argue that in terms of agricultural products, trade with the United States is not really
truly competitive?
36. What are the major provisions of the Freedom to Farm Act of 1996?
37. The Freedom to Farm Act of 1996 was supposed to get the government out of agriculture. So, why was
emergency aid been given to farmers in recent years?
38. Describe the purpose of the Food, Conservation and Energy Act of 2008.
39. Discuss the continuing problem with farm policy after the Food, Conservation and Energy Act of 2008.
40. (Last Word) Describe the economic effects of the U.S. price supports and import quotas for sugar.
B. Answers to Short-Answer, Essays, and Problems
1. Describe the diversity in the agriculture industry as it relates to farm commodities.
Chapter 19 – Agriculture: Economics and Policy
19-6
2. What is the difference between farm commodities and food products? How does the number of competing
firms change as farm commodities are processed into food?
3. Why study the economics of agriculture in the United States? Give five reasons.
4. Describe the short-run situation in U.S. agriculture. What are its causes?
5. Explain why the demand for food is inelastic in terms of the substitution effect and diminishing returns.
Chapter 19 – Agriculture: Economics and Policy
19-7
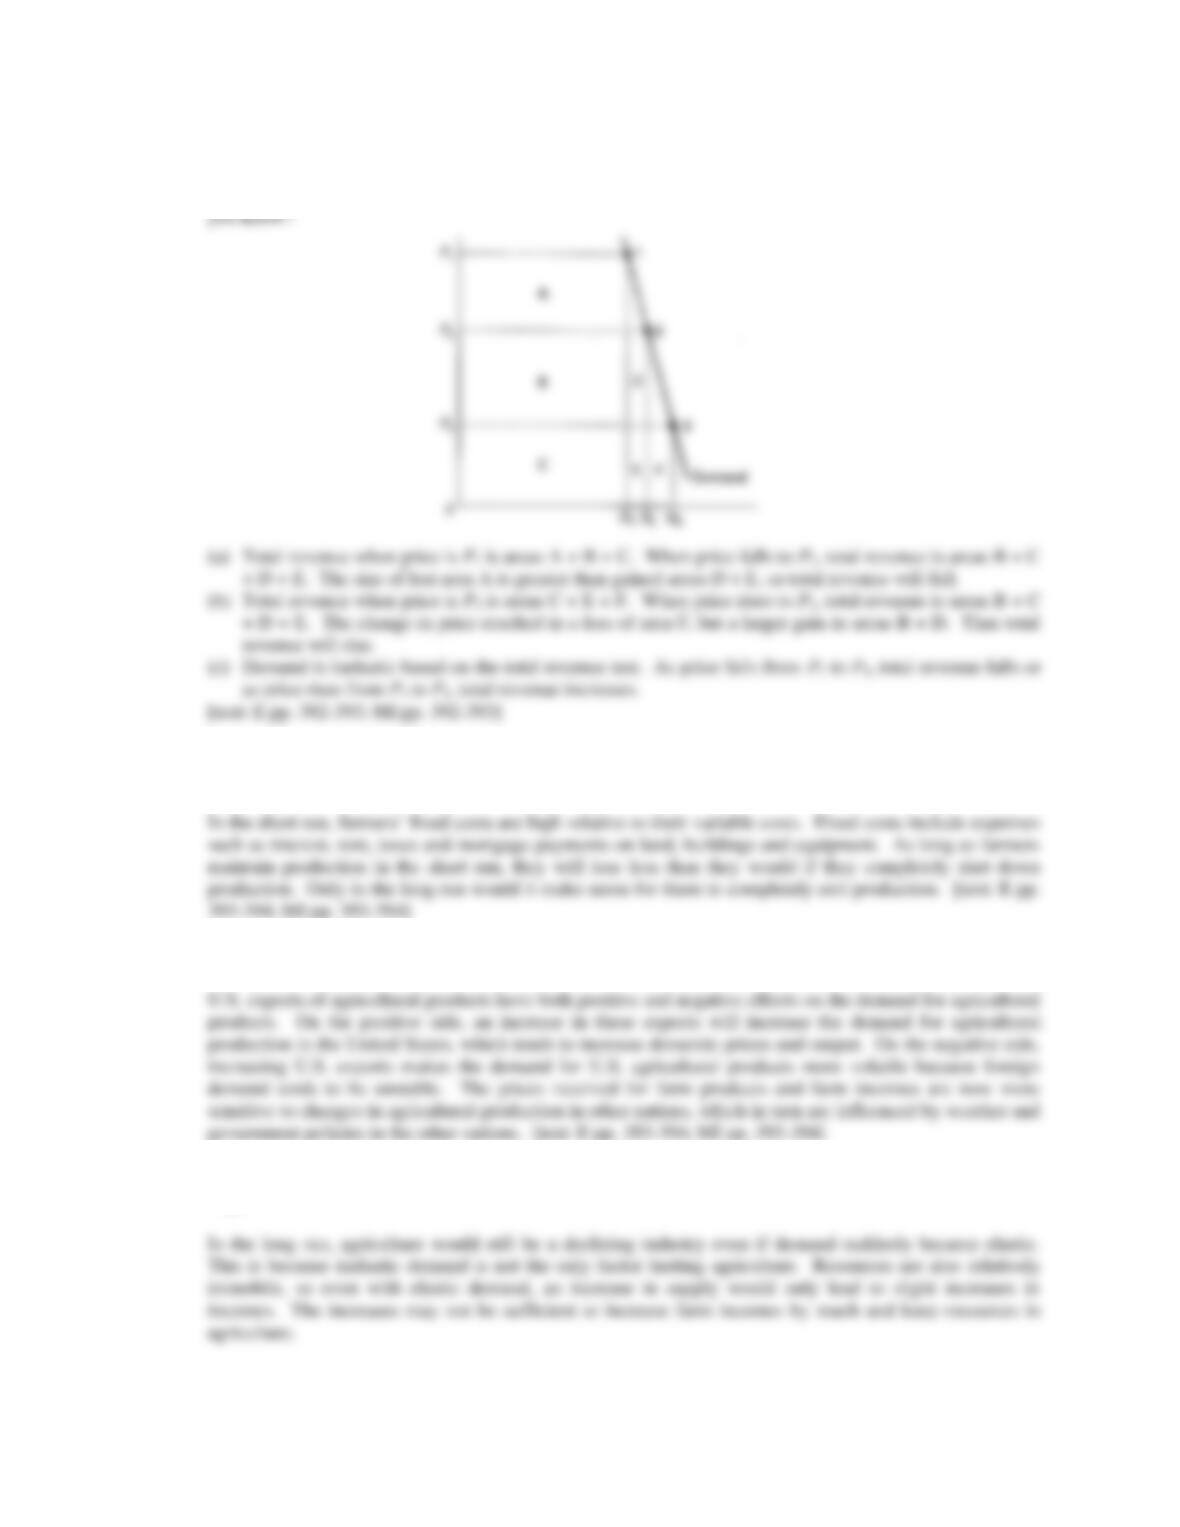
6. Use the below graph to show what happens to total revenue when: (a) price falls from P1 to P2; (b) price
rises from P3 to P2. Explain your answer in terms of areas of total revenue gained or lost using the
alphabetical letters representing different areas on the graph. (c) Is demand elastic or inelastic? How do
7. Why would a farmer continue farming in the short run, even though his ATC was greater than the price he
received for his crops?
8. How do U.S. exports of agricultural products affect the demand for agricultural products?
9. In the long run, what would happen if the demand for agricultural products suddenly became elastic?
Explain.
Chapter 19 – Agriculture: Economics and Policy
10. (Consider This) What are some risk management techniques used by farmers to reduce the uncertainty in
farming?
11. Use the below axes to draw a supply and demand diagram that illustrates the long-run situation in
agriculture. Explain the problem.
12. Why has agriculture become a declining industry over the past half century? Explain.
Chapter 19 – Agriculture: Economics and Policy
19-9
13. In what ways did government subsidize agriculture over the past sixty years? What were the most
important aspects of this assistance?
14. What has been the rationale made over the years to justify government subsidies for agriculture?
15. Why are the prices received by farmers less stable than the prices paid by farmers?
16. The following table gives the index of prices farmers paid in three different years. The price farmers
received in year 1, the base year, for a certain agricultural product was $4.00 per bushel. Compute the
parity price of the product in years 2 and 3 and enter them in the table. Compute the parity ratio and enter
it into the table.
Year Index of prices paid Parity price Price received Parity ratio
1 100 $4.00 $4.00 100%
2 125 _____ 4.25 _____%
3 175 _____ 5.00 _____%
17. What are the major economic effects on output, prices, and farmers’ income from government price
supports that set minimum prices for farm products?
Chapter 19 – Agriculture: Economics and Policy
19–10
18. Explain the economic effects of farm price supports on society in terms of the allocation of resources to
agriculture and three other social costs.
19. What are the environmental costs of price support programs for farmers?
20. Describe the international costs associated with farm price supports.
21. In columns 1 and 2 in the following table is a demand schedule for agricultural product A.
(1)
Price (2)
Bushels of A demanded (3)
Bushels of A demanded
$4.00 1200 1160
3.60 1240 1200
3.20 1280 1240
2.80 1320 1280
2.40 1360 1320
2.00 1400 1360
1.60 1440 1400
1.20 1480 1440
(a) What is the characteristic of elasticity in the price range given?
(b) By how much would the income of producers change if the amount of A produced should increase
from 1200 to 1400 bushels?
(c) If the amount of A produced were 1400 bushels and the demand for A decreased from that shown in
columns 1 and 2 to that shown in columns 1 and 3, what would happen to the income of farmers?
(d) Assume that the government supports a price of $3.60, that the demand for A is that shown in columns
1 and 2, and that farmers grow 1440 bushels of A. What will be the total income of farmers at the
support price? How much of this income will come from consumers and how much from government?
Chapter 19 – Agriculture: Economics and Policy
19–11
22. In columns 1 and 2 in the following table is a demand schedule for agricultural product A.
(1)
Price (2)
Bushels of A demanded (3)
Bushels of A demanded
$5.001000 950
4.501025 1000
4.001050 1025
3.501075 1050
3.001100 1075
2.501125 1100
2.001150 1125
1.501175 1150
(a) What is the characteristic of elasticity in the price range given?
(b) By how much would the income of producers change if the amount of A produced should increase
from 1000 to 1100 bushels?
(c) If the amount of A produced were 1100 bushels and the demand for A decreased from that shown in
columns 1 and 2 to that shown in columns 1 and 3, what would happen to the income of farmers?
(d) Assume that the government supports a price of $4.50, that the demand for A is that shown in columns
1 and 2, and that farmers grow 1150 bushels of A. What will be the total income of farmers at the
support price? How much of this income will come from consumers and how much from government?
23. Use the following information and table to answer the next two questions. Suppose the demand for wheat
during a certain time is that shown in the table below. The Federal government wishes to support the price
of wheat at $4.25 a bushel.
Price
(per bushel) Quantity demanded
(in thousands of bushels)
$5.00 2000
4.75 2040
4.50 2080
4.25 2120
4.00 2160
3.75 2200
3.50 2240
(a) What would the competitive market price of wheat be if the output of wheat were 2200 thousand
bushels during that year? What would the government take?
(b) What would the competitive market price of wheat be if the output were 2000 bushels during that
period of time? What action would the government take?
Chapter 19 – Agriculture: Economics and Policy
19–12
24. Use the following information and table to answer the next two questions. Suppose the demand for wheat
during a certain time is that shown in the table below. The Federal government wishes to support the price
of barley at $3.40 a bushel.
Price
(per bushel) Quantity demanded
(in thousands of bushels)
$4.00 1000
3.80 1025
3.60 1050
3.40 1075
3.20 1100
3.00 1125
2.80 1150
(a) What would the competitive market price of barley be if the output of barley were 1100 thousand
bushels during that year? What action would the government take?
(b) What would the competitive market price of barley be if the output were 1025 bushels during that
period of time? What action would the government take?
(a) $3.20. The government would buy 25 thousand bushels of barley.
25. The table below provides price, demand and supply information for soybeans. Use this information to
answer the following questions.
Price (per bushel) Quantity demanded
(in thousand of bushels) Quantity supplied
(in thousand of bushels)
$5.00 2000 2500
4.80 2025 2400
4.60 2050 2300
4.40 2075 2200
4.20 2100 2100
4.00 2125 2000
3.80 2150 1900
3.60 2175 1800
3.40 2200 1700
(a) Without government intervention, what is the equilibrium price and quantity for soybeans? What is
the producer surplus gained by the farmers?
(b) Suppose farmers produce a bumper crop this year, increasing quantity by 250 bushels at every price.
What is the equilibrium price and quantity? What is the new consumer surplus?
(c) Suppose the government decides to maintain the price at $4.40. What would be the impact on the
creation of a surplus or a shortage, the producer surplus, and the consumer surplus?
26. The demand schedule for agricultural product A is given in columns 1 and 2 of the following table.
Chapter 19 – Agriculture: Economics and Policy
(1)
Price (2)
Bales of A demanded (3)
Bales of A demanded
$4.50 20,000 22,000
4.25 20,400 22,400
4.00 20,800 22,800
3.75 21,200 23,200
3.50 21,600 23,600
3.25 22,000 24,000
3.00 22,400 24,400
(a) What would happen to the income of farmers if farmers were persuaded by the government to reduce
the size of their crop from 22,000 to 20,000 bales?
(b) If the crop production remained constant at 22,000 bales and the demand for A increased to that shown
in columns 1 and 3, what would the income of farmers be?
27. What supply and what demand approaches have been used to reduce surpluses of farm commodities?
28. “More research should be devoted to projects which will reduce rather than increase agricultural surpluses.”
Is this a sound approach? Explain.
29. “To reduce agricultural output by a certain percent, an even larger percent reduction in acres planted is
required.” Explain.
30. (Consider This) List two secondary effects from the increased price of corn as part of the promotion of
ethanol.
Chapter 19 – Agriculture: Economics and Policy
31. What have been three major criticisms of agricultural policies over the past half-century?
32. How does the politics of farm policy explain why costly and expensive farm programs have persisted in the
United States despite a decline in the farm population and in the political power of the farm vote?
33. What factors explain why there has been a decline in the political support for agricultural subsidies in
recent years?
Chapter 19 – Agriculture: Economics and Policy
19–15
34. Explain the economic effects of farm programs on the European Union and in the United States on world
trade.
35. Suppose that the U.S. government is trying to garner support from Central American countries to pass the
newest free trade agreement, Central American Free Trade Agreement (CAFTA). Why might Central
American countries argue that in terms of agricultural products, trade with the United States is not really
truly competitive?
36. What are the major provisions of the Freedom to Farm Act of 1996?
37. The Freedom to Farm Act of 1996 was supposed to get the government out of agriculture. So, why was
emergency aid been given to farmers?
38. Describe the purpose of the Food, Conservation and Energy Act of 2008.
Chapter 19 – Agriculture: Economics and Policy
19–16
39. Discuss the continuing problem with farm policy after the Food, Conservation and Energy Act of 2008.
40. (Last Word) Describe the economic effects of the U.S. price supports and import quotas for sugar.