Microeconomics, 12e (Parkin)
Chapter 19 Economic Inequality
1 Economic Inequality in the United States
1) Market income is
A) profit earned in factor markets.
B) interest earned in factor markets.
C) wages, interest, rent, and profit earned in factor markets.
D) wages, interest, rent, and profit earned in factor markets plus cash payments made to
households by government.
2) Market income is
A) wage, interest, rent, and profit earned in factor markets.
B) wage income.
C) wage and salary income.
D) money income.
3) Money income is
A) market income plus cash payments from government.
B) equal to market income.
C) market income plus cash payments from government minus taxes.
D) market income minus taxes.
4) The “mode” household income is
A) the income that separates households into two equal groups.
B) the most common level of household income.
C) the mean household income.
D) the average household income.
5) Mode income is
A) the most common income.
B) the average income.
C) the middle income level.
D) the same as money income.
6) The median household income is
A) the income that separates households into two equal groups.
B) the most common household income.
C) the mean household income.
D) the average household income.
7) The mean household income is
A) the income that separates households into two equal groups.
B) the most common household income.
C) the percentage of total income received by the richest 20 percent of households.
D) the average household income.
8) In the United States
A) there are more households with incomes below the mean income than above the mean
income.
B) there are more households with incomes above the mean income than below the mean
income.
C) the mode income equals the mean income.
D) the income distribution is bell shaped.
9) In the United States, the median household income is ________ than the mean income, which
means there are ________ households with low incomes than with high incomes.
A) less; more
B) greater; more
C) greater; fewer
D) less; fewer
10) The distribution of income in the United States is characterized by the following relationship
between the mean, median, and mode incomes
A) mean income < median income < mode income.
B) mode income < median income < mean income.
C) median income < mean income < mode income.
D) mode income < mean income < median income.
11) The distribution of income in the United States is skewed so that the mode level of
household income is ________ the median household income and the median household income
is ________ than the mean household income.
A) less than; less than
B) less than; greater than
C) greater than; greater than
D) greater than; less than
12) The income distribution in the United States is
A) positively skewed.
B) negatively skewed.
C) bell-shaped
D) uniform.
13) The distribution of U.S. income is not bell-shaped because
A) there are more households with incomes below the mean income than above the mean
income.
B) there are more households with incomes above the mean income than below the mean
income.
C) the mode income equals the mean income.
D) the income distribution is bell shaped.
14) In the United States, the percentage of households that have incomes below the mean income
is
A) 50 percent.
B) less than 50 percent.
C) more than 50 percent.
D) 0 percent.
15) In the United States the richest 20 percent of households receive about ________ of total
income.
A) 10 percent
B) 20 percent
C) 50 percent
D) 80 percent
16) In the United States the poorest 20 percent of households receive about ________ of total
income.
A) 1 percent
B) 4 percent
C) 10 percent
D) 15 percent
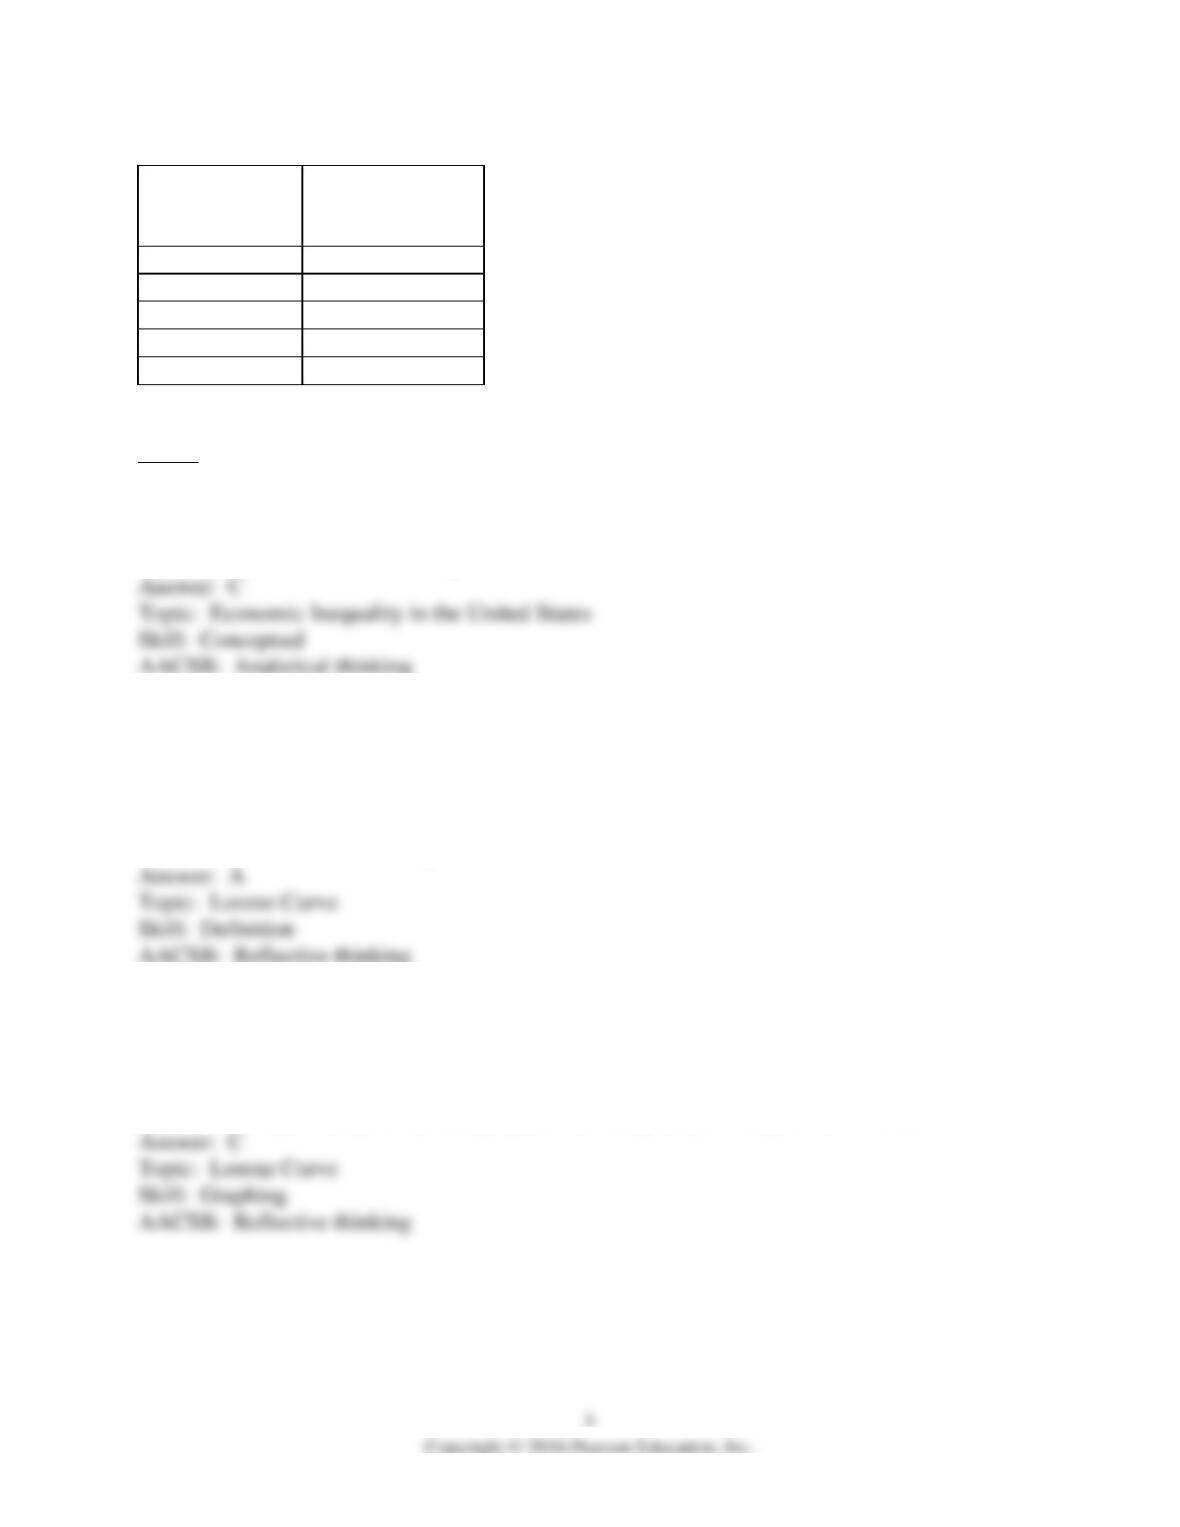
Percent of
households
(percent)
Percent of income
(percent)
Lowest 20
15
Second 20
15
Third 20
20
Fourth 20
20
Highest 20
30
17) An economy has the income shares information in the table above. Which of the following is
TRUE?
A) The information in the table represents the income distribution in the United States.
B) Income in the U.S. economy is more equally distributed than that represented in the table.
C) Income in the U.S. economy is less equally distributed than that represented in the table.
D) The information in the table represents the wealth distribution in the United States.
18) As a tool that is used to measure inequality in the distribution of income, the Lorenz curve
graphs
A) the cumulative percentage of income against the cumulative percentage of households.
B) the percentage of total income received by each given percentage of households.
C) the mean income, median income, and mode income against the percentage of households.
D) the mean income received by households over time.
19) The Lorenz curve graphs the
A) cumulative percentage of spending against the cumulative percentage of households.
B) marginal percentage of income against the marginal percentage of households.
C) cumulative percentage of income against the cumulative percentage of households.
D) cumulative percentage of spending against the marginal percentage of households.
20) A Lorenz curve graphs the
A) percentage of income or wealth against the percentage of households.
B) cumulative percentage of income or wealth against the cumulative percentage of households.
C) cumulative value of income against the cumulative percentage of households.
D) percentage of wealth against the percentage of income.
21) A Lorenz curve measures
A) the benefits received through welfare programs.
B) the actual income distribution and compares it to an equal income distribution.
C) the degree to which income taxes are regressive.
D) the effect of flat taxes on income distribution.
22) A Lorenz curve can be used to illustrate
A) the supply of labor.
B) the substitution effect.
C) the income effect.
D) the distribution of income.
23) The Lorenz curve
A) explains why some households have different incomes.
B) explains why income is equally distributed.
C) graphically shows the degree of income inequality.
D) graphically shows the amount of wealth in a country.
24) From left to right, the horizontal axis of the Lorenz curve ranks households from
A) smallest to largest.
B) largest to smallest.
C) poorest to richest.
D) richest to poorest.
25) Country A has a more equal distribution of income than country B if
A) country A’s Lorenz curve is closer to the line of equality than is country B’s Lorenz curve.
B) country B’s Lorenz curve is closer to the line of equality than is country A’s Lorenz curve.
C) country A’s Lorenz curve is just as close to the line of equality as is country B’s Lorenz curve.
D) None of the above because it is impossible to compare income inequalities across countries.
26) The farther the Lorenz curve for income is from the line of equality, the more ________ is
distributed.
A) equally wealth
B) unequally income
C) unequally wealth
D) equally income
27) If a Lorenz curve for a country’s income bows more rightward over time, then the country’s
A) income is increasing.
B) income is decreasing.
C) income is becoming more unequally distributed.
D) income is becoming more equally distributed.
28) If a Lorenz curve for income moves rightward and becomes more bowed out over time, then
A) the population is growing.
B) income is growing.
C) income is being more equally distributed.
D) income is being more unequally distributed.
29) If a Lorenz curve moves leftward and becomes closer to the line of equality over time, then
A) the population is growing.
B) income is growing.
C) income is being more equally distributed.
D) income is being more unequally distributed.
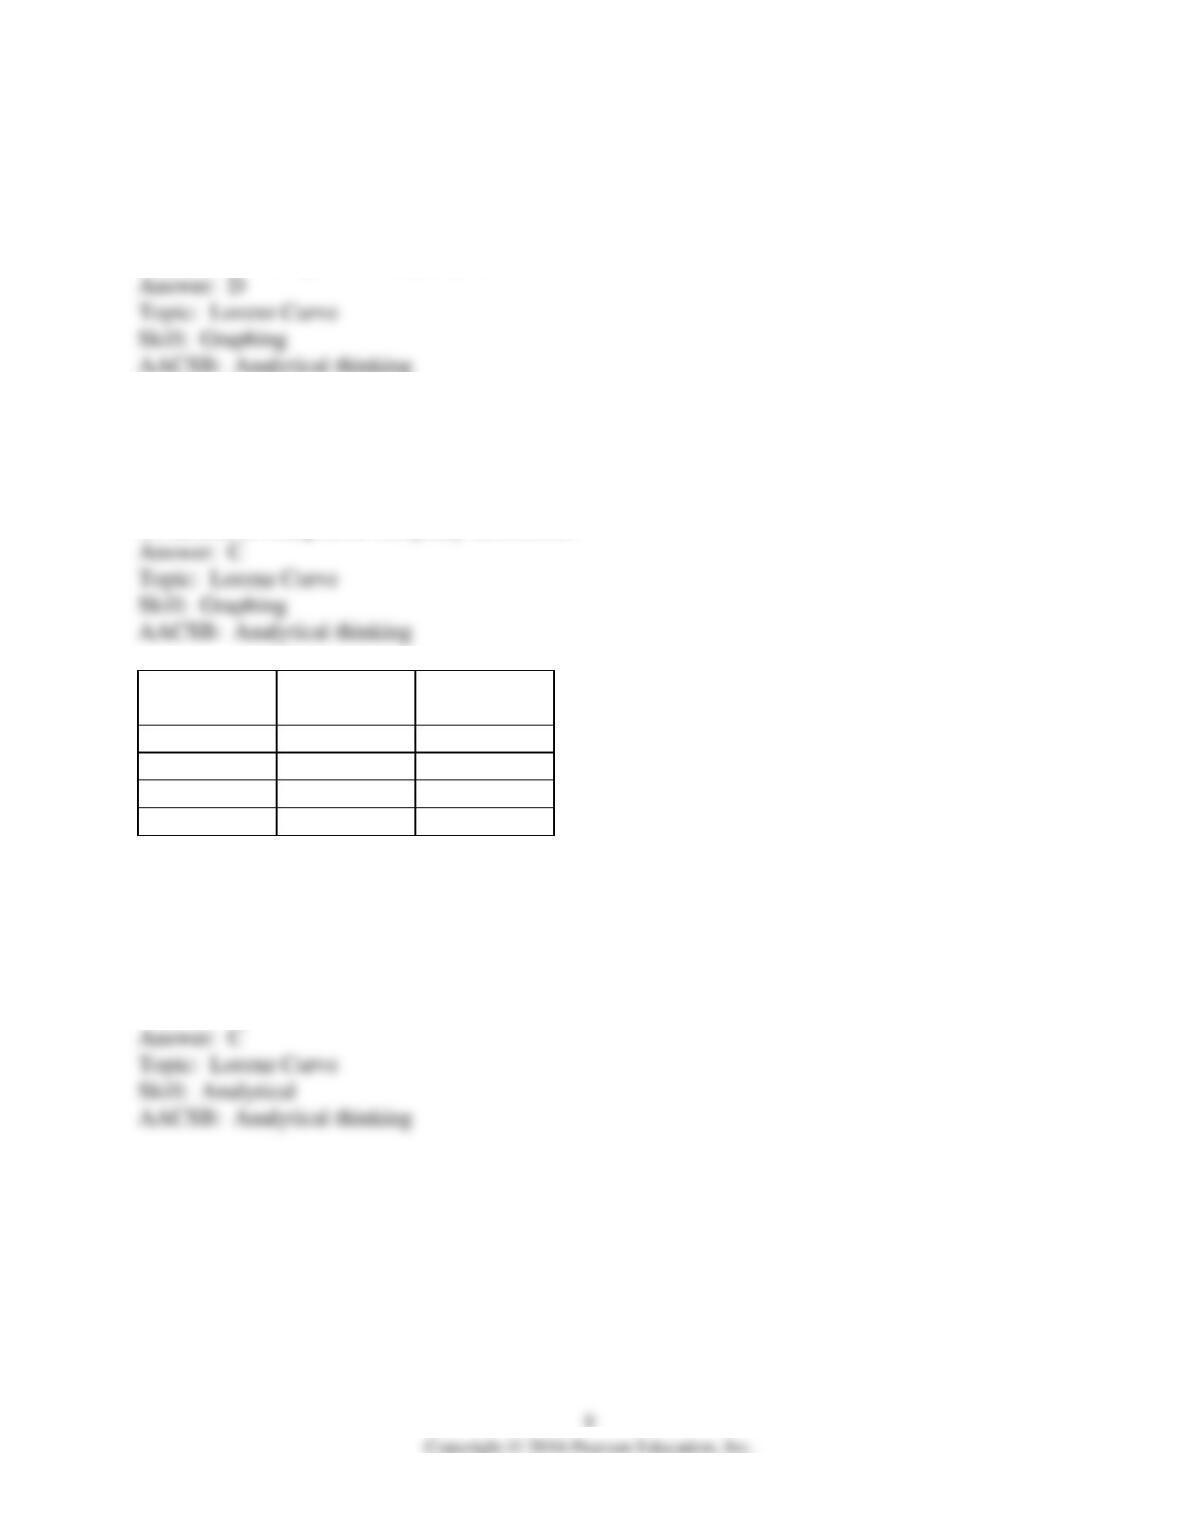
Group
Percent of
income
Percent of
wealth
Poorest 20%
5
0
Poorest 40%
15
2
Poorest 60%
30
5
Poorest 80%
55
10
30) The above table shows the distribution of income and wealth in Miseria. What percent of
income is earned by the richest twenty percent?
A) 5 percent
B) 20 percent
C) 45 percent
D) 55 percent

31) The above table shows the distribution of income and wealth in Miseria. What percent of
income is earned by the richest 40 percent of the population?
A) 20 percent
B) 30 percent
C) 55 percent
D) 70 percent
32) The above table shows the distribution of wealth and income for Miseria. What percent of
the wealth is owned by the wealthiest twenty percent of the population?
A) 0 percent
B) 2 percent
C) 5 percent
D) 83 percent
33) The above table shows the distribution of wealth and income for Miseria. What percent of
wealth is owned by the poorest forty percent of the population?
A) 0 percent
B) 2 percent
C) 5 percent
D) 10 percent
34) The above table shows the distribution of wealth and income in Miseria. What percent of
wealth is owned by the poorest twenty percent?
A) 0 percent
B) 2 percent
C) 3 percent
D) 5 percent
35) The above table shows the distribution of wealth and income in Miseria. The Lorenz curve
for wealth would
A) be parallel to the line of equality.
B) lie to the left of the Lorenz curve for income.
C) become flatter when moving from left to right.
D) intersect the horizontal axis at twenty percent.
36) The above table shows the distribution of wealth and income in Miseria. The Lorenz curve
for wealth would
A) intersect the horizontal axis at 100 percent.
B) bow outward more to the right than does the Lorenz curve for income.
C) lie parallel to the line of equality.
D) become flatter as one moves from left to right.
37) The above table shows the distribution of wealth and income in Miseria. With respect to
income, the richest twenty percent of the population earn
A) 90 percent of the income.
B) 11 times as much as the poorest twenty percent.
C) 9 times as much as the poorest twenty percent.
D) just as much as the second richest twenty percent.
38) The above table shows the distribution of wealth and income in Miseria. Ninety-five percent
of the wealth is owned by what percent of the population?
A) 20 percent
B) 40 percent
C) 60 percent
D) 95 percent
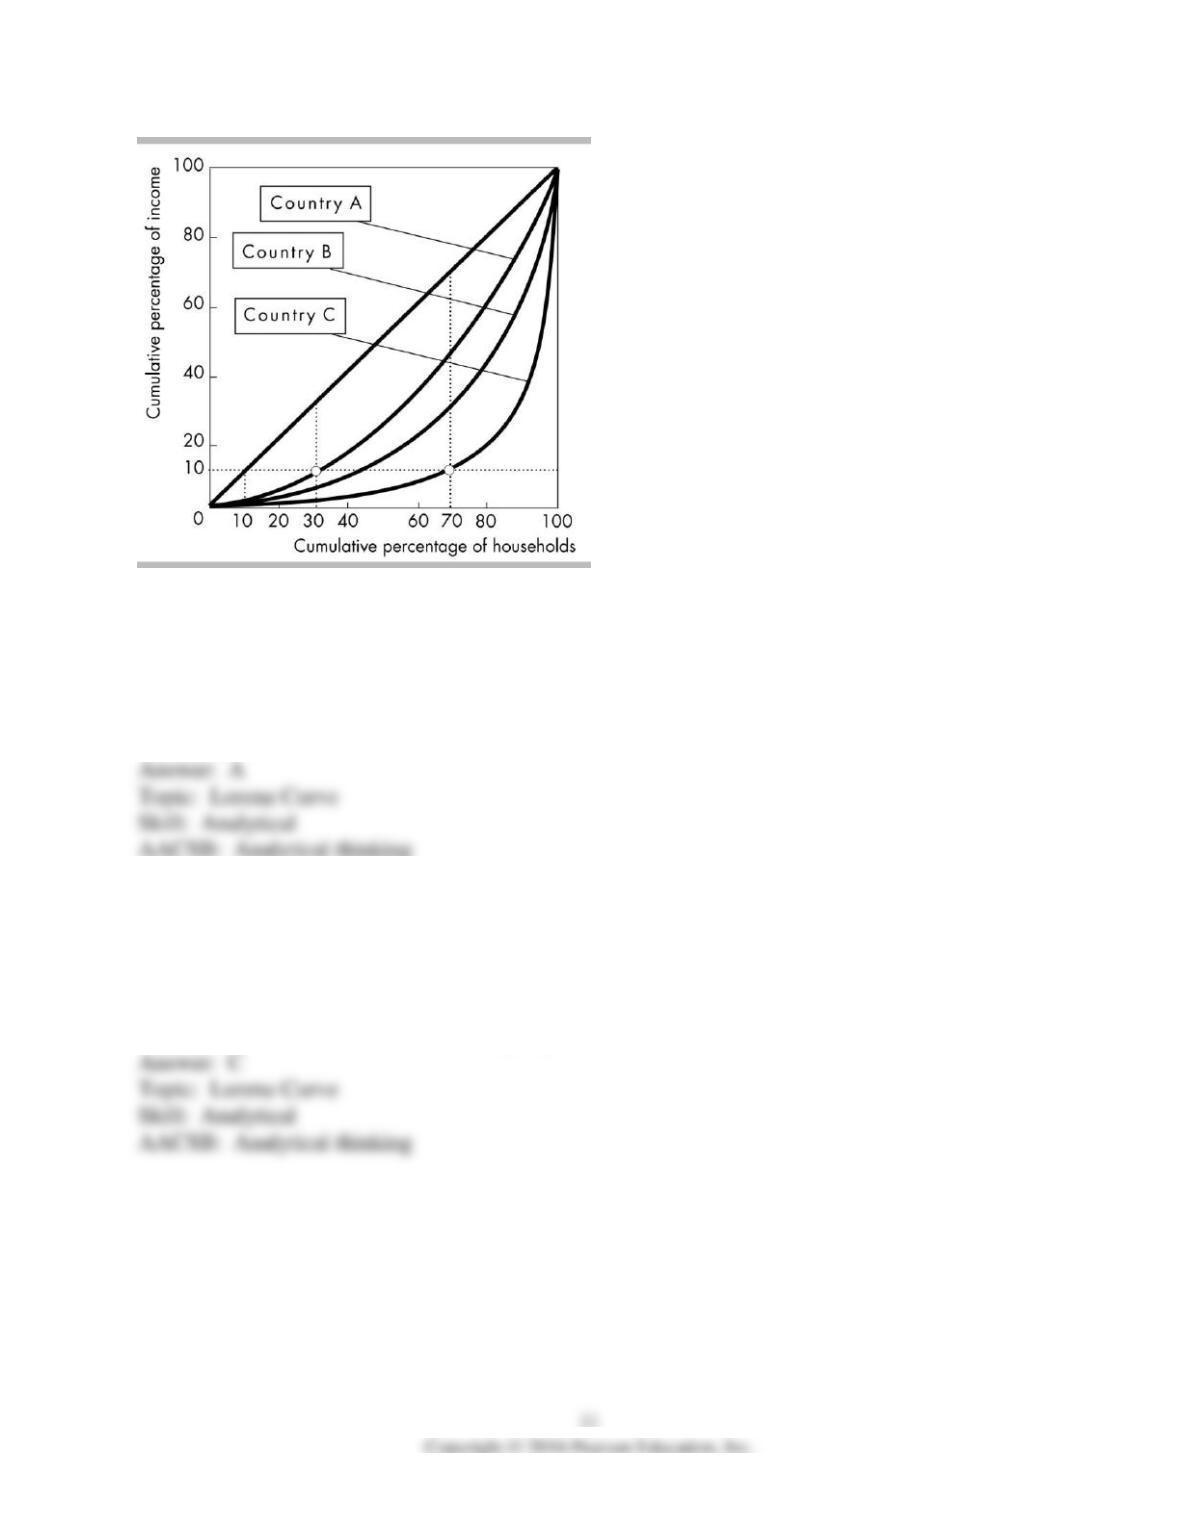
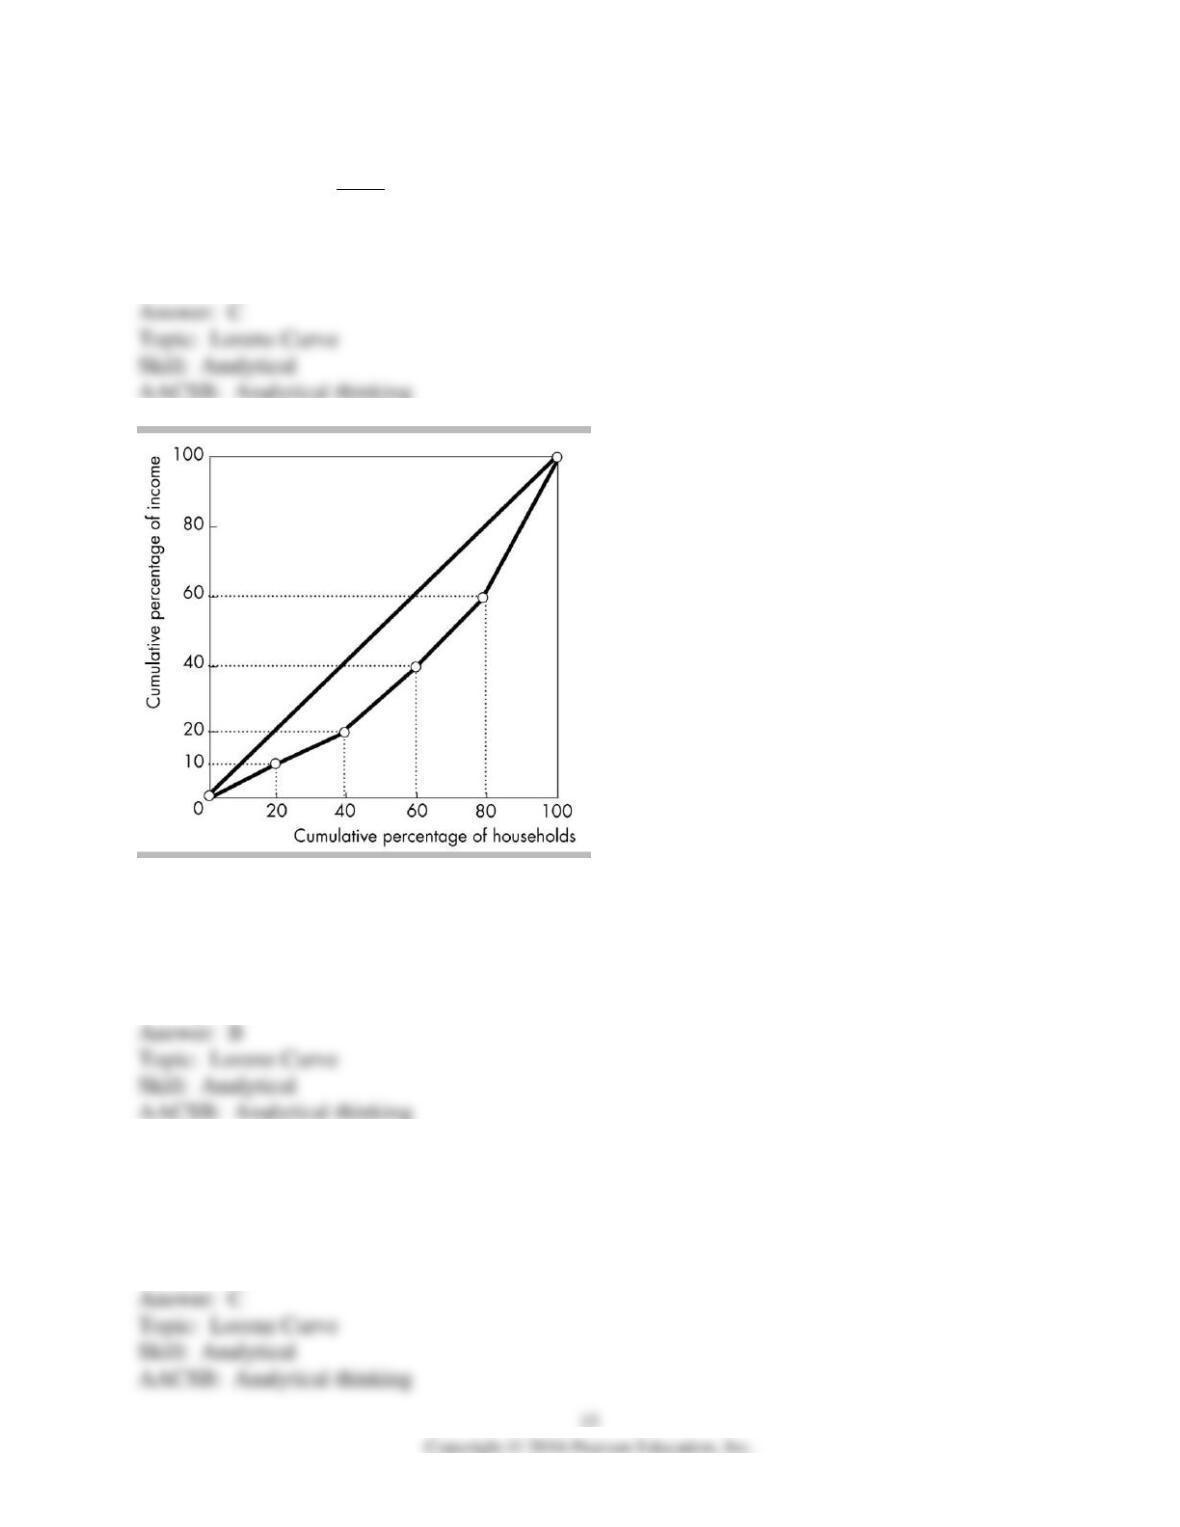
39) In the above figure, the straight line between the lower left corner and the upper right corner
shows
A) perfect equality in income distribution.
B) perfect inequality in income distribution.
C) that wealth rises as income rises.
D) that household size rises as income rises.
40) In the figure above, income is most unequally distributed
A) in Country A.
B) in Country B.
C) in Country C.
D) in one of the nations, but without more information, it is not possible to determine in which
country income is distributed most unequally.
41) In the figure above, income
A) is most equally distributed in country A.
B) is most equally distributed in country B.
C) is most equally distributed in country C.
D) is equally distributed in all three countries.
42) In the figure above, in which country do the lowest-income 30 percent of households have
the highest fraction of the nation’s income?
A) Country A
B) Country B
C) Country C
D) It is impossible to answer the question without more information.
43) In the figure above, in which country do the highest-income 30 percent of households have
the highest fraction of the nation’s income?
A) Country A
B) Country B
C) Country C
D) It is impossible to answer the question without more information.
44) In the figure above, 10 percent of income in country A is distributed to the
A) richest 10 percent of the households.
B) poorest 10 percent of the households.
C) richest 30 percent of the households.
D) poorest 30 percent of the households.
45) In the figure above, 10 percent of income in country C is distributed to the
A) richest 10 percent of the households.
B) poorest 10 percent of the households.
C) poorest 30 percent of the households.
D) poorest 70 percent of the households.
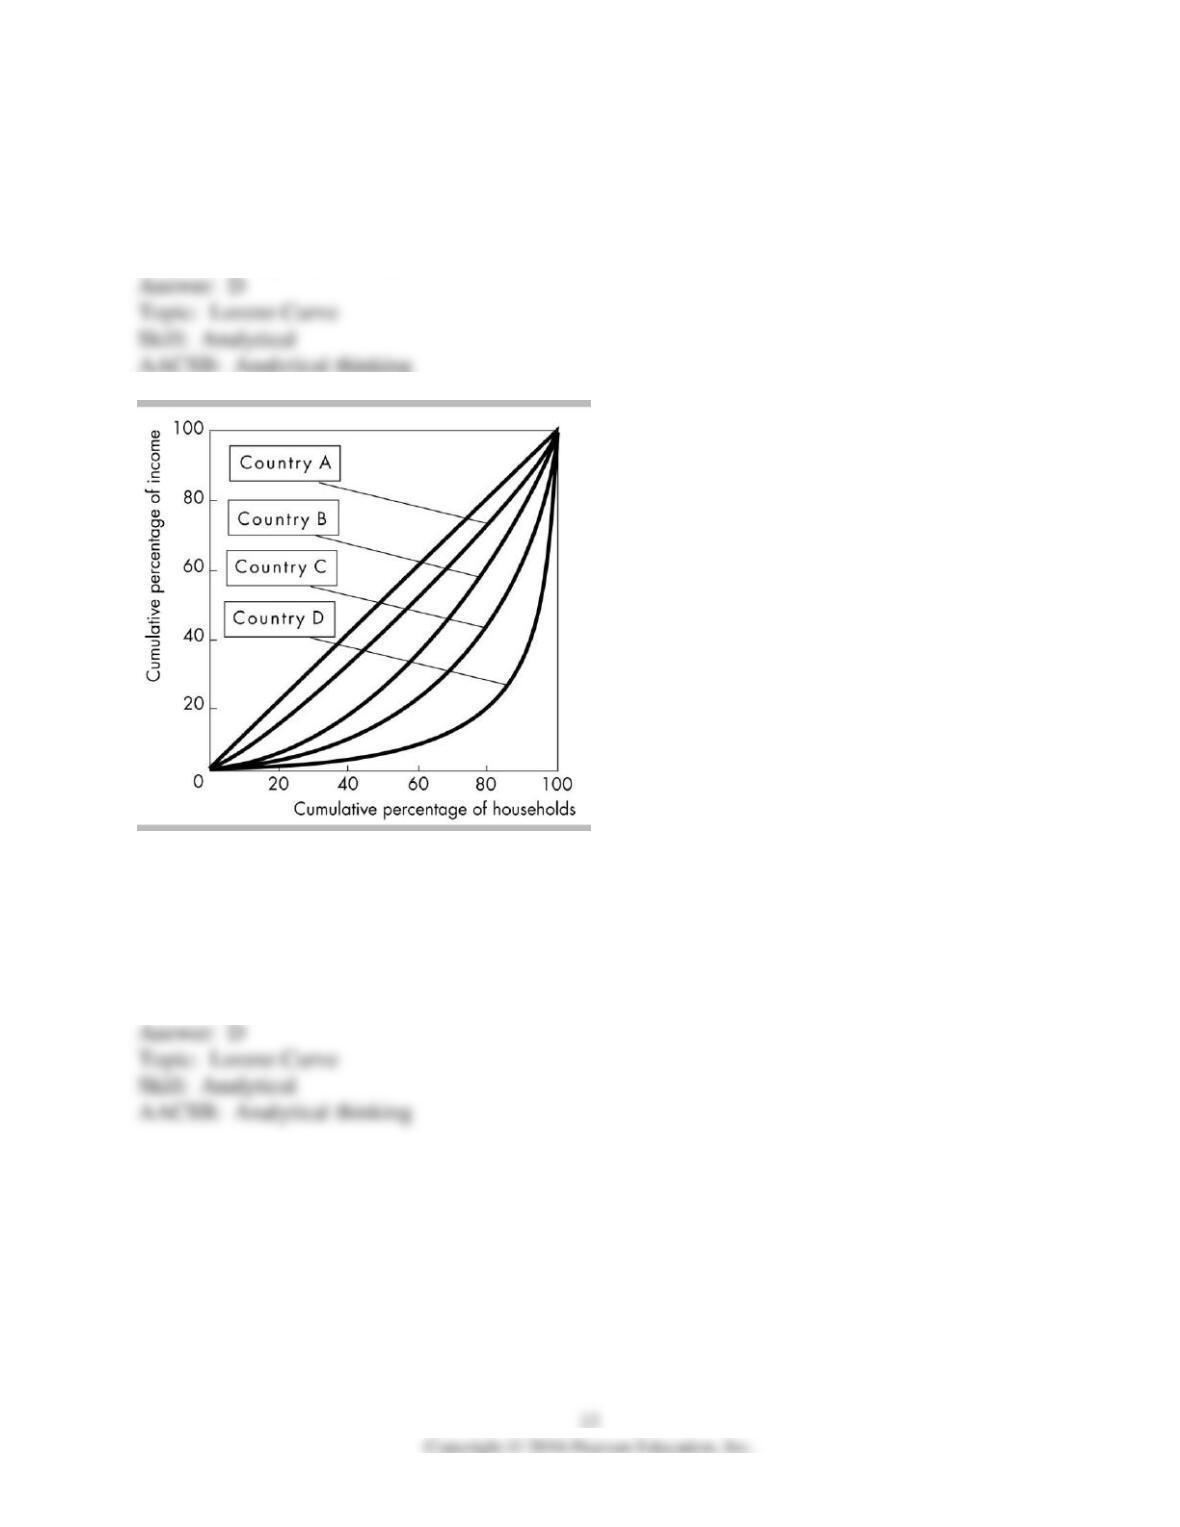
46) The above figure shows the Lorenz curves for four different countries. Which country has
the most unequal distribution of income?
A) country A
B) country B
C) country C
D) country D

47) The above figure shows the Lorenz curves for four different countries. In which country is
income most equally distributed?
A) country A
B) country B
C) country C
D) country D
48) The above figure shows the Lorenz curves for four different countries. If country C
implemented a policy of redistribution from rich to poor, its Lorenz curve would
A) move toward country B’s.
B) move toward country D’s.
C) become positively sloped.
D) move above the line of equality.
49) The above figure shows the Lorenz curves for four different countries. Which of the
following statements CANNOT be made on the basis of the graph?
A) Incomes are distributed unequally in all four countries.
B) Income distribution in country D is the most unequal among the four countries.
C) Incomes are higher in country A than in country B.
D) Income distribution is more equal in country B than in country D.
50) The above figure shows the Lorenz curves for four different countries. Which of the
following statements is FALSE?
A) Country A has an income distribution that is not perfectly equal.
B) Country D’s income distribution is the most unequal of the four countries.
C) The distribution of income is more unequal in country A than in country B.
D) The distribution of income is more unequal in country D than in country C.
51) The above figure shows the Lorenz curves for four different countries. Which of the
following statements CAN be made on the basis of the graph?
A) Country C has the best balance between equity and efficiency.
B) Country A is a socialist country.
C) The income distribution is more equal in country B than in country D.
D) all of the above
52) In the figure above, the poorest 40 percent of all households receive what share of income?
A) 10 percent
B) 20 percent
C) 40 percent
D) 60 percent
53) In the figure above, the middle fifth of all households receive what share of income?
A) 10 percent
B) 30 percent
C) 20 percent
D) 5 percent
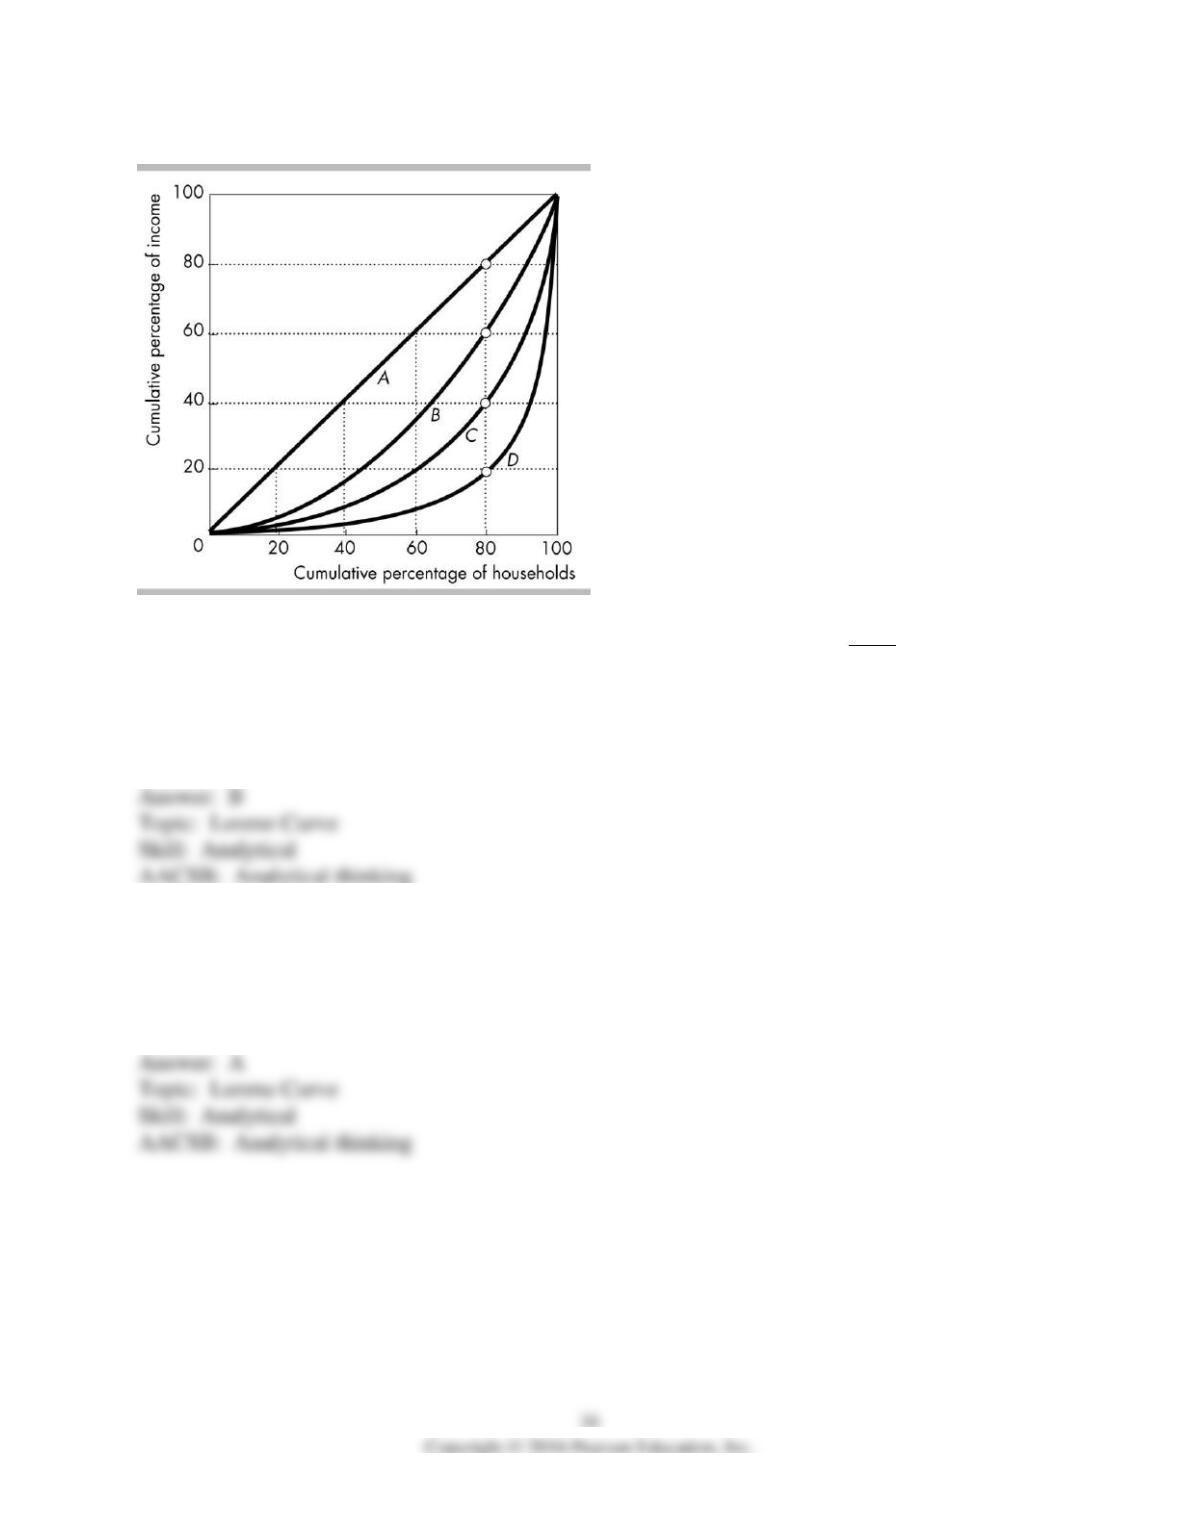
54) In the figure above, the Lorenz curve that shows the least inequality, but NOT perfect
equality, is
A) curve A.
B) curve B.
C) curve C.
D) curve D.
55) In the figure above, the line of equality is
A) curve A.
B) curve B.
C) curve C.
D) curve D.
56) In the figure above, line A represents the
A) the line of market income distribution.
B) line of equality.
C) line of equal number of people in each household.
D) line of equal consumption in each household.
57) In the figure above, the Lorenz curve that shows the richest 20 of households percent
receiving 60 percent of all income is
A) curve A.
B) curve B.
C) curve C.
D) curve D.
58) In the figure above, the Lorenz curve that shows the richest 20 percent of households
receiving 40 percent of all income is
A) curve A.
B) curve B.
C) curve C.
D) curve D.
59) In the figure above, the Lorenz curve that shows the richest 20 percent of households
receiving 80 percent of all income is
A) curve A.
B) curve B.
C) curve C.
D) curve D.
60) In the figure above, the lowest 20 percent of all households receive ________ percent of all
income, the next lowest 20 percent receive ________ percent of all income and the richest 20
percent receive ________ percent of all income.
A) 20; 20; 20
B) 20; 40; 100
C) 10; 20; 40
D) 10; 10; 40
61) In the figure above, the richest 20 percent of all households receive what share of all income?
A) 10 percent
B) 20 percent
C) 30 percent
D) 40 percent
62) In the figure above, the poorest 20 percent of all households receive what share of all
income?
A) 10 percent
B) 20 percent
C) 30 percent
D) 40 percent
63) In the figure above, the second poorest fifth of all households receive what share of all
income?
A) 10 percent
B) 20 percent
C) 30 percent
D) 40 percent
64) In the figure above, the middle fifth of all households receive what share of all income?
A) 10 percent
B) 20 percent
C) 30 percent
D) 40 percent
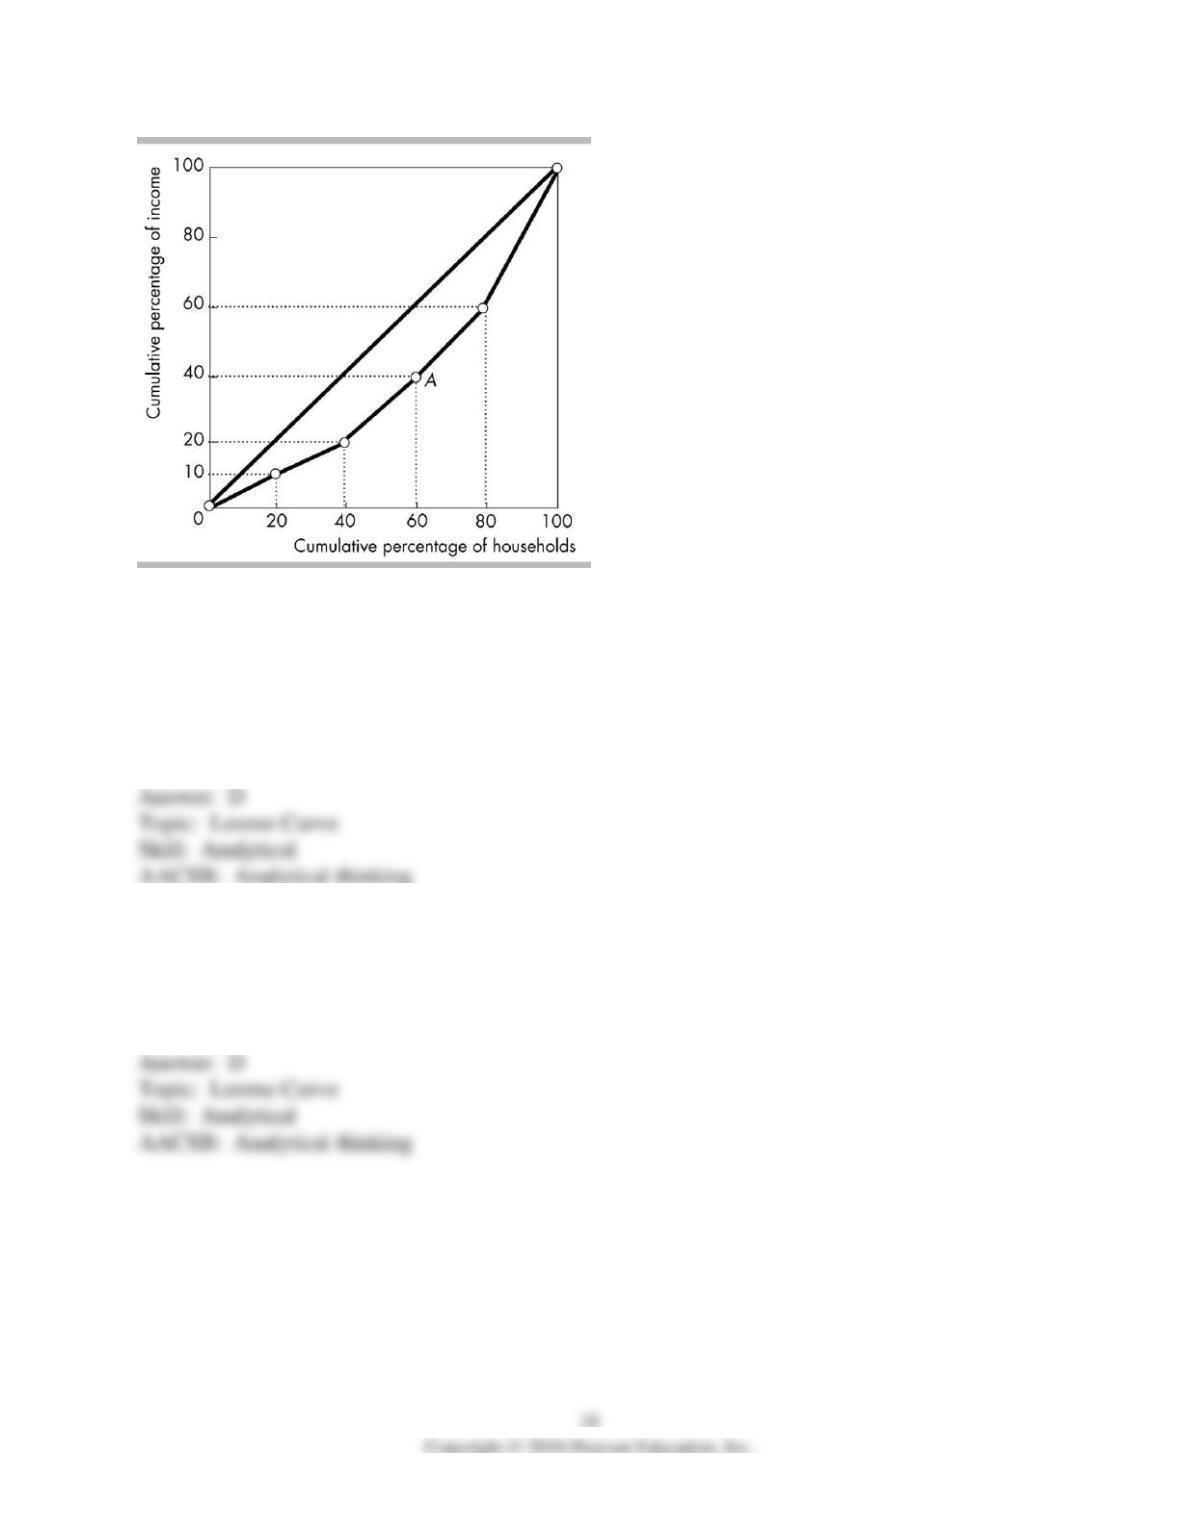
65) In the figure above, the curve going through point A represents
A) an upward-sloping demand curve.
B) the line of equality.
C) the wage curve.
D) the Lorenz curve.
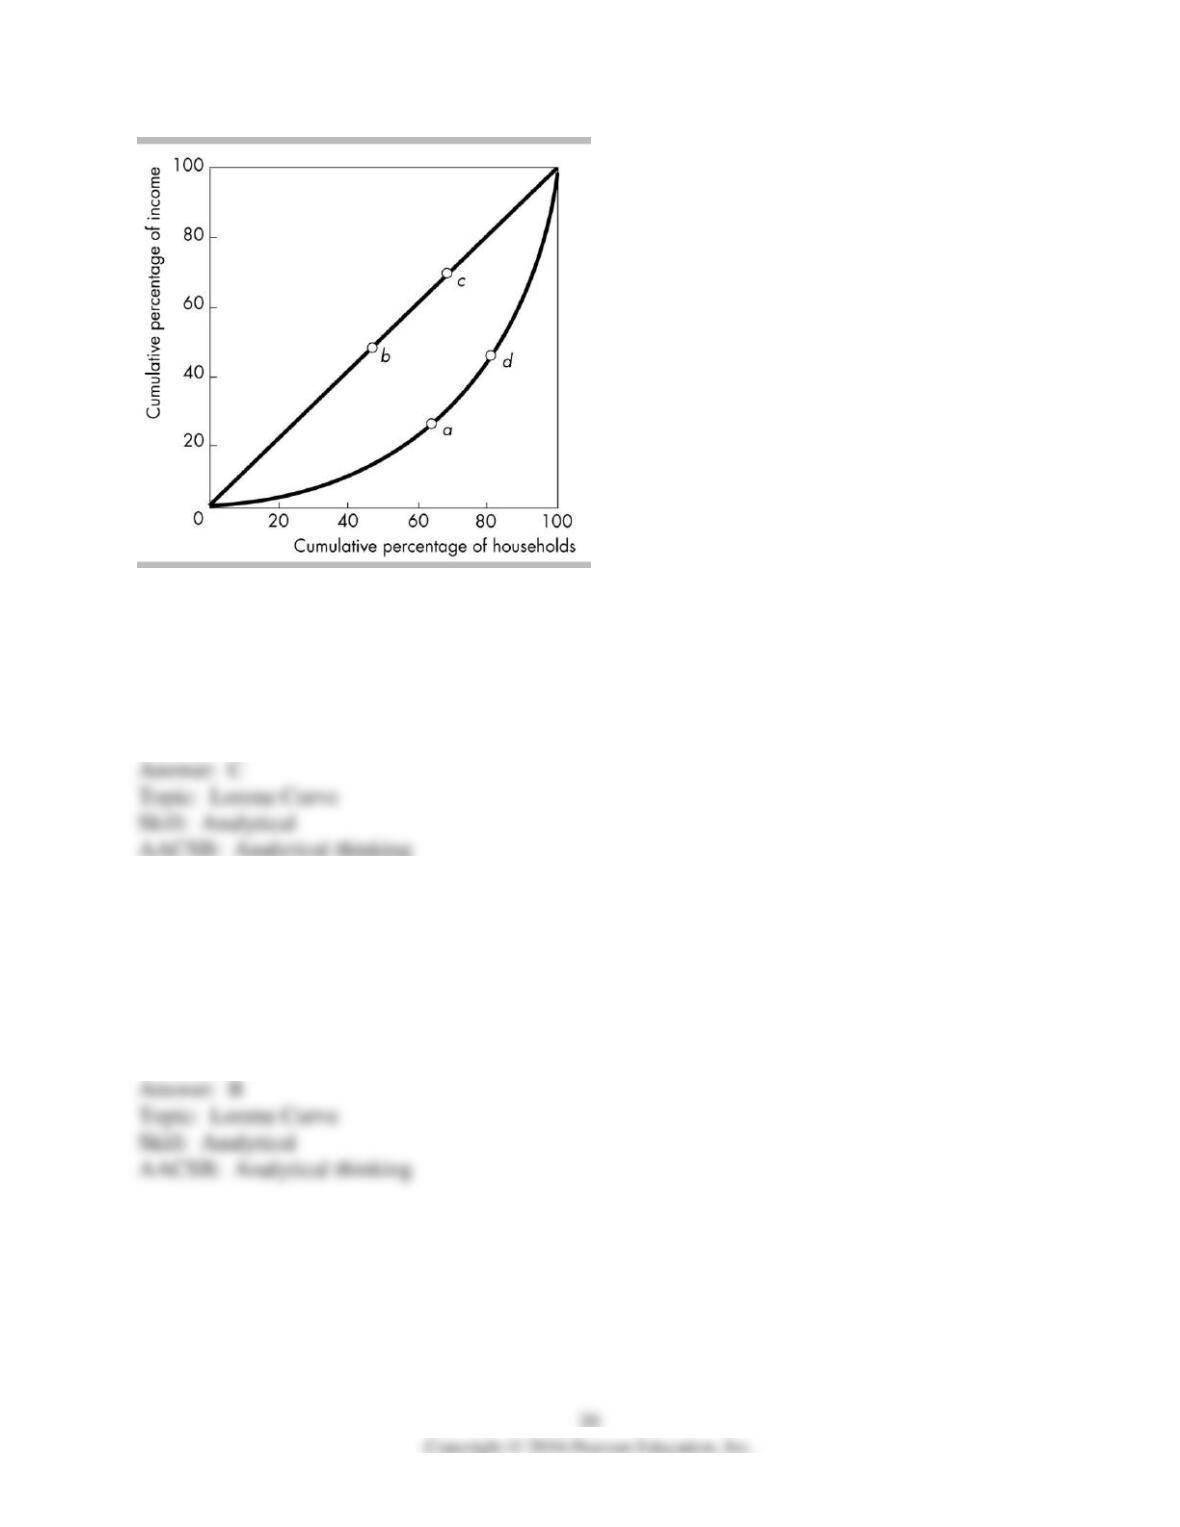
66) In the above figure, point ________ shows an equal distribution of income, while point
________ shows an unequal distribution of income.
A) a, b
B) b, c
C) b, a
D) a, d
67) In the above figure, if the Lorenz curve were to move closer to the diagonal line containing
points b and c, the income distribution would be
A) more unequal.
B) more equal.
C) unchanged.
D) More information is needed to determine how this change would affect the income
distribution.