Table 18-7
Number of
Workers
Output
Marginal Product
of Labor
Value of Marginal
Product of Labor
Wage
Marginal
Profit
0
0
—
—
$500
—
1
100
AA
$1,000
$500
$500
2
BB
80
$ 800
$500
CC
3
DD
60
EE
$500
$100
4
280
FF
$ 400
$500
GG
5
HH
20
II
$500
JJ
130. Refer to Table 18-7. What is the market price of the final good?
a.
$5
b.
$6
c.
$8
d.
$10
131. Refer to Table 18-7. It is apparent from this table that increasing marginal product
a.
occurs only after the first worker is hired.
b.
occurs only after the second worker is hired.
c.
occurs only after the third worker is hired.
d.
never occurs.
132. Refer to Table 18-7. What is the value for the cell labeled BB?
a.
80 units
b.
100 units
c.
180 units
d.
200 units
133. Refer to Table 18-7. What is the value for the cell labeled FF?
a.
30
b.
40
c.
100
d.
400
134. Refer to Table 18-7. The fact that the marginal product falls as the number of workers increases illustrates a
property called
a.
diminishing marginal product.
b.
utility maximization.
c.
supply and demand.
d.
labor theory.
135. Refer to Table 18-7. The fact that the production function exhibits diminishing marginal productivity implies that
a.
total production decreases beyond a certain level of output.
b.
labor markets are not always competitive.
c.
the additions to total output get smaller as more workers are hired.
d.
marginal profit is negative.
136. Refer to Table 18-7. What is the value of the cell labeled GG?
a.
$400
b.
$100
c.
$0
d.
−$100
137. Refer to Table 18-7. What is the value of the cell labeled II?
a.
–$100
b.
$100
c.
$200
d.
$300
138. Refer to Table 18-7. What is the value of the cell labeled JJ?
a.
–$300
b.
–$200
c.
–$100
d.
$0
139. Refer to Table 18-7. To maximize its profit, how many workers will the firm hire?
a.
2
b.
3
c.
4
d.
5
140. Refer to Table 18-7. To maximize its profit, the firm will hire workers as long as the value of the marginal product
of labor equals or exceeds
a.
$100.
b.
$200.
c.
$400.
d.
$500.
Table 18-8
Harold and Maude own a dance studio where they and their employees teach ballroom dancing. Their company is a
competitive, profit-maximizing firm. Harold and Maude’s production function is detailed in the table below.
Labor
(# of workers)
Output
(in number of
students per
day)
0
0
1
90
2
170
3
220
4
250
5
270
141. Refer to Table 18–8. What is the marginal product of the third worker?
a.
220 students
b.
73.33 students
c.
50 students
d.
30 students
142. Refer to Table 18–8. What is the marginal product of the fourth worker?
a.
250 students
b.
62.5 students
c.
50 students
d.
30 students
143. Refer to Table 18–8. If Harold and Maude pay their workers $80 per day and charge $20 per dance lesson, what is
the value of the marginal product of the second worker?
a.
$400
b.
$800
c.
$1,600
d.
$4,800
144. Refer to Table 18–8. If Harold and Maude pay their workers $80 per day and charge $20 per dance lesson, what is
the value of the marginal product of the third worker?
a.
$400
b.
$800
c.
$1,000
d.
$1,600
145. Refer to Table 18–8. If Harold and Maude offer a special sale for one day where dance lessons are $5 each, and if
they pay their workers $200 per day for that day, what is the maximum number of workers that they will hire for that day?
a.
1
b.
2
c.
3
d.
4
Table 18-9
The following table shows the production function for a particular business. The numbers represent the various labor and
output combinations the firm may choose for its output on a daily basis.
Labor
Output
0
0
1
70
2
130
3
180
4
220
5
250
146. Refer to Table 18–9. What is the marginal product of the third unit of labor?
a.
40 units
b.
50 units
c.
60 units
d.
180 units
147. Refer to Table 18–9. What is the marginal product of the fourth unit of labor?
a.
40 units
b.
50 units
c.
60 units
d.
180 units

148. Refer to Table 18–9. What is the marginal product of the fifth unit of labor?
a.
30 units
b.
40 units
c.
50 units
d.
250 units
149. Refer to Table 18–9. Suppose this firm charges a price of $5 per unit of output and pays workers a wage equal to
$160 per day. What is the value of the marginal product of labor for the second worker?
a.
$300
b.
$650
c.
$9,600
d.
$20,800
150. Refer to Table 18–9. Suppose this firm charges a price of $5 per unit of output and pays workers a wage equal to
$160 per day. What is the value of the marginal product of labor for the third worker?
a.
$90
b.
$250
c.
$300
d.
$800
151. Refer to Table 18–9. Suppose this firm charges a price of $5 per unit of output and pays workers a wage equal to
$160 per day. What is the value of the marginal product of labor for the fourth worker?
a.
$200
b.
$1,000
c.
$6,400
d.
$32,000
152. Refer to Table 18–9. Suppose this firm charges a price of $5 per unit of output and pays workers a wage equal to
$160 per day. How many workers should this firm hire to maximize its profit?
a.
2 workers
b.
3 workers
c.
4 workers
d.
5 workers
Table 18–10
Quantity of
Number of Baseballs
Labor
Per Day
0
0
1
100
2
240
3
360
4
440
5
500
153. Refer to Table 18–10. This table describes the number of baseballs a manufacturer can produce per day with
different quantities of labor. Each baseball sells for $5 in a competitive market. For which level of employment is the
marginal product of labor greatest?
a.
1 worker
b.
2 workers
c.
3 workers
d.
4 workers
154. Refer to Table 18–10. This table describes the number of baseballs a manufacturer can produce per day with
different quantities of labor. Each baseball sells for $5 in a competitive market. What is the total revenue per day that the
firm will earn if it employs five workers?
a.
$500
b.
$300
c.
$2,200
d.
$2,500
155. Refer to Table 18–10. This table describes the number of baseballs a manufacturer can produce per day with
different quantities of labor. Each baseball sells for $5 in a competitive market. What is the marginal revenue product of
the third worker?
a.
120 baseballs.
b.
$300
c.
$400
d.
$600
156. Refer to Table 18–10. This table describes the number of baseballs a manufacturer can produce per day with
different quantities of labor. Each baseball sells for $2.50 in a competitive market. What is the marginal revenue product
of the fourth worker?
a.
$200
b.
$300
c.
$400
d.
$500
157. Refer to Table 18–10. This table describes the number of baseballs a manufacturer can produce per day with
different quantities of labor. Each baseball sells for $5 in a competitive market and the firm pays each unit of labor a wage
equal to $320 per day. How many units of labor should the firm hire to maximize profit?
a.
2 units
b.
3 units
c.
4 units
d.
5 units
158. Refer to Table 18–10. This table describes the number of baseballs a manufacturer can produce per day with
different quantities of labor. Each baseball sells for $2.50 in a competitive market and the firm pays each unit of labor a
wage equal to $225 per day. How many units of labor should the firm hire to maximize profit?
a.
2 units
b.
3 units
c.
4 units
d.
5 units
Table 18-B
Consider the following daily production data for MadeFromScratch, Inc. MadeFromScratch sells cupcakes for $3 each
and pays the workers a wage of $325 per day.
Labor
(number of
workers)
Quantity
(cupcakes
per day)
Marginal
Product of
Labor
(cupcakes
per day)
Value of the
Marginal
Product of
Labor
Wage
(per day)
Marginal
Profit
0
0
$325
1
200
$325
2
350
$325
3
475
$325
4
575
$325
159. Refer to Table 18–11. What is the third worker’s marginal product of labor?
a.
120 cupcakes
b.
140 cupcakes
c.
160 cupcakes
d.
180 cupcakes
160. Refer to Table 18–11. What is the fourth worker’s marginal product of labor?
a.
120 cupcakes
b.
140 cupcakes
c.
160 cupcakes
d.
180 cupcakes
161. Refer to Table 18–11. What is the fifth worker’s marginal product of labor?
a.
120 cupcakes
b.
140 cupcakes
c.
160 cupcakes
d.
180 cupcakes
162. Refer to Table 18–11. What is the sixth worker’s marginal product of labor?
a.
100 cupcakes
b.
120 cupcakes
c.
140 cupcakes
d.
160 cupcakes
163. Refer to Table 18–11. What is the value of the marginal product of the first worker?
a.
$200
b.
$400
c.
$500
d.
$700
164. Refer to Table 18–11. What is the value of the marginal product of the second worker?
a.
$180
b.
$360
c.
$450
d.
$720
165. Refer to Table 18–11. What is the value of the marginal product of the fifth worker?
a.
$120
b.
$240
c.
$300
d.
$1,600
166. Refer to Table 18–11. The marginal product of labor begins to diminish with the addition of which worker?
a.
the 1st worker
b.
the 2nd worker
c.
the 3rd worker
d.
the 4th worker
167. Refer to Table 18–11. What is the marginal profit of the fourth worker?
a.
$280
b.
$25
c.
–$5
d.
–$45
168. Refer to Table 18–11. What is the marginal profit of the sixth worker?
a.
$100
b.
−$50
c.
−$75
d.
−$125
169. Refer to Table 18–11. Assuming MadeFromScratch is a competitive, profit-maximizing firm, how many workers
will the firm hire?
a.
2 workers
b.
3 workers
c.
4 workers
d.
5 workers
170. Refer to Table 18–11. Assume that MadeFromScratch is a competitive, profit-maximizing firm. If the market price
of cupcakes increases from $2.00 to $2.50, how many workers would the firm then hire?
a.
2 workers
b.
3 workers
c.
4 workers
d.
5 workers
171. Refer to Table 18–11. Suppose that there is a technological advance that allows MadeFromScratch employees to
produce more cupcakes than they could before. Because of this change, the firm’s
a.
demand for labor shifts right.
b.
demand for labor shifts left.
c.
supply of labor shifts right.
d.
supply of labor shifts left.
172. Refer to Table 18–11. Suppose that the firm suffers a loss of some of their technology such as the theft of their
industrial mixers. After the theft, MadeFromScratch employees produce fewer cupcakes than they could before because
they must mix the cupcake batter by hand rather than using the high-speed mixers. Because of this change, the firm’s
a.
demand for labor shifts right.
b.
demand for labor shifts left.
c.
supply of labor shifts right.
d.
supply of labor shifts left.
Table 18–12
The table displays data for a small, competitive, profit-maximizing firm that produces and sells envelopes. The time frame
is one week.
Labor
L
Marginal Product of Labor
MPL
Wage
W
0 workers
134 boxes of envelopes
$600
1
106
$600
2
92
$600
3
84
$600
4
78
$600
5
173. Refer to Table 18–12. Let Q represent the number of boxes of envelopes produced per week. One point on this
firm’s production function is
a.
(L = 1, Q = 106).
b.
(L = 2, Q = 92).
c.
(L = 2, Q = 106).
d.
(L = 2, Q = 240).
174. Refer to Table 18–12. Let Q represent the number of boxes of envelopes produced per week. Which of the following
points is not a point on this firm’s production function?
a.
(L = 2, Q = 240).
b.
(L = 3, Q = 332).
c.
(L = 4, Q = 408).
d.
(L = 5, Q = 494).
175. Refer to Table 18–12. Suppose the firm sells each box of envelopes that it produces for $6. What is the value of the
marginal product of the second worker?
a.
$1,440
b.
$1,212
c.
$636
d.
$552
176. Refer to Table 18–12. If the value of the marginal product of the first worker hired is $938, then how many workers
does the firm employ?
a.
2
b.
3
c.
4
d.
5
177. Refer to Table 18–12. Suppose the firm sells each box of envelopes that it produces for $6. What is the marginal
profit of the fourth worker?
a.
$-132
b.
$-96
c.
$132
d.
$504
178. Refer to Table 18–12. Suppose the firm sells each box of envelopes that it produces for $7.50. How many workers
should the firm hire?
a.
2
b.
3
c.
4
d.
5
179. Refer to Table 18–12. Suppose the firm sells each box of envelopes that it produces for $7. Suppose also that the
firm’s fixed costs amount to $400. How many workers should the firm hire in order to maximize profit, and what is the
maximum profit?
a.
The firm should hire 2 workers; its maximum profit is $80.
b.
The firm should hire 2 workers; its maximum profit is $96.
c.
The firm should hire 3 workers; its maximum profit is $96.
d.
The firm should hire 3 workers; its maximum profit is $124.
180. Refer to Table 18–12. Suppose the firm sells each box of envelopes that it produces for $6. The firm would not be
interested in hiring a third worker unless the wage fell from its current level of $600 to what level?
a.
$564
b.
$557
c.
$554
d.
$551
Figure 18-4
The graph below illustrates the market for nurses who work in doctors’ offices.
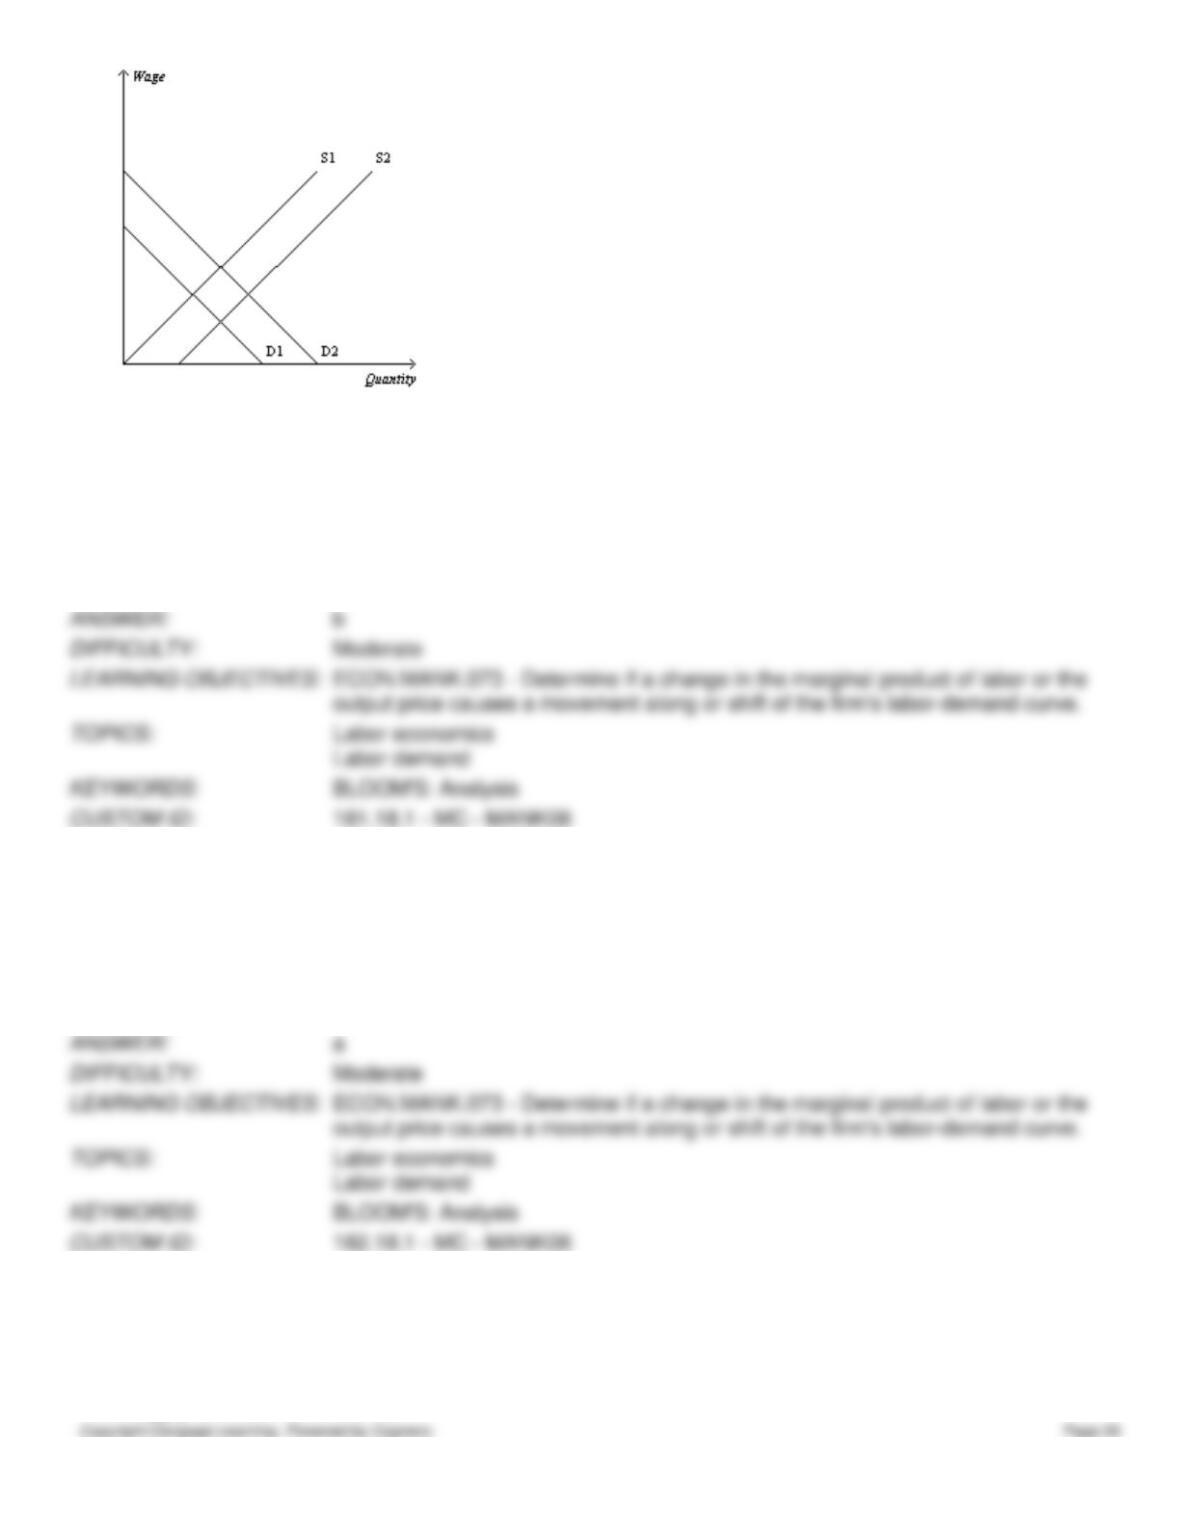
181. Refer to Figure 18–4. Each August many high school and college students visit a doctor’s office to have a sports
physical. If the price of sports physicals falls, what happens in the market for nurses?
a.
Demand increases from D1 to D2.
b.
Demand decreases from D2 to D1.
c.
Supply increases from S1 to S2.
d.
Supply decreases from S2 to S1.
182. Refer to Figure 18–4. Each August many high school and college students visit a doctor’s office to have a sports
physical. If the price of sports physicals rises, what happens in the market for nurses?
a.
Demand increases from D1 to D2.
b.
Demand decreases from D2 to D1.
c.
Supply increases from S1 to S2.
d.
Supply decreases from S2 to S1.
183. Refer to Figure 18–4. If doctors’ offices adopt new labor-saving technologies, what happens in the market for
nurses?
a.
Demand increases from D1 to D2.
b.
Demand decreases from D2 to D1.
c.
Supply increases from S1 to S2.