
1. In a representative labor market,
a.
the wage adjusts to balance the supply and demand for labor.
b.
the wage equals the value of the marginal product of labor.
c.
an increase in the supply of labor increases the equilibrium wage.
d.
Both a and b are correct.
2. Which of the following is correct?
a.
Any event that changes the supply or demand for labor must change the value of the marginal product.
b.
A profit-maximizing firm hires workers so long as the wage rate exceeds the value of the marginal product of
labor.
c.
An increase in the supply of labor increases both employment and wages.
d.
A decrease in the demand for labor decreases wages but increases employment.
3. Which of the following is not correct?
a.
In a labor market, the wage adjusts to balance the supply and demand for labor.
b.
A profit-maximizing firm hires workers so long as the wage rate exceeds the value of the marginal product of
labor.
c.
Any event that changes the supply or demand for labor must change the equilibrium wage.
d.
Any event that changes the supply or demand for labor must change the value of the marginal product.
Scenario 18-4
In 1997, Albania experienced a civil war. The civil unrest sent thousands of refugees across the Adriatic Sea to Italy
where they sought relief from the fighting.
4. Refer to Scenario 18-4. The Albanian civil war probably affected Italian labor markets by causing
a.
total employment in Italy to decrease.
b.
wages in Italy to increase.
c.
the marginal product of labor in Italy to decrease.
d.
All of the above are correct.
5. Refer to Scenario 18-4. The Italian government started to patrol the Adriatic Sea and had a policy of returning all
refugees to Albania. This policy would contribute to
a.
an increase in the supply of labor in Italy.
b.
an increase in the demand labor in Italy.
c.
a decrease in the demand for labor in Italy.
d.
preventing an increase in the supply of labor in Italy.
Scenario 18-5
Suppose that workers from northern Minnesota, North Dakota, and Montana decide to emigrate to southern Canada.
6. Refer to Scenario 18-5. In the labor market in southern Canada, the equilibrium wage
a.
and the equilibrium quantity of labor will rise.
b.
and the equilibrium quantity of labor will fall.
c.
will rise, and the equilibrium quantity of labor will fall.
d.
will fall, and the equilibrium quantity of labor will rise.
7. Refer to Scenario 18-5. In the labor market in the northern United States, the equilibrium wage
a.
and the equilibrium quantity of labor will rise.
b.
and the equilibrium quantity of labor will fall.
c.
will rise, and the equilibrium quantity of labor will fall.
d.
will fall, and the equilibrium quantity of labor will rise.
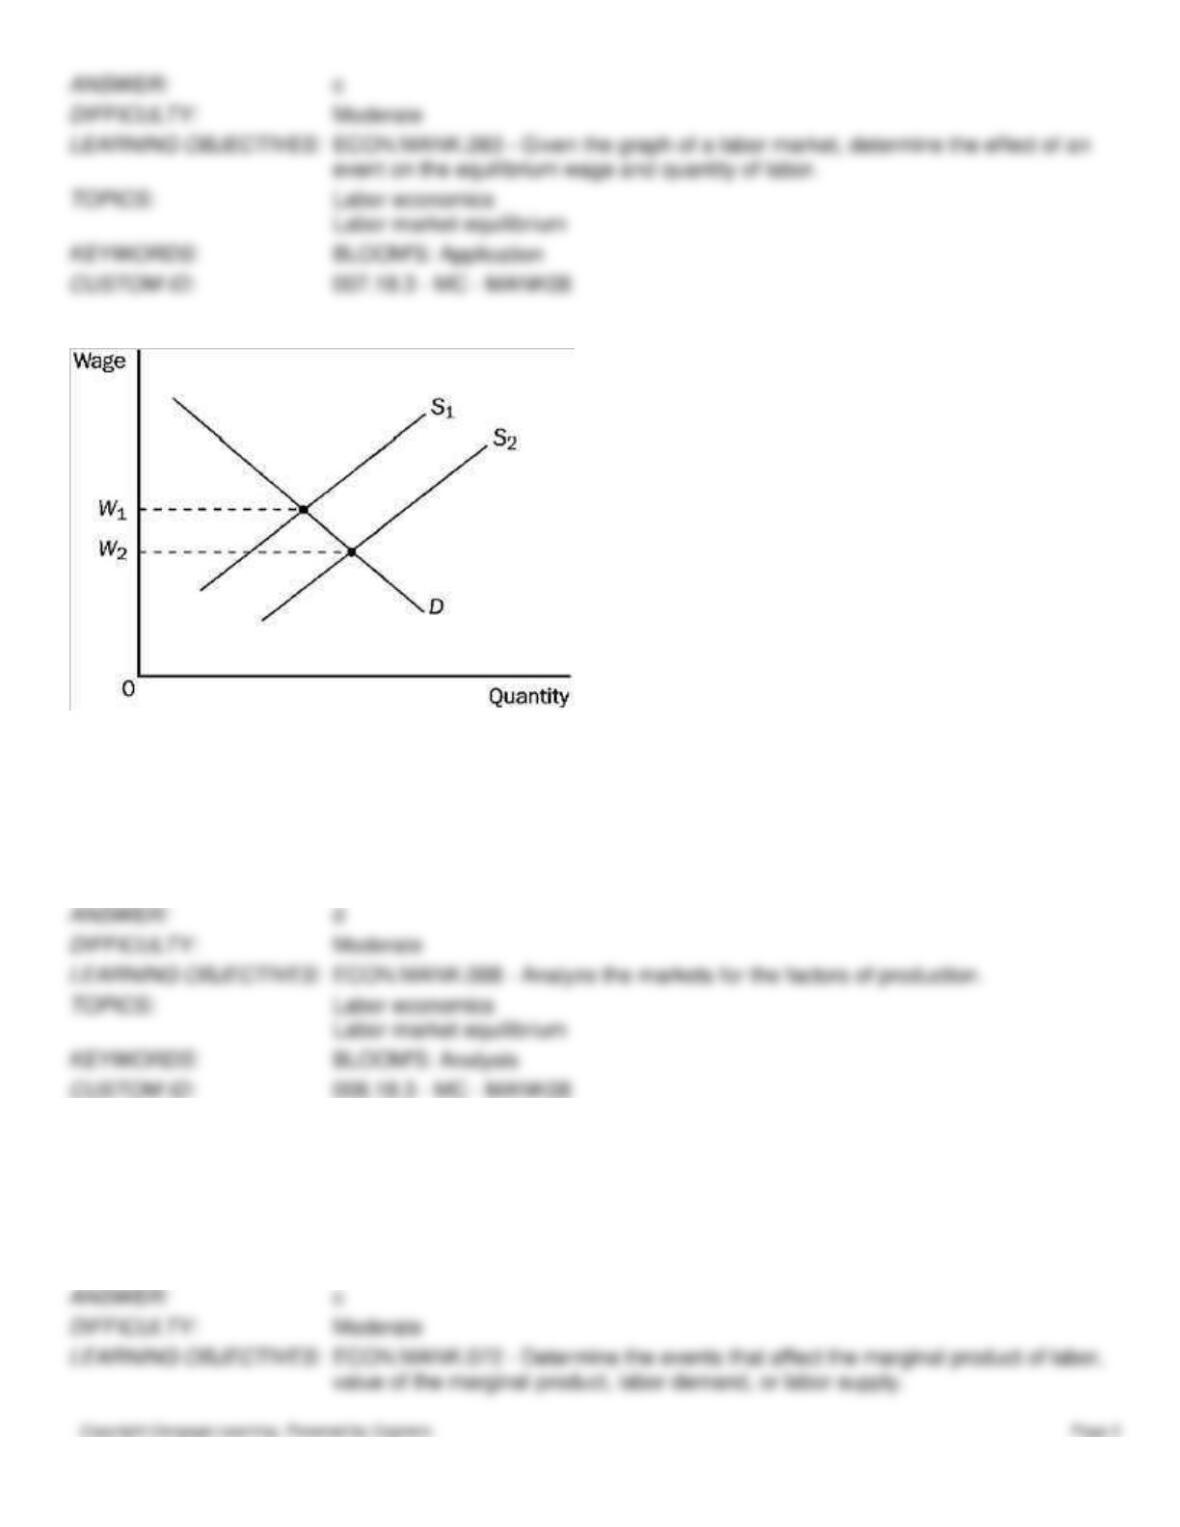
Figure 18-7
8. Refer to Figure 18-7. When the relevant labor supply curve is S1, and the labor market is in equilibrium, the
a.
wage is W1.
b.
opportunity cost of leisure to workers is W1.
c.
value of the marginal product of labor to firms is W1.
d.
All of the above are correct.
9. Refer to Figure 18-7. Which of the following would shift the labor supply curve from S1 to S2?
a.
technological progress
b.
a decrease in the price of the firm’s output
c.
a change in workers’ attitudes toward the work-leisure tradeoff
d.
an increase in the price of the firm’s output

10. Refer to Figure 18-7. Which of the following would shift the labor supply curve from S1 to S2?
a.
a change in workers’ attitudes toward the work-leisure tradeoff
b.
decreases in wages in other labor markets
c.
immigration of workers into the region or country
d.
All of the above are correct.
11. Refer to Figure 18-7. If the relevant labor supply curve is S2 and the current wage is W1,
a.
there is a surplus of labor.
b.
the quantity of labor demanded exceeds the quantity of labor supplied.
c.
an increase in the minimum wage could restore equilibrium in the market.
d.
firms will need to raise the wage to restore equilibrium.
12. Refer to Figure 18-7. Assume W1 = $20 and W2 = $18, and the market is always in equilibrium. A shift of the labor
supply curve from S1 to S2 would
a.
increase the value of the marginal product of labor by $2.
b.
decrease the value of the marginal product of labor by $2.
c.
decrease the value of the marginal product of labor by more than $2.
d.
not change the value of the marginal product of labor.

13. Refer to Figure 18-7. Assume W1 = $15 and W2 = $12, and the market is always in equilibrium. A shift of the labor
supply curve from S1 to S2 would
a.
increase the value of the marginal product of labor by $3.
b.
decrease the value of the marginal product of labor by $3.
c.
decrease the value of the marginal product of labor by more than $3.
d.
not change the value of the marginal product of labor.
14. Suppose that the market for labor is initially in equilibrium. An increase in immigration will cause the equilibrium
wage
a.
and the equilibrium quantity of labor to rise.
b.
and the equilibrium quantity of labor to fall.
c.
to rise and the equilibrium quantity of labor to fall.
d.
to fall and the equilibrium quantity of labor to rise.
15. Suppose that the market for labor is initially in equilibrium. Suppose that workers’ tastes change so that they choose to
retire at age 55 rather than age 67. Then the equilibrium wage
a.
and the equilibrium quantity of labor will rise.
b.
and the equilibrium quantity of labor will fall.
c.
will rise, and the equilibrium quantity of labor will fall.
d.
will fall, and the equilibrium quantity of labor will rise.
16. Suppose that the market for labor is initially in equilibrium. Suppose that workers’ tastes change so that they choose to
retire at age 70 rather than age 67. Then the equilibrium wage
a.
and the equilibrium quantity of labor will rise.
b.
and the equilibrium quantity of labor will fall.
c.
will rise, and the equilibrium quantity of labor will fall.
d.
will fall, and the equilibrium quantity of labor will rise.
17. Consider the market for university economics professors. Suppose the opportunity cost of going to graduate school to
get a Ph.D. in economics decreases for many individuals. Suppose it generally takes about five years to get a Ph.D. in
economics. Holding all else constant, in five years the equilibrium wage for university economics professors will
a.
increase.
b.
decrease.
c.
not change.
d.
It is not possible to determine what will happen to the equilibrium wage.
18. Consider the market for university economics professors. Suppose the opportunity cost of going to graduate school to
get a Ph.D. in economics increases for many individuals. Suppose it generally takes about five years to get a Ph.D. in
economics. Holding all else constant, in five years the equilibrium wage for university economics professors will
a.
increase.
b.
decrease.
c.
not change.
d.
It is not possible to determine what will happen to the equilibrium wage.
19. Consider the market for medical doctors. Suppose the opportunity cost of going to medical school decreases for many
individuals. Suppose it generally takes about ten years to become a practicing doctor. Holding all else constant, in ten
years the equilibrium wage for doctors will
a.
increase.
b.
decrease.
c.
not change.
d.
It is not possible to determine what will happen to the equilibrium wage.
20. Consider the market for medical doctors. Suppose the opportunity cost of going to medical school increases for many
individuals. Suppose it generally takes about ten years to become a practicing doctor. Holding all else constant, in ten
years the equilibrium wage for doctors will
a.
increase.
b.
decrease.
c.
not change.
d.
It is not possible to determine what will happen to the equilibrium wage.
21. Consider the market for university economics professors. Suppose the opportunity cost of going to graduate school to
get a Ph.D. in economics decreases for many individuals. Suppose it generally takes about five years to get a Ph.D. in
economics. Holding all else constant, in five years the equilibrium quantity of university economics professors will
a.
increase.
b.
decrease.
c.
not change.
d.
It is not possible to determine what will happen to the equilibrium quantity.
22. Consider the market for university economics professors. Suppose the opportunity cost of going to graduate school to
get a Ph.D. in economics increases for many individuals. Suppose it generally takes about five years to get a Ph.D. in

economics. Holding all else constant, in five years the equilibrium quantity of university economics professors will
a.
increase.
b.
decrease.
c.
not change.
d.
It is not possible to determine what will happen to the equilibrium quantity.
23. Consider the market for medical doctors. Suppose the opportunity cost of going to medical school decreases for many
individuals. Suppose it generally takes about ten years to become a practicing doctor. Holding all else constant, in ten
years the equilibrium quantity of doctors will
a.
increase.
b.
decrease.
c.
not change.
d.
It is not possible to determine what will happen to the equilibrium quantity.
24. Consider the market for medical doctors. Suppose the opportunity cost of going to medical school increases for many
individuals. Suppose it generally takes about ten years to become a practicing doctor. Holding all else constant, in ten
years the equilibrium quantity of doctors will
a.
increase.
b.
decrease.
c.
not change.
d.
It is not possible to determine what will happen to the equilibrium quantity.
25. When labor supply increases,
a.
the marginal productivity of workers always increases.
b.
profit-maximizing firms reduce employment.
c.
wages increase as long as labor supply is upward sloping.
d.
wages decrease as long as labor demand is downward sloping.
26. Suppose that workers immigrate to Minnesota from Canada. Which of the following correctly describes what would
happen in the market for labor in Minnesota?
a.
The equilibrium wage would increase, and the quantity of labor would increase. With more workers, the added
output from an extra worker is larger.
b.
The equilibrium wage would decrease, and the quantity of labor would decrease. With fewer workers, the
added output from an extra worker is smaller.
c.
The equilibrium wage would decrease, and the quantity of labor would increase. With more workers, the
added output from an extra worker is smaller.
d.
The equilibrium wage would decrease, and the quantity of labor would increase. With more workers, the
added output from an extra worker is larger.
27. When a labor market experiences a surplus of labor, there is downward pressure on
a.
the supply of labor.
b.
the final product price.
c.
wages.
d.
the demand for labor.
28. An increase in the supply of labor has the effect of decreasing the
a.
wage.
b.
marginal product of labor.

c.
value of the marginal product of labor.
d.
All of the above are correct.
29. Consider the labor market for short-order cooks. An increase in immigration will cause
a.
both equilibrium wages and equilibrium employment to increase.
b.
both equilibrium wages and equilibrium employment to decrease.
c.
equilibrium wages to increase and equilibrium employment to decrease.
d.
equilibrium wages to decrease and equilibrium employment to increase.
30. Consider the labor market for short-order cooks. An increase in the wages paid to fast-food workers will cause
a.
both equilibrium wages and equilibrium employment to increase in the market for short-order cooks.
b.
both equilibrium wages and equilibrium employment to decrease in the market for short-order cooks.
c.
equilibrium wages to increase and equilibrium employment to decrease in the market for short-order cooks.
d.
equilibrium wages to decrease and equilibrium employment to increase in the market for short-order cooks.
31. Refer to Scenario 18-6. We would expect that, as a result of the contamination, the value of the marginal product for
Rocchetta Industries’ workers would
a.
be offset by a decrease in wages.
b.
be unaffected by a rise in demand for bottled water.
c.
increase.
d.
decrease.
32. Refer to Scenario 18-6. When the labor market adjusts to its new equilibrium, we would expect the
a.
marginal product of labor to be higher than it was before the increase in demand for bottled water.
b.
value of the marginal product of labor to be higher than it was before the increase in demand for bottled water.
c.
price of bottled water to be lower than it was before the increase in demand for bottled water.
d.
wages of Rocchetta workers to be lower than they were before the increase in demand for bottled water.
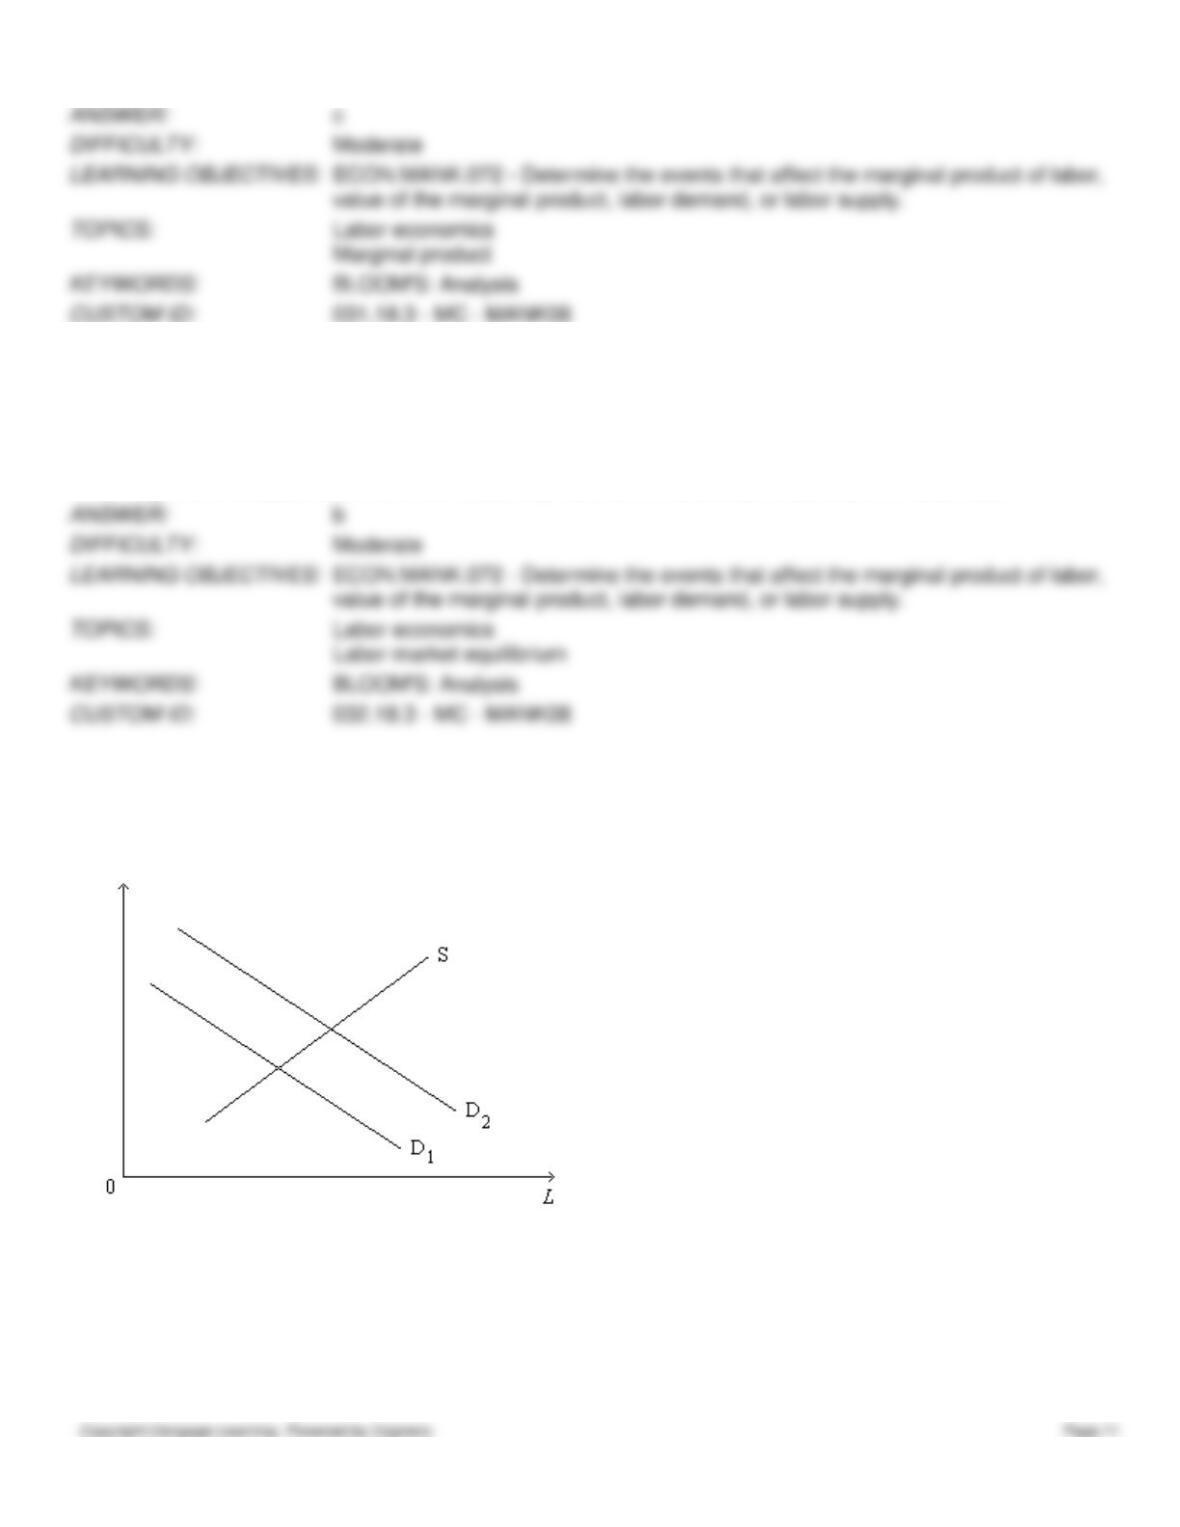
Figure 18-8
This figure below shows the labor market for automobile workers. The curve labeled S is the labor supply curve, and the
curves labeled D1 and D2 are the labor demand curves. On the horizontal axis, L represents the quantity of labor in the
market.
33. Refer to Figure 18–8. What is measured along the vertical axis on the graph?
a.
the quantity of automobiles produced
b.
the price of automobiles
c.
the wage paid to automobile workers
d.
time spent by workers producing automobiles

34. Refer to Figure 18–8. Which of the following is a possible explanation of the shift of the labor-demand curve from D1
to D2?
a.
The wage earned by automobile workers increased.
b.
The price of automobiles increased.
c.
The opportunity cost of leisure, as perceived by automobile workers, decreased.
d.
Large segments of the population changed their tastes regarding leisure versus work.
35. Refer to Figure 18–8. Which of the following events would most likely explain the shift of the labor-demand curve
from D1 to D2?
a.
The price of automobiles decreased.
b.
A large number of immigrants entered the automobile-worker market.
c.
A technological advance increased the marginal product of automobile workers.
d.
All of the above are correct.
36. Refer to Figure 18–8. Which of the following events would most likely explain a shift of the labor-demand curve
from D2 back to D1?
a.
The price of automobiles decreased.
b.
A large number of immigrants entered the automobile-worker market.
c.
A technological advance increased the marginal product of automobile workers.
d.
The demand for automobiles increased.
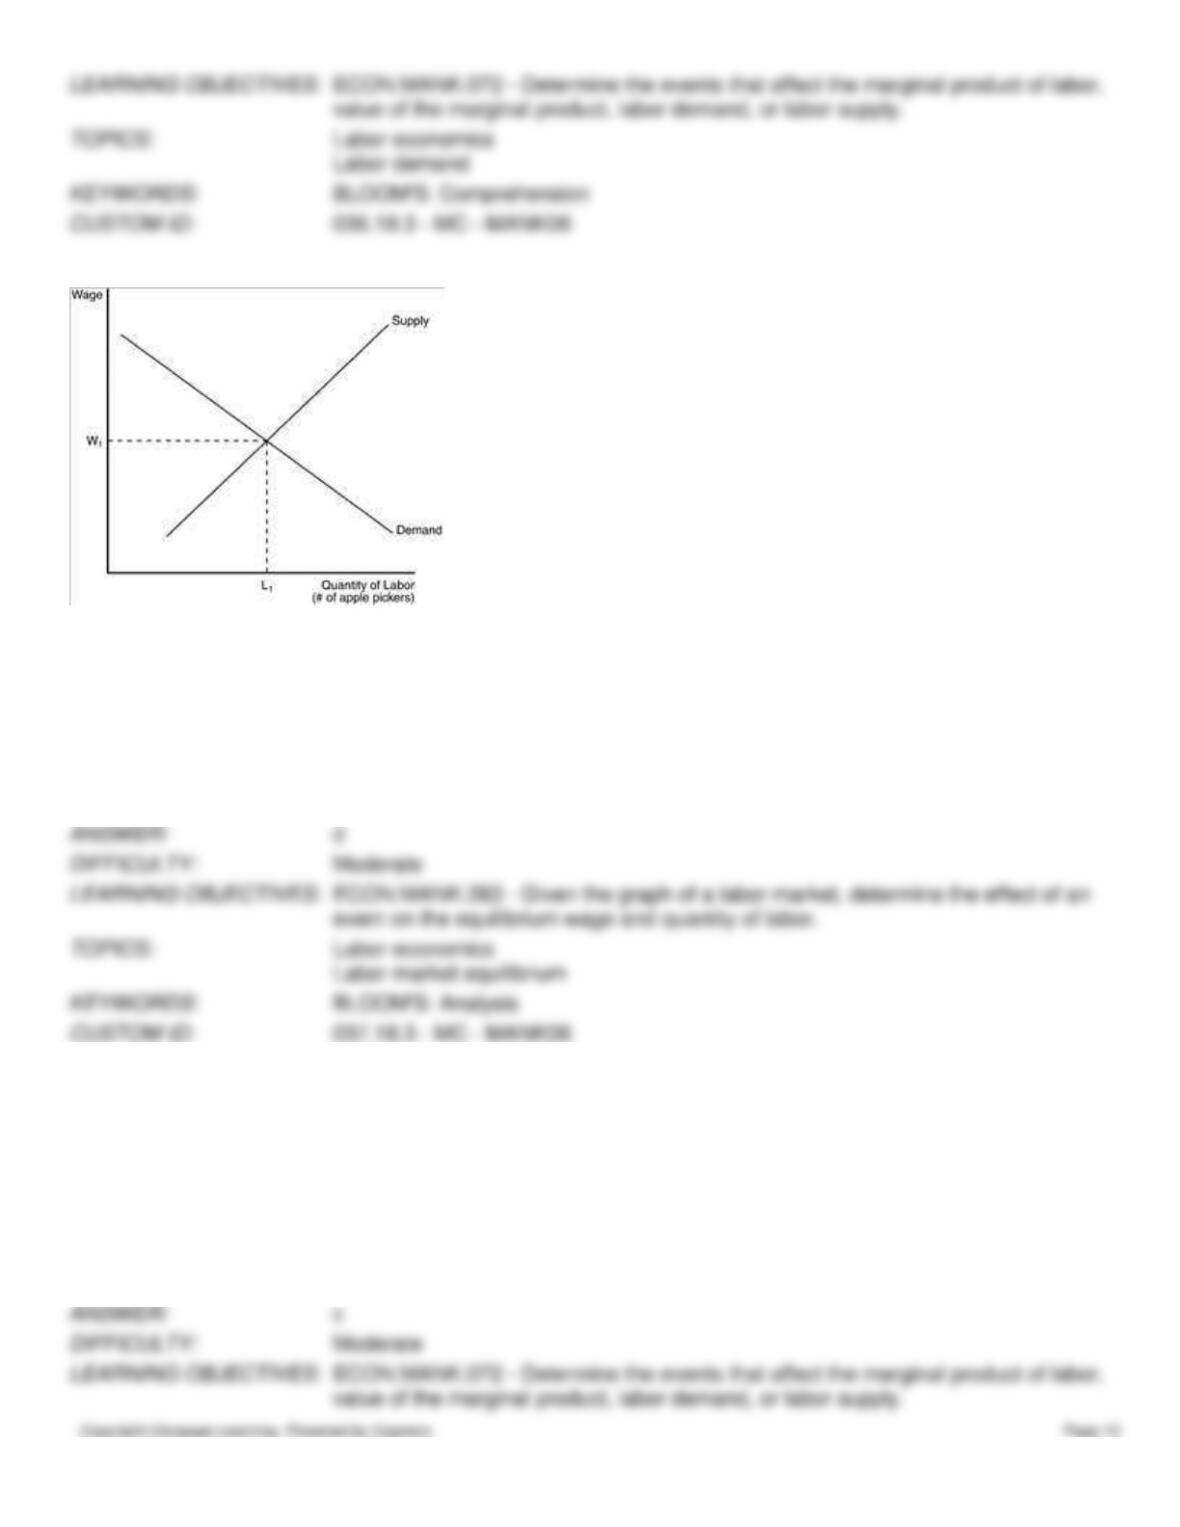
Figure 18-9
37. Refer to Figure 18-9. If the apple pickers start working fewer hours because they are taking more vacation time, the
equilibrium wage will
a.
fall below w1 due to a shift in demand.
b.
fall below w1 due to a shift in supply.
c.
rise above w1 due to a shift in demand.
d.
rise above w1 due to a shift in supply.
38. Refer to Figure 18-9. If the marginal product of labor falls and the price of apples remains unchanged,
(i)
the value of the marginal product of labor will fall.
(ii)
the quantity of labor demanded will increase above L1.
(iii)
the labor supply curve will remain unchanged.
a.
(i) and (ii) only
b.
(ii) and (iii) only
c.
(i) and (iii) only
d.
(i), (ii), and (iii)

39. Refer to Figure 18-9. If the price of apples increases, the
a.
demand for apple pickers will shift to the left.
b.
demand for apple pickers will shift to the right.
c.
supply of apple pickers will shift to the left.
d.
supply of apple pickers will shift to the right.
40. Refer to Figure 18-9. If the price of apples decreases, the
a.
demand for apple pickers will shift to the left.
b.
demand for apple pickers will shift to the right.
c.
supply of apple pickers will shift to the left.
d.
supply of apple pickers will shift to the right.
41. Refer to Figure 18-9. If the price of apples increases, the equilibrium wage will
a.
increase, and more apple pickers will be hired.
b.
decrease, and more apple pickers will be hired.
c.
increase, and fewer apple pickers will be hired.
d.
decrease, and fewer apple pickers will be hired.