
Chapter 18/The Market For the Factors of Production ❖ 41
183. Dan owns one of the many bakeries in New York City. Which of the following events will lead to an increase
in Dan’s demand for the services of bakers?
(i)
The price of muffins increases. (Muffins are Dan’s specialty.)
(ii)
Dan adds three new ovens to the kitchen area to help the bakers work faster.
(iii)
Local bakers form a union to protect themselves from low wages.
a.
(i) and (ii) only
b.
(ii) and (iii) only
c.
(i) and (iii) only
d.
(i), (ii), and (iii)
184. John owns a number of hot dog stands in New York City. He hires workers to sell hot dogs at his stands.
Which of the following events will lead to a decrease in John’s demand for hot dog vendors?
a.
Hollywood glamorization of a new movie about a hot dog vendor leads hundreds of high-school
students in New York City to apply for a job at John’s.
b.
The price of hot dogs falls.
c.
The local hot dog vendors form a union increasing hot dog vendor wages.
d.
The demand curve for hot dogs shifts to the right.
185. A sandwich shop hires workers to make sandwiches and sell them to customers. If the firm is competitive in
both the market for sandwiches and in the market for sandwich-makers, then it has
a.
some control over both the price of sandwiches and the wage it pays to its workers.
b.
no control over the price of sandwiches but some control over the wage it pays to its workers.
c.
some control over the price of sandwiches but no control over the wage it pays to its workers.
d.
no control over either the price of sandwiches or the wage it pays to its workers.
186. Which of the following events could increase the demand for labor?
a.
A decrease in output price
b.
A decrease in the amount of capital available for workers to use
c.
An increase in the marginal productivity of workers
d.
A decrease in the wage paid to workers
187. Which of the following events could decrease the demand for labor?
a.
An increase in the number of migrant workers
b.
An increase in the marginal productivity of workers
c.
A decrease in demand for the final product produced by labor
d.
A decrease in the supply of labor

42 ❖ Chapter 18/The Market For the Factors of Production
188. When we focus on the firm as a supplier of a good or a service, we assume that the firm is a profit maximizer.
When we focus on the firm as a demander of labor, we assume that the firm’s objective is to
a.
minimize wages.
b.
minimize variable costs.
c.
maximize the number of workers hired.
d.
maximize profit.
189. Suppose that a new invention increases the marginal productivity of labor, shifting labor demand to the right.
Such an invention would be an example of
a.
labor-saving technology.
b.
labor-augmenting technology.
c.
Luddite technology.
d.
supply-shifting technology.
190. Suppose that a new invention decreases the marginal productivity of labor, shifting labor demand to the left.
Such an invention would be an example of
a.
labor-saving technology.
b.
labor-augmenting technology.
c.
Luddite technology.
d.
supply-shifting technology.
191. Labor-saving technology causes which of the following?
(i)
The marginal productivity of labor increases.
(ii)
The marginal productivity of labor decreases.
(iii)
Labor demand shifts to the right.
(iv)
Labor demand shifts to the left.
a.
(i) only
b.
(ii) only
c.
(i) and (iii) only
d.
(ii) and (iv) only
192. Labor-augmenting technology causes which of the following?
(i)
The marginal productivity of labor increases.
(ii)
The marginal productivity of labor decreases.
(iii)
Labor demand shifts to the right.
(iv)
Labor demand shifts to the left.
a.
(i) only
b.
(ii) only
c.
(i) and (iii) only
d.
(ii) and (iv) only
Chapter 18/The Market For the Factors of Production ❖ 43
193. The term Luddite is used to describe
a.
a person who readily adopts the latest technological advances.
b.
a person who is opposed to a reduction in the number of immigrants that are allowed into the
country each year.
c.
a person who opposes technological advance.
d.
any mythical historical figure.
194. A Luddite would be expected to oppose
a.
working more than eight hours per day.
b.
technological advance.
c.
national policies that limit immigration into the country.
d.
the use of economic models to demonstrate market equilibrium.
195. For a competitive, profit-maximizing firm, the demand curve for labor will shift in response to a change in the
a.
wage rate.
b.
quantity of labor demanded.
c.
price of the product that the firm sells.
d.
an increase in the supply of labor.
196. Suppose a labor-augmenting technology were developed for a product that increased the marginal product of
labor for all workers. Which of the following would happen in the labor market for this product?
a.
Demand would decrease.
b.
Demand would increase.
c.
Supply would decrease.
d.
Supply would increase.
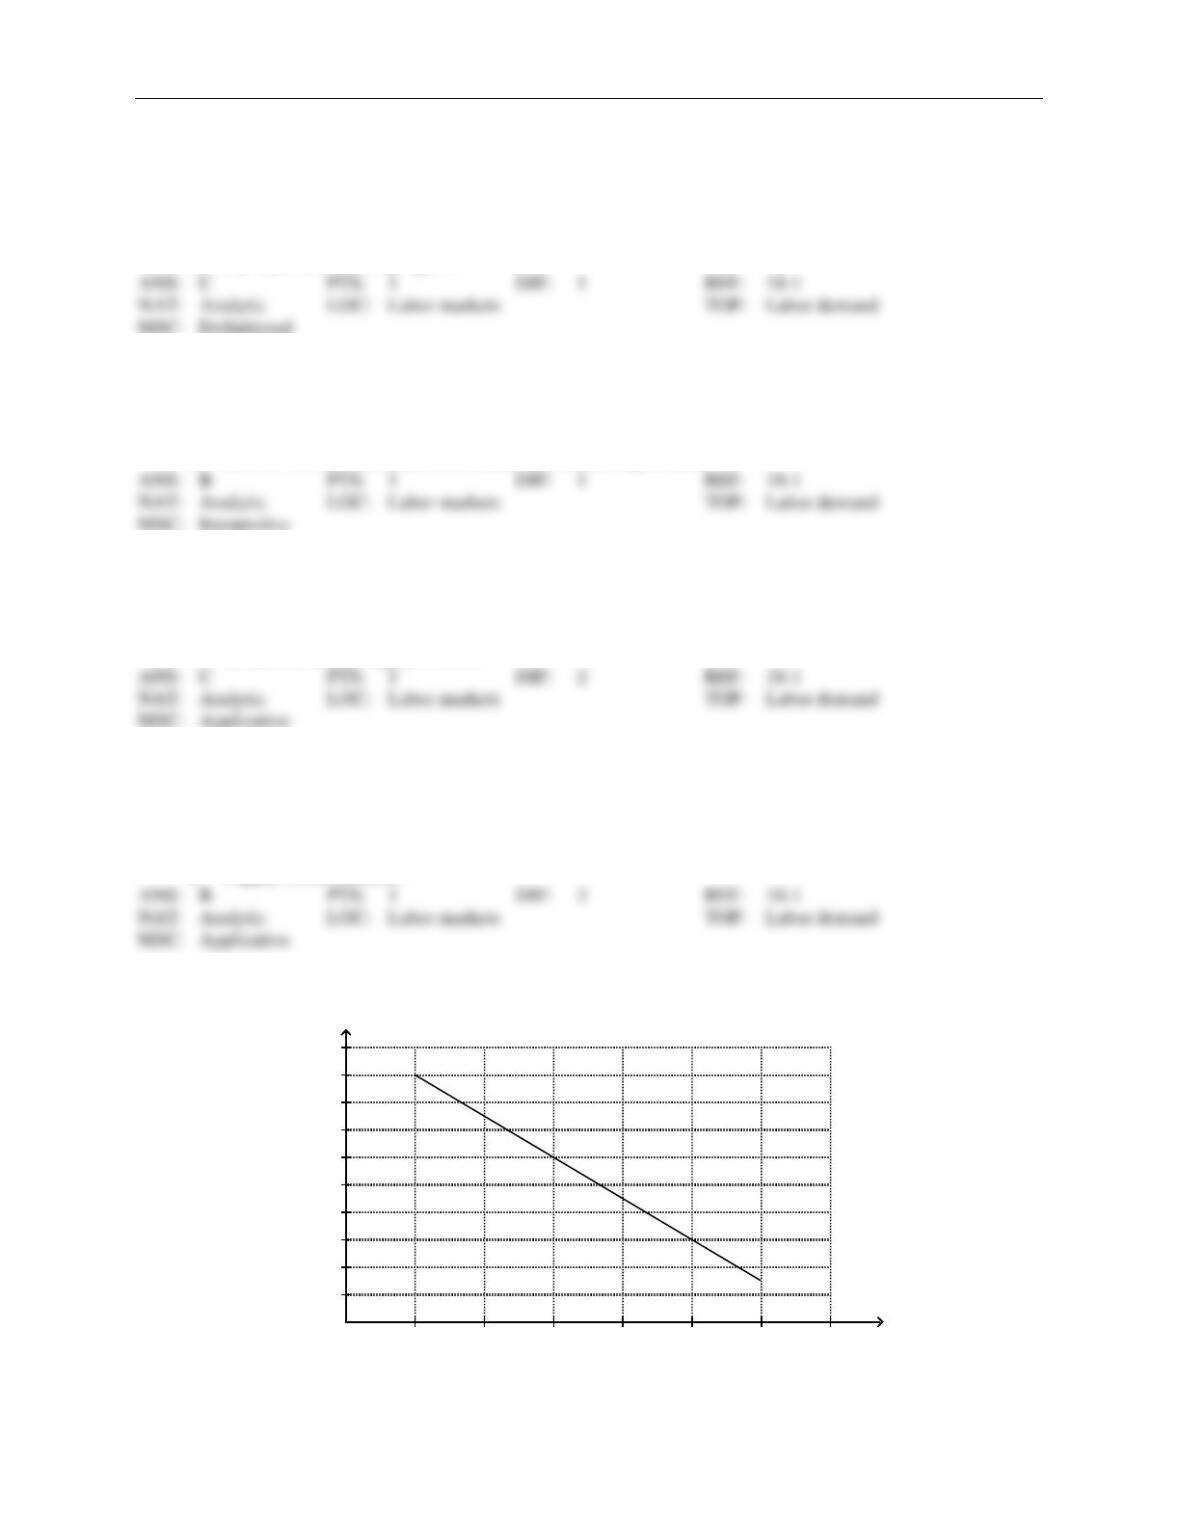
Figure 18-5
The figure shows a particular profit–maximizing, competitive firm’s value–of-marginal-product (VMP) curve.
On the horizontal axis, L represents the number of workers. The time frame is daily.
VMP
1 2 3 4 5 6 7 L
40
80
120
160
200
240
280
320
360
400 VMP

44 ❖ Chapter 18/The Market For the Factors of Production
197. Refer to Figure 18-5. The value-of–marginal-product curve that is drawn could be relabeled as the firm’s
a.
production function.
b.
total revenue curve.
c.
labor supply curve.
d.
labor demand curve.
198. Refer to Figure 18-5. The firm would choose to hire three workers if
a.
the market wage for a day’s work is $220.
b.
the market wage for a day’s work is $260.
c.
the output price is $220.
d.
the output price is $260.
199. Refer to Figure 18-5. Suppose the marginal product of the fifth unit of labor is 30 units of output per day.
The figure implies that the
a.
price of output is $4.
b.
price of output is $6.
c.
price of output is $8.
d.
daily wage is $120.
200. Refer to Figure 18-5. Suppose one point on the firm’s production function is
(L = 3, Q = 180), where L = number of workers and Q = quantity of output. If the firm sells its output for $5
per unit, then
a.
a second point on the firm’s production function is (L = 4, Q = 216).
b.
the firm’s production function exhibits the property of diminishing marginal product of labor.
c.
the firm will maximize profit by hiring four workers if it pays workers $160 per day.
d.
All of the above are correct.
201. Refer to Figure 18-5. Assume that two points on the firm’s production function are (L = 2, Q = 180) and (L
= 3, Q = 228), where L = number of workers and Q = quantity of output. The firm pays its workers $120 per
day. The firm’s non-labor costs are fixed, and they amount to $250 per day. We can conclude that
a.
the firm sells its output for $12 per unit.
b.
if the firm is currently employing 2 workers per day, then profit could be increased by $48 per day
if a third worker is hired.
c.
the marginal cost per unit of output is $2.50 when output is increased from 180 units per day to 228
units per day.
d.
the firm’s maximum profit occurs when it hires 3 workers per day.

Chapter 18/The Market For the Factors of Production ❖ 45
THE SUPPLY OF LABOR
1. The labor supply curve is fundamentally a representation of the trade-off people face between which of the
following?
a.
work and wages
b.
work and leisure
c.
wages and productivity
d.
technology and wages
2. For a worker, the opportunity cost of an hour of leisure
a.
rises by $5 when her wage rises by $5 per hour.
b.
falls by $5 when her wage rises by $5 per hour.
c.
is the same for a corporate chief executive officer as it is for a garbage-collection worker.
d.
is determined by factors that are unrelated to her hourly wage.
3. Fiona’s hourly wage increases from $8 to $10. Which of the following describes a consequence of the increase
in Fiona’s wage?
a.
The opportunity cost of Fiona’s leisure time has decreased.
b.
Fiona may choose to work fewer hours due to the increase in her wage.
c.
If Fiona’s labor supply curve is upward sloping, she will choose to work fewer hours.
d.
Both a and b are correct.
4. Wendy’s hourly wage decreases from $15 to $12. Which of the following describes a consequence of the de-
crease in Wendy‘s wage?
a.
The opportunity cost of Wendy’s leisure time has decreased.
b.
Wendy may choose to work more hours due to the decrease in her wage.
c.
Wendy may choose to work fewer hours due to the decrease in her wage.
d.
All of the above are correct.
Scenario 18-3
Sam has two jobs, one for the winter and one for the summer. In the winter, he works as a lift attendant at a ski
resort where he earns $11 per hour. During the summer, he drives a tour bus around the ski resort, earning $13
per hour.
5. Refer to Scenario 18–3. During the winter months, what is Sam’s opportunity cost of taking an hour off work
to go skiing?
a.
$13
b.
between $11 and $12
c.
$11
d.
less than $11

46 ❖ Chapter 18/The Market For the Factors of Production
6. Refer to Scenario 18–3. During the summer months, what is Sam’s opportunity cost of taking an hour off
work to go hiking?
a.
$13
b.
between $11 and $12
c.
$11
d.
less than $11
7. Refer to Scenario 18–3. Assume that Sam has an upward-sloping labor supply curve. If the opportunity cost
of Sam’s leisure time increases, he will respond by working
a.
more hours.
b.
fewer hours.
c.
an equal number of hours.
d.
a number of hours that cannot be determined from the information. The labor demand curve is
needed to make this determination.
8. Refer to Scenario 18–3. If Sam takes fewer hours of leisure in the summer than in the winter, we can assume
that his labor supply curve is
a.
horizontal.
b.
vertical.
c.
upward sloping.
d.
backward sloping.
9. Refer to Scenario 18–3. If Sam takes fewer hours of leisure in the winter than in the summer, we can assume
that his labor supply curve
a.
is horizontal.
b.
is vertical.
c.
is entirely upward sloping.
d.
has a backward-sloping portion.
10. Your best friend receives a pay raise at her part-time job from $8 to $10 per hour. She used to work 20 hours
per week, but now she decides to work 16 hours per week in order to spend more time studying economics.
For this price range, her labor supply curve is
a.
vertical.
b.
horizontal.
c.
upward sloping.
d.
backward sloping.

Chapter 18/The Market For the Factors of Production ❖ 47
11. Your best friend receives a pay raise at her part-time job from $8 to $10 per hour. She used to work 16 hours
per week, but now she decides to work 20 hours per week. For this price range, her labor supply curve is
a.
vertical.
b.
horizontal.
c.
upward sloping.
d.
backward sloping.
12. José receives a pay raise at his part-time job from $9 to $11 per hour. He used to work 12 hours per week, but
now he decides to work 15 hours per week. For this price range, his labor supply curve is
a.
vertical.
b.
horizontal.
c.
upward sloping.
d.
backward sloping.
13. An upward-sloping labor supply curve means that
a.
workers prefer to buy more leisure time when their incomes increase.
b.
workers prefer to supply less labor when wages are high.
c.
an increase in the opportunity cost of leisure leads workers to increase the quantity of labor they
supply.
d.
All of the above are correct.
14. If a worker respond to an increase in the opportunity cost of leisure by taking less leisure, then his labor supply
curve is
a.
horizontal.
b.
vertical.
c.
backward sloping.
d.
upward sloping.
15. If a worker respond to an increase in the opportunity cost of leisure by taking more leisure, then her labor sup-
ply curve is
a.
upward sloping.
b.
backward sloping.
c.
horizontal.
d.
vertical.

48 ❖ Chapter 18/The Market For the Factors of Production
16. A household member’s decision about how much labor to supply is most closely linked to
a.
the supply of factors of production other than labor.
b.
technological change.
c.
the tradeoff between leisure and work.
d.
immigration trends.
17. Among the people who are characterized below, who has the highest opportunity cost of leisure?
a.
an attorney who earns $200 per hour and who plays golf during her leisure time
b.
a medical doctor who earns $210 per hour and who sleeps during his leisure time
c.
a retail clerk who earns $15 per hour and who watches TV during her leisure time
d.
a waiter who earns $12 per hour and who reads poetry during his leisure time
18. The labor supply curve reflects how
a.
workers’ decisions about the labor-leisure tradeoff respond to a change in the wage.
b.
workers’ decisions about the opportunity cost of labor respond to a change in the quantity of labor
supplied.
c.
firms’ decisions about the labor-leisure tradeoff respond to the quantity of labor demanded.
d.
firms’ decisions about how the quantity of labor they hire respond to changes in their opportunities
to earn profits.
19. If Ernie’s individual labor supply curve is upward sloping, then Ernie responds to an increase in the
a.
wage by working more hours per week.
b.
opportunity cost of leisure by working fewer hours per week.
c.
opportunity cost of leisure by taking more hours of leisure per week.
d.
Both a and b are correct.
20. Which of the following statements is correct? An individual worker‘s labor supply curve
a.
can never be backward sloping.
b.
slopes backward if that person responds to a higher wage by taking fewer hours of leisure per week.
c.
slopes backward if that person responds to a higher opportunity cost of leisure by working fewer
hours per week.
d.
slopes upward if that person works the same number of hours per week, regardless of the
opportunity cost of leisure.
21. If the wages of a dentist increase,
a.
so does her opportunity cost of leisure.
b.
her hours of labor supplied may increase.
c.
her hours of labor supplied may decrease.
d.
All of the above are correct.

Chapter 18/The Market For the Factors of Production ❖ 49
Figure 18-6
22. Refer to Figure 18-6. The graph above illustrates the market for bakers who make homemade breads and
breakfast pastries. If the bakery profession becomes more attractive to young women and men because of a
new reality television show, what happens in the market for bakers?
a.
Demand increases from D1 to D2.
b.
Demand decreases from D2 to D1.
c.
Supply increases from S1 to S2.
d.
Supply decreases from S2 to S1.
23. Refer to Figure 18-6. The graph above illustrates the market for bakers who make homemade breads and
breakfast pastries. If the bakery profession becomes less attractive to young women and men because of news
reports documenting health risks, what happens in the market for bakers?
a.
Demand increases from D1 to D2.
b.
Demand decreases from D2 to D1.
c.
Supply increases from S1 to S2.
d.
Supply decreases from S2 to S1.
24. Refer to Figure 18-6. The graph above illustrates the market for bakers who make homemade breads and
breakfast pastries. If the wages paid to wedding cake bakers increase, what happens in the market for bread
bakers?
a.
Demand increases from D1 to D2.
b.
Demand decreases from D2 to D1.
c.
Supply increases from S1 to S2.
d.
Supply decreases from S2 to S1.
D1 D2
S1 S2
Quantity
W age

50 ❖ Chapter 18/The Market For the Factors of Production
25. Refer to Figure 18-6. The graph above illustrates the market for bakers who make homemade breads and
breakfast pastries. If the wages paid to wedding cake bakers decrease, what happens in the market for bread
bakers?
a.
Demand increases from D1 to D2.
b.
Demand decreases from D2 to D1.
c.
Supply increases from S1 to S2.
d.
Supply decreases from S2 to S1.
26. Refer to Figure 18-6. The graph above illustrates the market for bakers who make homemade breads and
breakfast pastries in Northern Minnesota. If Northern Minnesota experiences an increase in immigration from
Canada, what happens in the market for bakers?
a.
Demand increases from D1 to D2.
b.
Demand decreases from D2 to D1.
c.
Supply increases from S1 to S2.
d.
Supply decreases from S2 to S1.
27. Which of the following would shift a market labor supply curve to the right?
a.
an increase in the price of output
b.
an increase in immigration
c.
a labor-saving technological change
d.
a decrease in the wage rate
28. Which of the following would not shift a market labor supply curve to the right?
a.
a decrease in the wage paid to workers in a competing market
b.
labor-augmenting technology
c.
a change in worker tastes so that workers want to retire later
d.
an increase in immigration
29. Which of the following would shift a market labor supply curve to the left?
a.
a decrease in the price of output
b.
an increase in the price of output
c.
a labor-augmenting technological change
d.
better employment opportunities in a closely-related job
30. Which of the following would shift a market labor supply curve to the left?
a.
an increase in the wage paid to workers in a competing market
b.
labor-saving technology
c.
a change in worker tastes so that workers want to retire later
d.
an increase in immigration

Chapter 18/The Market For the Factors of Production ❖ 51
31. Immigration is an important
a.
explanation for the failure of firms to operate on their labor-demand curves.
b.
explanation for the failure of firms to operate on their output-supply curves.
c.
source of shifts in labor demand.
d.
source of shifts in labor supply.
32. Which of the following events would shift the labor supply curve?
a.
changes in the number of women willing to work
b.
immigration of workers
c.
changing attitudes towards work
d.
All of the above are correct.
33. Which of the following events would shift a labor supply curve?
(i)
immigration of high-skilled workers
(ii)
immigration of low-skilled workers
(iii)
changes in the number of women willing to work full time
a.
(i) and (iii) only
b.
(ii) and (iii) only
c.
(iii) only
d.
(i), (ii), and (iii)
34. The labor supply curve shifts when
a.
employers need to hire more people.
b.
employers develop new technology.
c.
workers change the number of hours that they want to work at any given wage.
d.
workers become more productive.
35. What happens to labor supply in the pear-picking market when the wage paid to apple pickers increases?
a.
The labor supply will stay unchanged until the wages paid to pear pickers change.
b.
The labor supply will decrease.
c.
The labor supply will increase.
d.
The labor supply may fall or rise, depending on the price of pears.
36. Suppose that the wage paid to workers who detassel corn rises. What happens in the market for workers who
weed soybean fields, given that workers who detassel corn can easily work weeding soybean fields?
a.
The demand curve for soybean workers increases.
b.
The demand curve for soybean workers decreases.
c.
The supply curve for soybean workers increases.
d.
The supply curve for soybean workers decreases.

52 ❖ Chapter 18/The Market For the Factors of Production
37. What happens to the labor supply curves in both countries when Mexican workers leave Mexico and move to
the United States?
a.
Labor supply decreases in Mexico and decreases in the United States.
b.
Labor supply increases in the United States and increases in Mexico.
c.
Labor supply increases in the United States and decreases in Mexico.
d.
Labor supply increases in Mexico and decreases in United States.
38. Immigration of workers into the United States is often an important source of
a.
increases in the demand for labor in the United States.
b.
decreases in the demand for labor in the United States.
c.
increases in the supply of labor in the United States.
d.
decreases in the supply of labor in the United States.
39. Which of the following events would lead to an increase in the supply of labor?
a.
The price of a firm’s product increases.
b.
A country experiences an increase in immigrant labor.
c.
The development of a new labor-augmenting technology.
d.
All of the above are correct.
40. When the wages paid to government economists increase, the labor supply curve for academic economists
a.
shifts to the left.
b.
shifts to the right.
c.
will become backward-sloping.
d.
will not change.
41. Which of the following could increase the labor-supply curve for computer-repair technicians?
a.
an increase in the wages paid to computer–repair technicians
b.
an increase in immigration
c.
a change in the work preferences of men, with more of them preferring to be stay–at-home fathers
d.
an increase in the wages paid to television-repair technicians
42. Which of the following could decrease the labor-supply curve for teachers?
a.
a decrease in the wages paid to teachers
b.
an increase in immigration
c.
a change in the work preferences of men, with more of them preferring to be stay–at-home fathers
d.
any factor that would decrease the labor-demand curve

Chapter 18/The Market For the Factors of Production ❖ 53
43. Which of the following could increase the supply of labor in the market for cranberry pickers?
(i)
a change in the preferences of women toward full-time work
(ii)
an increase in the output price
(iii)
an increase in the wages paid to apple pickers
(iv)
a decrease in the wages paid to apple pickers
a.
(ii) only
b.
(i), (ii), and (iv) only
c.
(i) and (iv) only
d.
(ii) and (iii) only
EQUILIBRIUM IN THE LABOR MARKET
1. In a representative labor market,
a.
the wage adjusts to balance the supply and demand for labor.
b.
the wage equals the value of the marginal product of labor.
c.
an increase in the supply of labor increases the equilibrium wage.
d.
Both a and b are correct.
2. Which of the following is correct?
a.
Any event that changes the supply or demand for labor must change the value of the marginal
product.
b.
A profit-maximizing firm hires workers so long as the wage rate exceeds the value of the marginal
product of labor.
c.
An increase in the supply of labor increases both employment and wages.
d.
A decrease in the demand for labor decreases wages but increases employment.
3. Which of the following is not correct?
a.
In a labor market, the wage adjusts to balance the supply and demand for labor.
b.
A profit-maximizing firm hires workers so long as the wage rate exceeds the value of the marginal
product of labor.
c.
Any event that changes the supply or demand for labor must change the equilibrium wage.
d.
Any event that changes the supply or demand for labor must change the value of the marginal
product.
Scenario 18-4
In 1997, Albania experienced a civil war. The civil unrest sent thousands of refugees across the Adriatic Sea to
Italy where they sought relief from the fighting.
4. Refer to Scenario 18–4. The Albanian civil war probably affected Italian labor markets by causing
a.
total employment in Italy to decrease.
b.
wages in Italy to increase.
c.
the marginal product of labor in Italy to decrease.
d.
All of the above are correct.
54 ❖ Chapter 18/The Market For the Factors of Production
5. Refer to Scenario 18–4. The Italian government started to patrol the Adriatic Sea and had a policy of return-
ing all refugees to Albania. This policy would contribute to
a.
an increase in the supply of labor in Italy.
b.
an increase in the demand labor in Italy.
c.
a decrease in the demand for labor in Italy.
d.
preventing an increase in the supply of labor in Italy.
Scenario 18-5
Suppose that workers from northern Minnesota, North Dakota, and Montana decide to emigrate to southern
Canada.
6. Refer to Scenario 18–5. In the labor market in southern Canada, the equilibrium wage
a.
and the equilibrium quantity of labor will rise.
b.
and the equilibrium quantity of labor will fall.
c.
will rise, and the equilibrium quantity of labor will fall.
d.
will fall, and the equilibrium quantity of labor will rise.
7. Refer to Scenario 18–5. In the labor market in the northern United States, the equilibrium wage
a.
and the equilibrium quantity of labor will rise.
b.
and the equilibrium quantity of labor will fall.
c.
will rise, and the equilibrium quantity of labor will fall.
d.
will fall, and the equilibrium quantity of labor will rise.
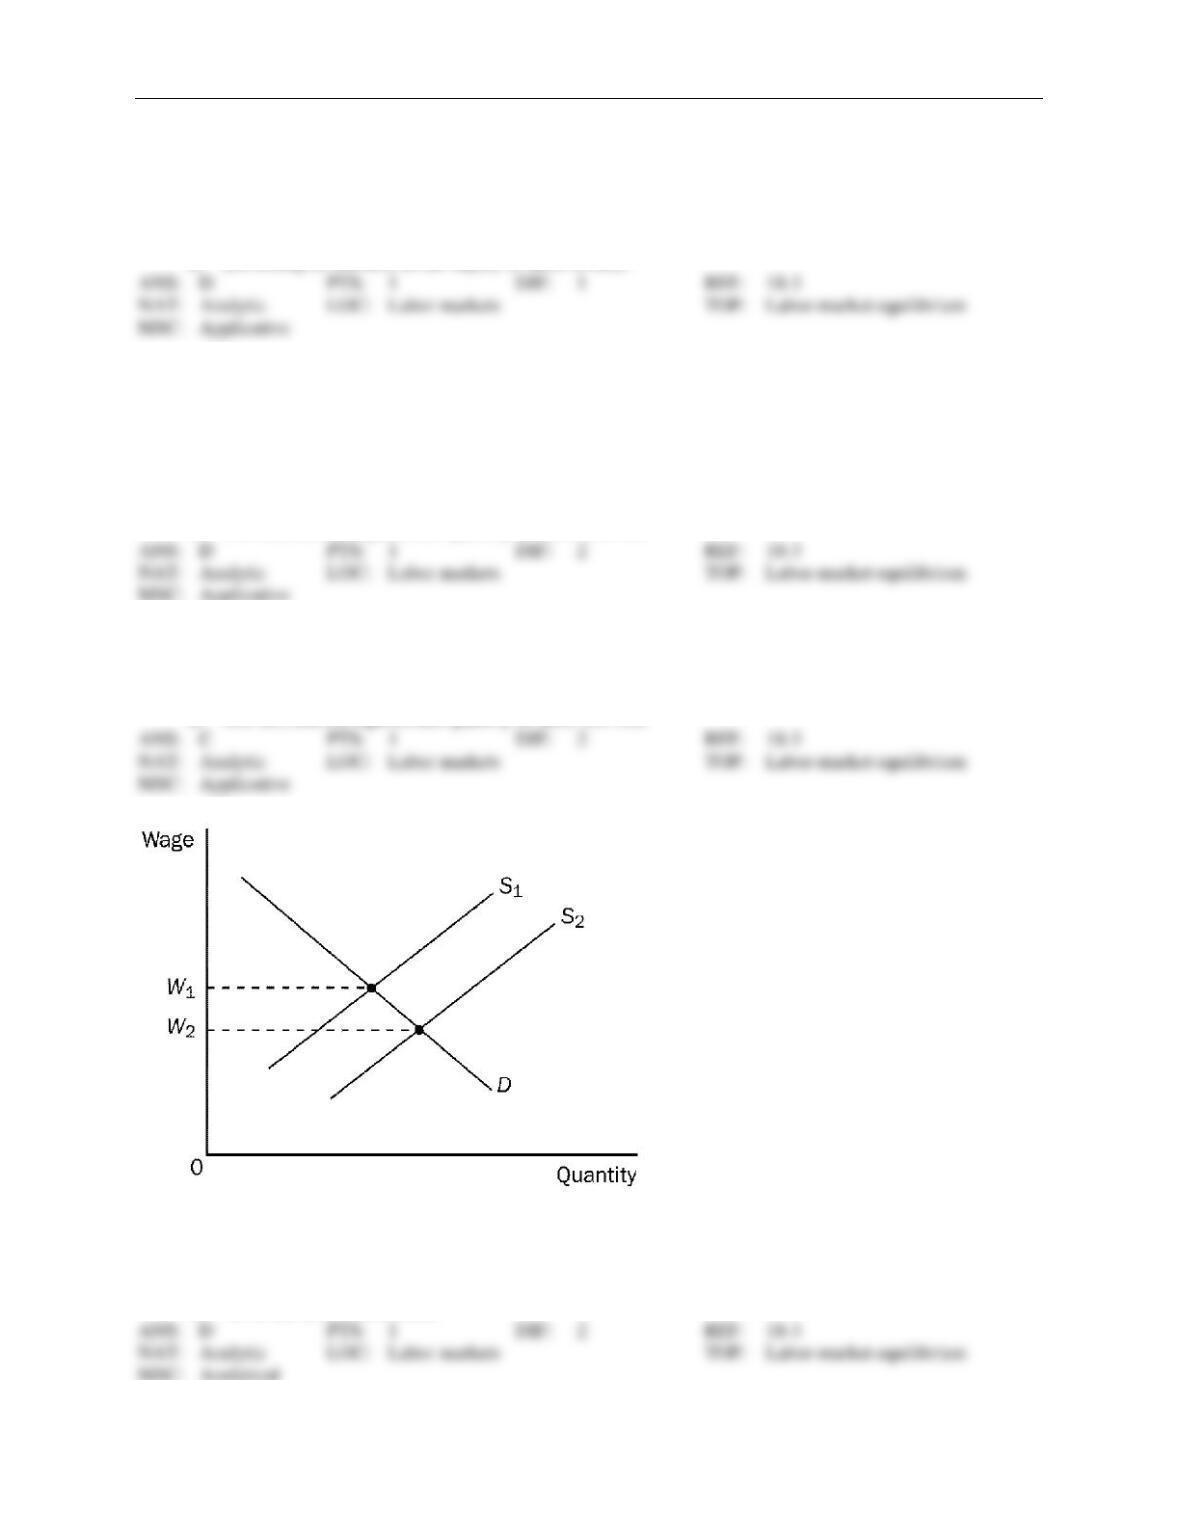
Figure 18-7
8. Refer to Figure 18-7. When the relevant labor supply curve is S1, and the labor market is in equilibrium, the
a.
wage is W1.
b.
opportunity cost of leisure to workers is W1.
c.
value of the marginal product of labor to firms is W1.
d.
All of the above are correct.

Chapter 18/The Market For the Factors of Production ❖ 55
9. Refer to Figure 18-7. Which of the following would shift the labor supply curve from S1 to S2?
a.
technological progress
b.
a decrease in the price of the firm’s output
c.
a change in workers’ attitudes toward the work-leisure tradeoff
d.
an increase in the price of the firm’s output
10. Refer to Figure 18-7. Which of the following would shift the labor supply curve from S1 to S2?
a.
a change in workers’ attitudes toward the work-leisure tradeoff
b.
decreases in wages in other labor markets
c.
immigration of workers into the region or country
d.
All of the above are correct.
11. Refer to Figure 18-7. If the relevant labor supply curve is S2 and the current wage is W1,
a.
there is a surplus of labor.
b.
the quantity of labor demanded exceeds the quantity of labor supplied.
c.
an increase in the minimum wage could restore equilibrium in the market.
d.
firms will need to raise the wage to restore equilibrium.
12. Refer to Figure 18-7. Assume W1 = $20 and W2 = $18, and the market is always in equilibrium. A shift of the
labor supply curve from S1 to S2 would
a.
increase the value of the marginal product of labor by $2.
b.
decrease the value of the marginal product of labor by $2.
c.
decrease the value of the marginal product of labor by more than $2.
d.
not change the value of the marginal product of labor.
13. Suppose that the market for labor is initially in equilibrium. An increase in immigration will cause the equilib-
rium wage
a.
and the equilibrium quantity of labor to rise.
b.
and the equilibrium quantity of labor to fall.
c.
to rise and the equilibrium quantity of labor to fall.
d.
to fall and the equilibrium quantity of labor to rise.
14. Suppose that the market for labor is initially in equilibrium. Suppose that workers’ tastes change so that they
choose to retire at age 55 rather than age 67. Then the equilibrium wage
a.
and the equilibrium quantity of labor will rise.
b.
and the equilibrium quantity of labor will fall.
c.
will rise, and the equilibrium quantity of labor will fall.
d.
will fall, and the equilibrium quantity of labor will rise.

56 ❖ Chapter 18/The Market For the Factors of Production
15. Consider the market for university economics professors. Suppose the opportunity cost of going to graduate
school to get a Ph.D. in economics decreases for many individuals. Suppose it generally takes about five years
to get a Ph.D. in economics. Holding all else constant, in five years the equilibrium wage for university eco-
nomics professors will
a.
increase.
b.
decrease.
c.
not change.
d.
It is not possible to determine what will happen to the equilibrium wage.
16. Consider the market for medical doctors. Suppose the opportunity cost of going to medical school decreases
for many individuals. Suppose it generally takes about ten years to become a practicing doctor. Holding all
else constant, in ten years the equilibrium wage for doctors will
a.
increase.
b.
decrease.
c.
not change.
d.
It is not possible to determine what will happen to the equilibrium wage.
17. Consider the market for university economics professors. Suppose the opportunity cost of going to graduate
school to get a Ph.D. in economics decreases for many individuals. Suppose it generally takes about five years
to get a Ph.D. in economics. Holding all else constant, in five years the equilibrium quantity of university eco–
nomics professors will
a.
increase.
b.
decrease.
c.
not change.
d.
It is not possible to determine what will happen to the equilibrium quantity.
18. Consider the market for medical doctors. Suppose the opportunity cost of going to medical school decreases
for many individuals. Suppose it generally takes about ten years to become a practicing doctor. Holding all
else constant, in ten years the equilibrium quantity of doctors will
a.
increase.
b.
decrease.
c.
not change.
d.
It is not possible to determine what will happen to the equilibrium quantity.
19. When labor supply increases,
a.
the marginal productivity of workers always increases.
b.
profit-maximizing firms reduce employment.
c.
wages increase as long as labor supply is upward sloping.
d.
wages decrease as long as labor demand is downward sloping.

Chapter 18/The Market For the Factors of Production ❖ 57
20. Suppose that workers immigrate to Minnesota from Canada. Which of the following correctly describes what
would happen in the market for labor in Minnesota?
a.
The equilibrium wage would increase, and the quantity of labor would increase. With more
workers, the added output from an extra worker is larger.
b.
The equilibrium wage would decrease, and the quantity of labor would decrease. With fewer
workers, the added output from an extra worker is smaller.
c.
The equilibrium wage would decrease, and the quantity of labor would increase. With more
workers, the added output from an extra worker is smaller.
d.
The equilibrium wage would decrease, and the quantity of labor would increase. With more
workers, the added output from an extra worker is larger.
21. When a labor market experiences a surplus of labor, there is downward pressure on
a.
the supply of labor.
b.
the final product price.
c.
wages.
d.
the demand for labor.
22. An increase in the supply of labor has the effect of decreasing the
a.
wage.
b.
marginal product of labor.
c.
value of the marginal product of labor.
d.
All of the above are correct.
23. Consider the labor market for short-order cooks. An increase in immigration will cause
a.
both equilibrium wages and equilibrium employment to increase.
b.
both equilibrium wages and equilibrium employment to decrease.
c.
equilibrium wages to increase and equilibrium employment to decrease.
d.
equilibrium wages to decrease and equilibrium employment to increase.
24. Consider the labor market for short-order cooks. An increase in the wages paid to fast-food workers will cause
a.
both equilibrium wages and equilibrium employment to increase in the market for short–order
cooks.
b.
both equilibrium wages and equilibrium employment to decrease in the market for short-order
cooks.
c.
equilibrium wages to increase and equilibrium employment to decrease in the market for short–
order cooks.
d.
equilibrium wages to decrease and equilibrium employment to increase in the market for short–
order cooks.
Scenario 18-6
Rocchetta Industries manufactures and supplies bottled water in Mexico. As a result of a contamination of
water supplies at many of Mexico’s resort communities, the demand for bottled water has increased.

58 ❖ Chapter 18/The Market For the Factors of Production
25. Refer to Scenario 18-6. We would expect that, as a result of the contamination, the value of the marginal
product for Rocchetta Industries’ workers would
a.
be offset by a decrease in wages.
b.
be unaffected by a rise in demand for bottled water.
c.
increase.
d.
decrease.
26. Refer to Scenario 18-6. When the labor market adjusts to its new equilibrium, we would expect the
a.
marginal product of labor to be higher than it was before the increase in demand for bottled water.
b.
value of the marginal product of labor to be higher than it was before the increase in demand for
bottled water.
c.
price of bottled water to be lower than it was before the increase in demand for bottled water.
d.
wages of Rocchetta workers to be lower than they were before the increase in demand for bottled
water.
MSC: Analytical
Figure 18-8
This figure below shows the labor market for automobile workers. The curve labeled S is the labor supply
curve, and the curves labeled D1 and D2 are the labor demand curves. On the horizontal axis, L represents the
quantity of labor in the market.
27. Refer to Figure 18-8. What is measured along the vertical axis on the graph?
a.
the quantity of automobiles produced
b.
the price of automobiles
c.
the wage paid to automobile workers
d.
time spent by workers producing automobiles
D
D
S
0
1
2
L
Chapter 18/The Market For the Factors of Production ❖ 59
28. Refer to Figure 18-8. Which of the following is a possible explanation of the shift of the labor-demand curve
from D1 to D2?
a.
The wage earned by automobile workers increased.
b.
The price of automobiles increased.
c.
The opportunity cost of leisure, as perceived by automobile workers, decreased.
d.
Large segments of the population changed their tastes regarding leisure versus work.
29. Refer to Figure 18-8. Which of the following events would most likely explain the shift of the labor-demand
curve from D1 to D2?
a.
The price of automobiles decreased.
b.
A large number of immigrants entered the automobile-worker market.
c.
A technological advance increased the marginal product of automobile workers.
d.
All of the above are correct.
30. Refer to Figure 18-8. Which of the following events would most likely explain a shift of the labor-demand
curve from D2 back to D1?
a.
The price of automobiles decreased.
b.
A large number of immigrants entered the automobile-worker market.
c.
A technological advance increased the marginal product of automobile workers.
d.
The demand for automobiles increased.
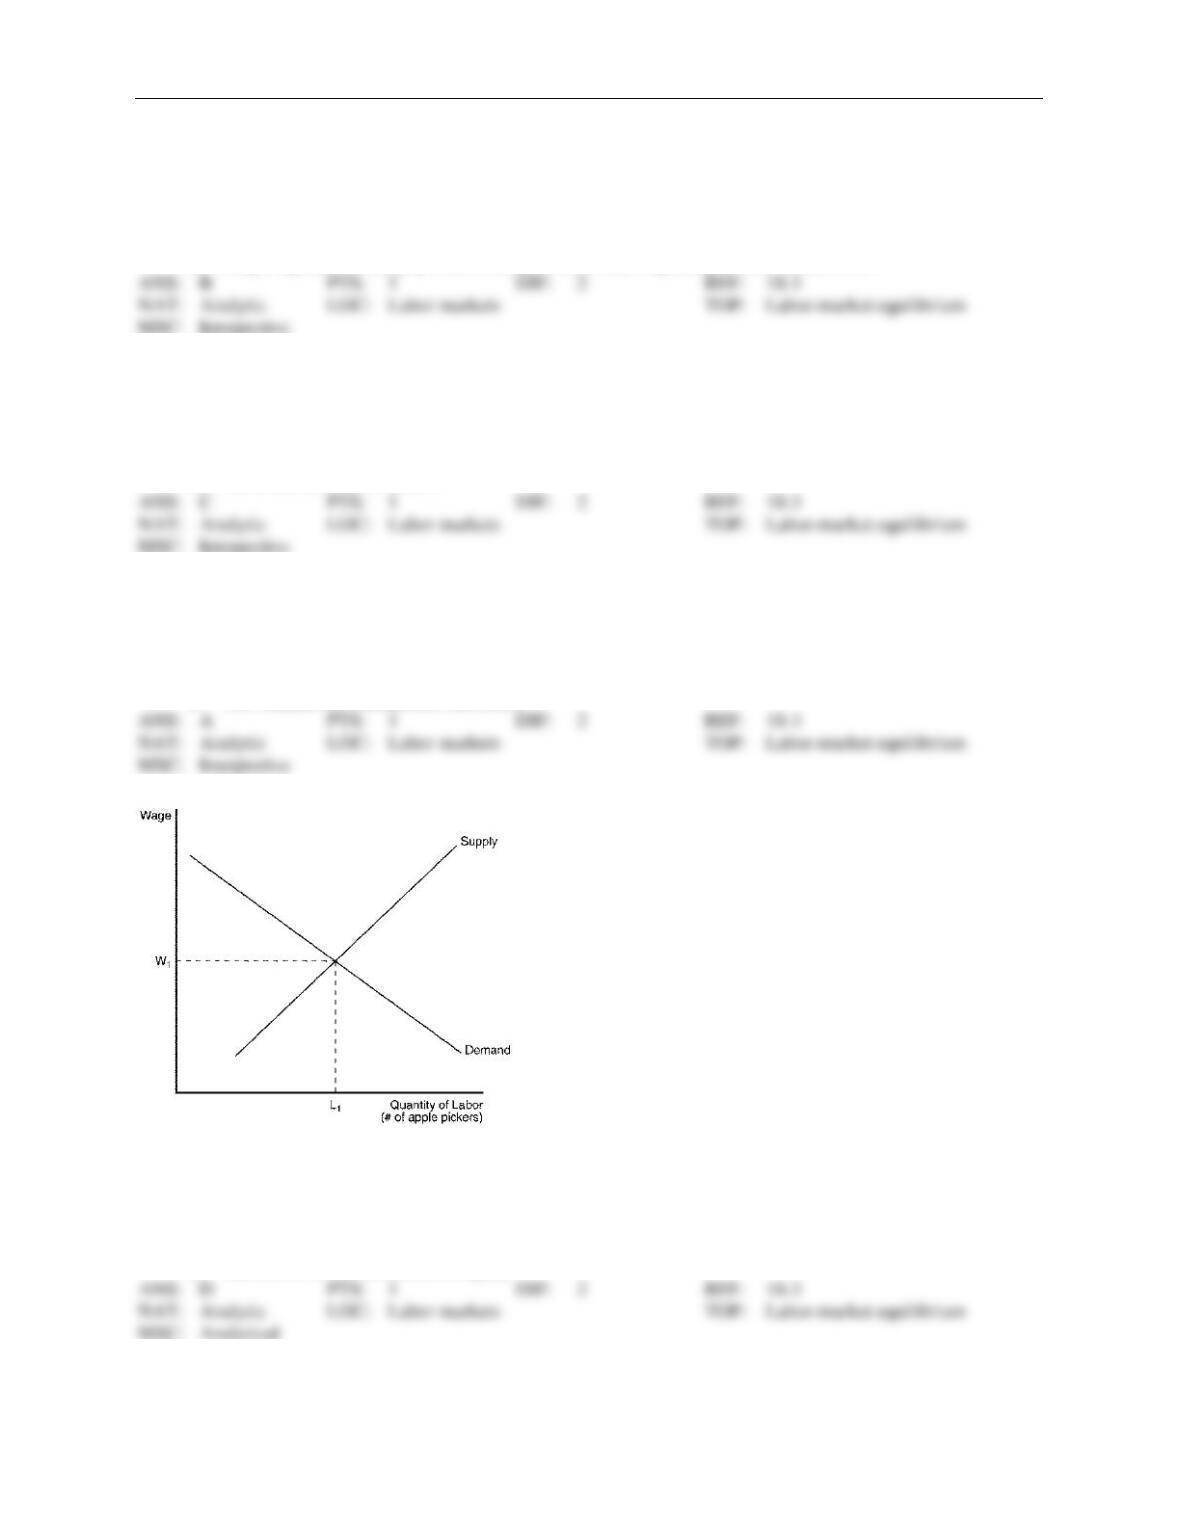
Figure 18-9
31. Refer to Figure 18-9. If the apple pickers start working fewer hours because they are taking more vacation
time, the equilibrium wage will
a.
fall below w1 due to a shift in demand.
b.
fall below w1 due to a shift in supply.
c.
rise above w1 due to a shift in demand.
d.
rise above w1 due to a shift in supply.

60 ❖ Chapter 18/The Market For the Factors of Production
32. Refer to Figure 18-9. If the marginal product of labor falls and the price of apples remains unchanged,
(i)
the value of the marginal product of labor will fall.
(ii)
the quantity of labor demanded will increase above L1.
(iii)
the labor supply curve will remain unchanged.
a.
(i) and (ii) only
b.
(ii) and (iii) only
c.
(i) and (iii) only
d.
(i), (ii), and (iii)
33. Refer to Figure 18-9. If the price of apples increases, the
a.
demand for apple pickers will shift to the left.
b.
demand for apple pickers will shift to the right.
c.
supply of apple pickers will shift to the left.
d.
supply of apple pickers will shift to the right.
34. Refer to Figure 18-9. If the price of apples decreases, the
a.
demand for apple pickers will shift to the left.
b.
demand for apple pickers will shift to the right.
c.
supply of apple pickers will shift to the left.
d.
supply of apple pickers will shift to the right.
35. Refer to Figure 18-9. If the price of apples increases, the equilibrium wage will
a.
increase, and more apple pickers will be hired.
b.
decrease, and more apple pickers will be hired.
c.
increase, and fewer apple pickers will be hired.
d.
decrease, and fewer apple pickers will be hired.
36. Refer to Figure 18-9. If the price of apples decreases, the equilibrium wage will
a.
increase, and more apple pickers will be hired.
b.
decrease, and more apple pickers will be hired.
c.
increase, and fewer apple pickers will be hired.
d.
decrease, and fewer apple pickers will be hired.