Assume that: (1) The company’s marginal city-plus-state-plus-federal tax rate is 40%, (2) each product is expected to have a three-year life, (3) the
firm uses straight-line depreciation, (4) the average cost of capital is 20%, (5) the products have the same risks as the firm’s other business, and (6)
the company has already spent $25,000 on research and development (R&D) for these products. This $250,000 has been capitalized and will be
amortized over the life of the product chosen, if any.
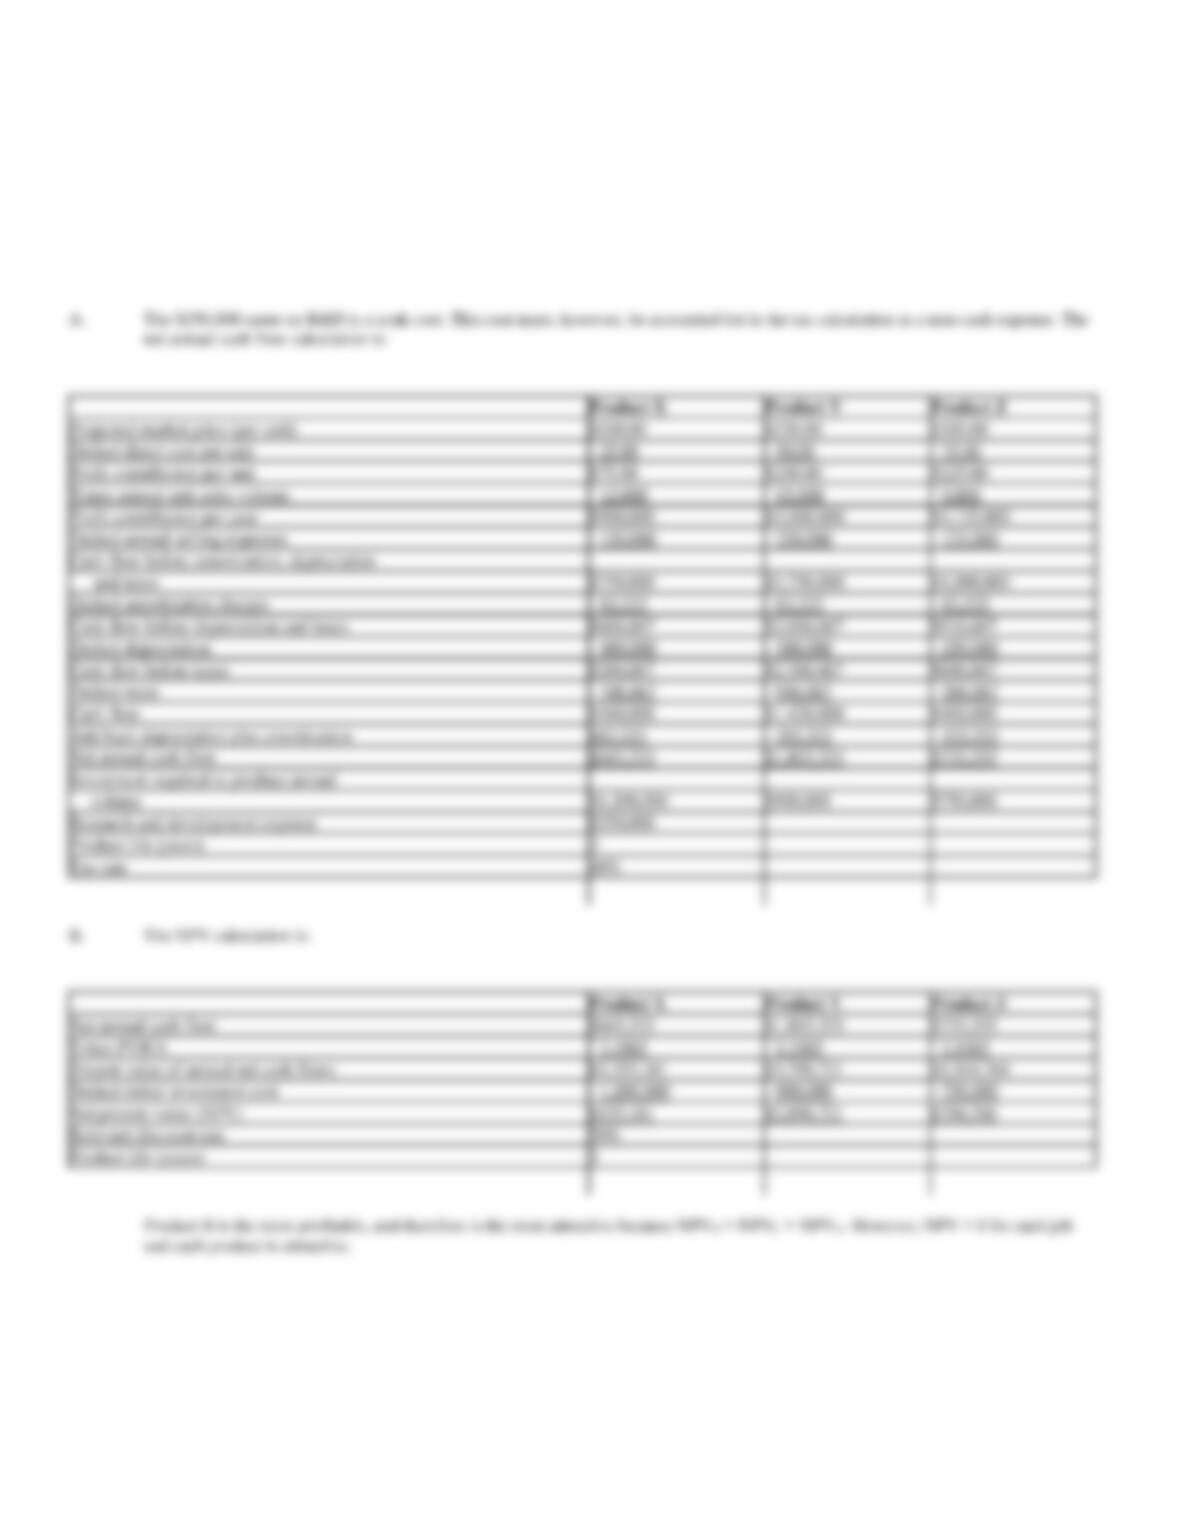
A.
What is the expected net cash flow each year? (Hint: Cash flow equals net profit after taxes plus depreciation and amortization charges.)
B.
What is the net present value of each product? Which product, if any, should BDI introduce?
Projected market price (per unit)
$100.00
$250.00
$300.00
Deduct direct cost per unit
– 25.00
– 50.00
– 75.00
Profit contribution per unit
$75.00
$200.00
$225.00
Times annual unit sales volume
´ 12,000
´ 15,000
´ 5,000
Profit contribution per year
$900,000
$3,000,000
$1,125,000
Deduct annual selling expenses
– 150,000
– 250,000
– 125,000
Cash flow before amortization, depreciation
and taxes
$750,000
$2,750,000
$1,000,000
Deduct amortization charges
– 83,333
– 83,333
– 83,333
Cash flow before depreciation and taxes
$666,667
$2,666,667
$916,667
Deduct depreciation
– 400,000
– 300,000
– 250,000
Cash flow before taxes
$266,667
$2,366,667
$666,667
Deduct taxes
– 106,667
– 946,667
– 266,667
Cash flow
$160,000
$1,420,000
$400,000
Add back depreciation plus amortization
483,333
– 383,333
– 333,333
Net annual cash flow
$643,333
$1,803,333
$733,333
Investment required to produce annual
volume
$1,200,000
$900,000
$750,000
Research and development expense
$250,000
Product life (years)
3
Tax rate
40%
B.
The NPV calculation is:
Net annual cash flow
$643,333
$1,803,333
$733,333
Times PVIFA
´ 2.1065
´ 2.1065
´ 2.1065
Present value of annual net cash flows
$1,355,181
$3,798,721
$1,544,766
Deduct initial investment cost
– 1,200,000
– 900,000
– 750,000
Net present value (NPV)
$155,181
$2,898,721
$794,766
Relevant discount rate
20%
Product life (years)
3
45. Cash Flow Analysis. Dick Tracy has acquired a franchise to sell one of three designs of a novelty watch in
the Gotham City Market:
Design X
Design Y
Design Z
Projected wholesale price (per unit)
$2.00
$4.00
$5.00
Direct cost per unit
$0.50
$1.50
$2.25
Annual unit sales volume
350,000
250,000
100,000
Annual advertising expenses
$10,000
$20,000
$15,000
Investment required to produce annual
volume
$1,200,000
$900,000
$750,000
Assume that: (1) The company’s marginal city-plus-state-plus-federal tax rate is 50%, (2) each product is expected to have a four-year life, (3) the
firm uses straight-line depreciation, (4) the average cost of capital is 12%, (5) the products have the same risk as the firm’s other business, and (6) the
company has already spent $250,000 on franchise acquisition costs. This $250,000 has been capitalized and will be amortized over the life of the
design chosen.
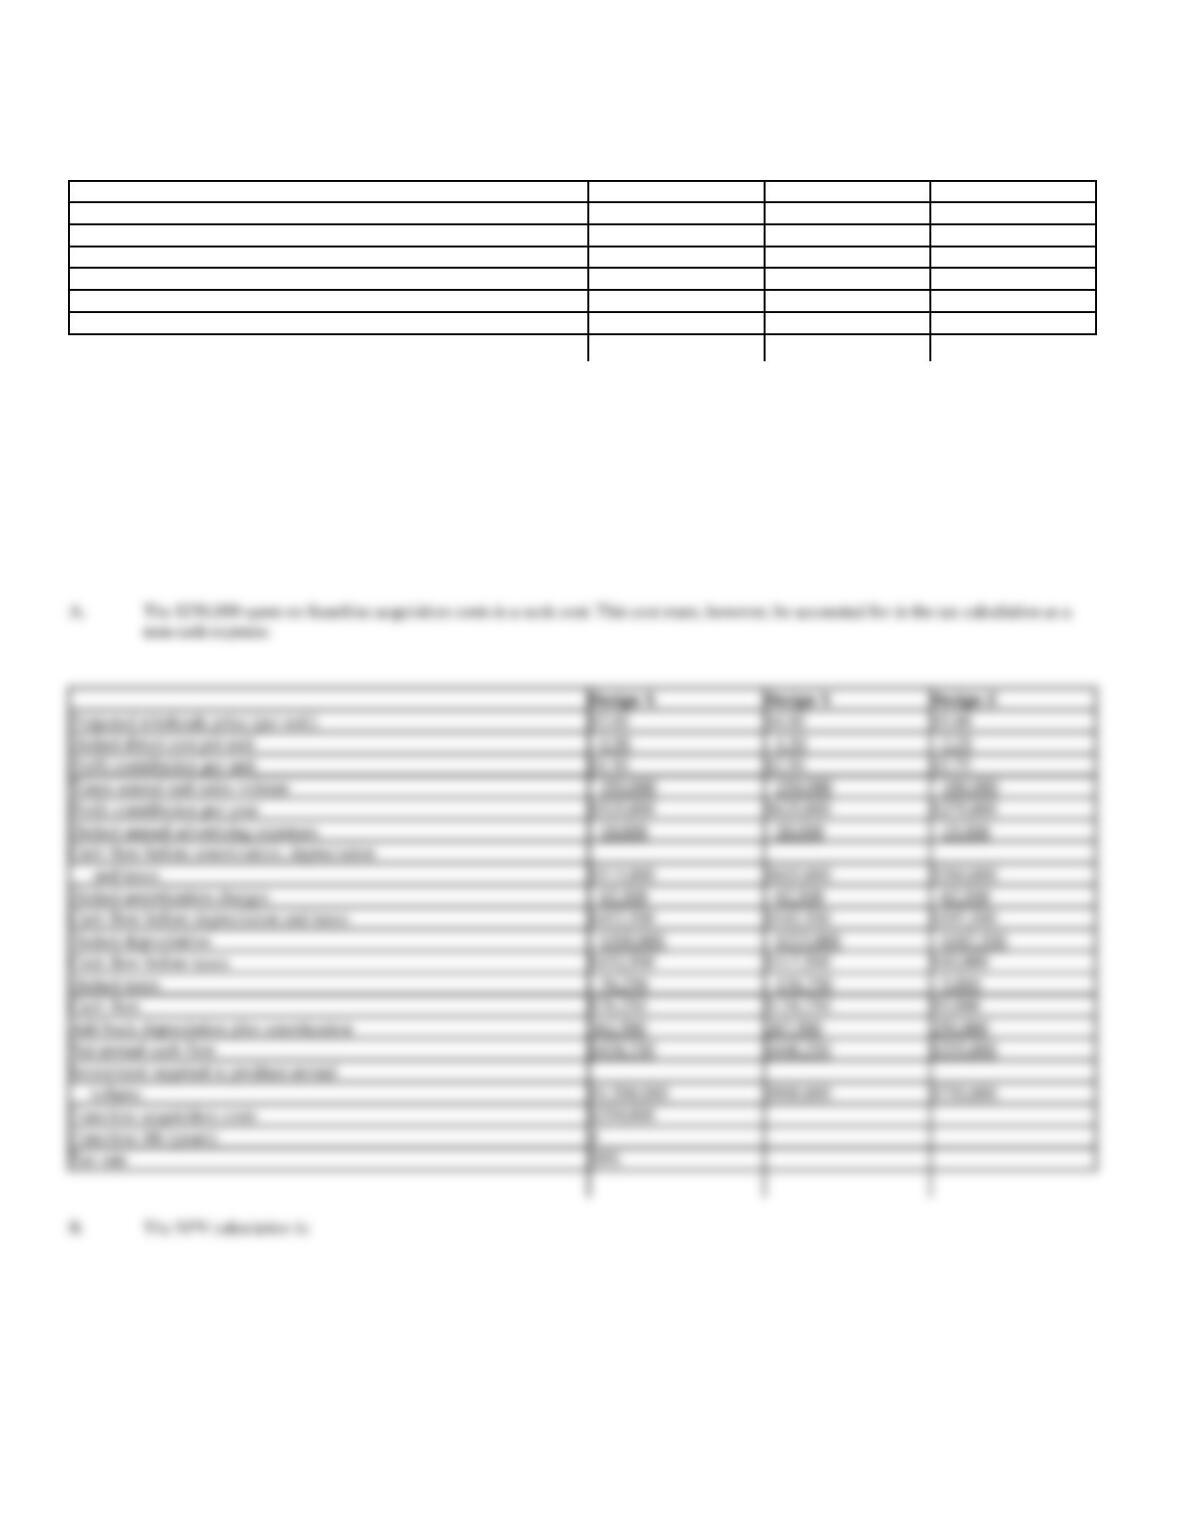
A.
What is the expected net cash flow each year? (Hint: Cash flow equals net profit after taxes plus depreciation and amortization charges.)
B.
What is the net present value of each product? Which design, if any, should Tracy sell?
Design X
Design Y
Design Z
Projected wholesale price (per unit)
$2.00
$4.00
$5.00
Deduct direct cost per unit
– 0.50
– 1.50
– 2.25
Profit contribution per unit
$1.50
$2.50
$2.75
Times annual unit sales volume
´ 350,000
´ 250,000
´ 100,000
Profit contribution per year
$525,000
$625,000
$275,000
Deduct annual advertising expenses
– 10,000
– 20,000
– 15,000
Cash flow before amortization, depreciation
and taxes
$515,000
$605,000
$260,000
Deduct amortization charges
– 62,500
– 62,500
– 62,500
Cash flow before depreciation and taxes
$452,500
$542,500
$197,500
Deduct depreciation
– $300,000
– $225,000
– $187,500
Cash flow before taxes
$152,500
$317,500
$10,000
Deduct taxes
– 76,250
– 158,750
– 5,000
Cash flow
$76,250
$158,750
$5,000
Add back depreciation plus amortization
362,500
287,500
250,000
Net annual cash flow
$438,750
$446,250
$255,000
Investment required to produce annual
volume
$1,200,000
$900,000
$750,000
Franchise acquisition costs
$250,000
Franchise life (years)
4
Tax rate
50%
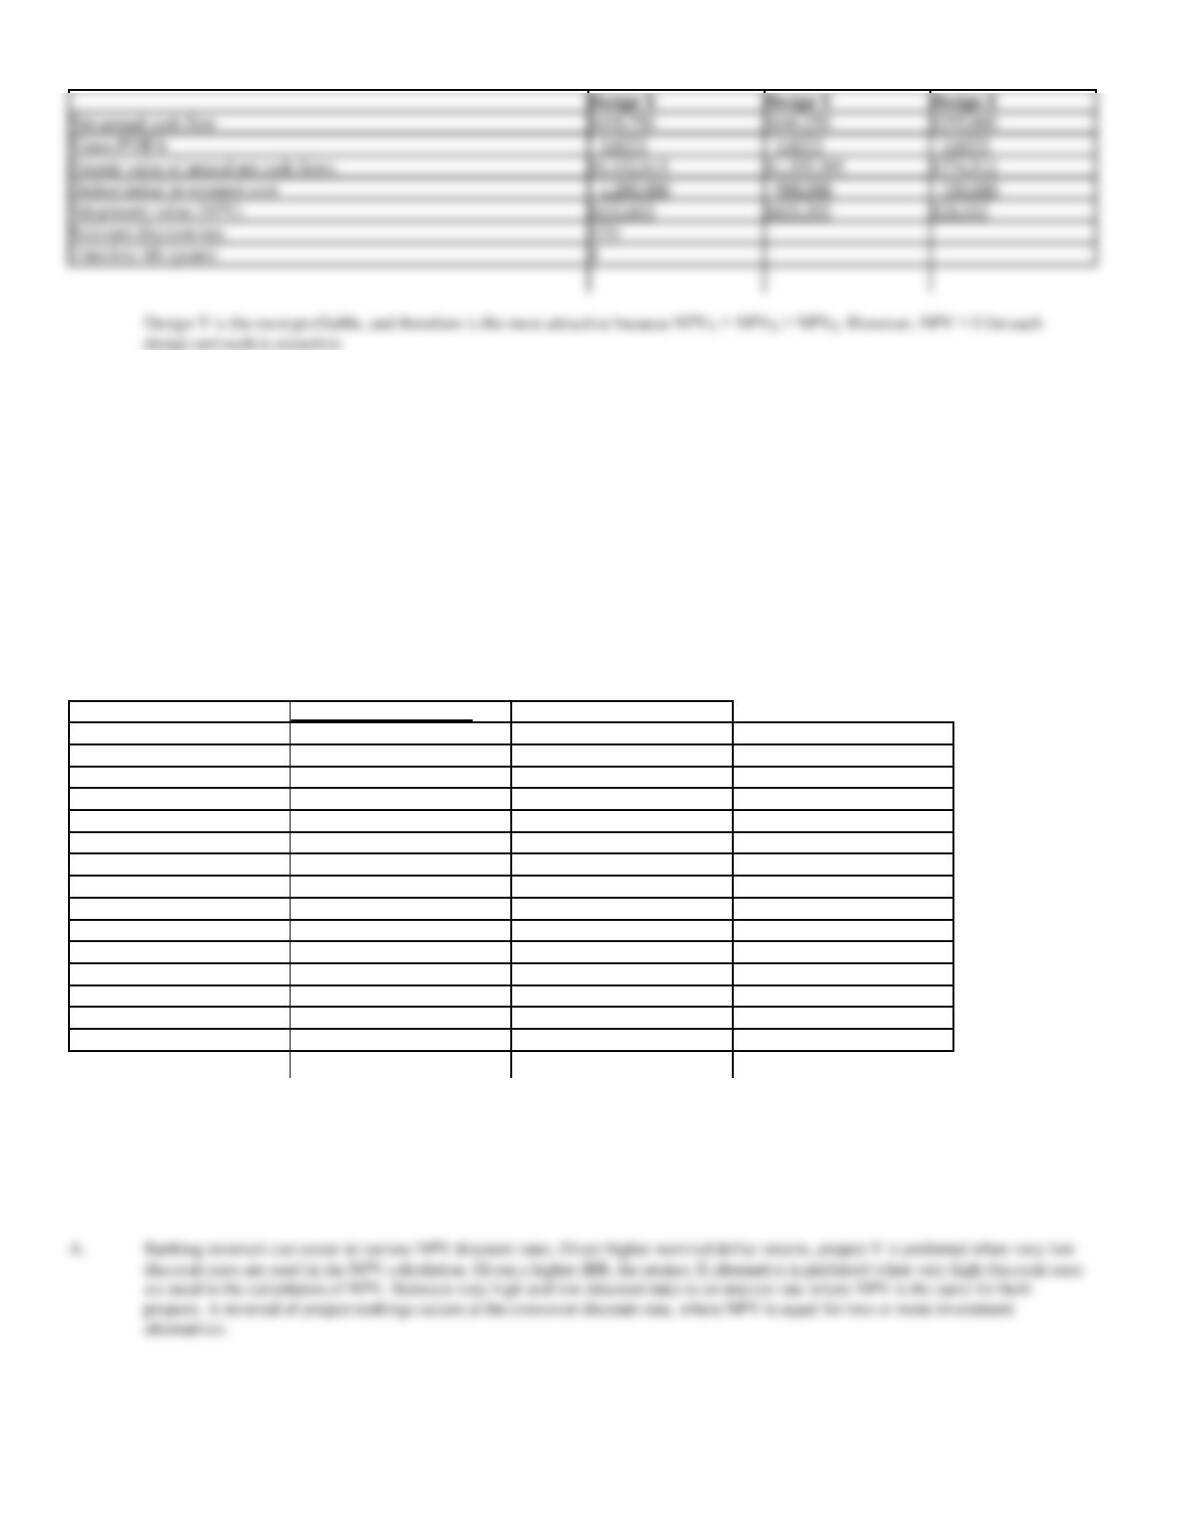
B.
The NPV calculation is:
46. Crossover Discount Rates. Sally Rogers is the chief financial officer for Popular Productions, Inc.,
producers of The Allan Brady Show, a hit comedy series. Rogers is considering the desirability of purchasing
one of two alternative forms of post-production equipment used in the tape editing process. Rogers has
discovered that a serious problem can arise when using the NPV method of project valuation because projects
sometimes differ significantly in terms of the magnitude and timing of cash flows. When the size or pattern of
alternative project cash flows differs greatly, each project’s NPV can react quite differently to changes in the
discount rate. Changes in the appropriate discount rate can sometimes lead to reversals in project rankings.
Rogers discovered this problem when considering the following before-tax cash flow data:
Expected Net Cash Flow
Difference
Year
Project X
Project Y
Project X – Y
2008
($700,000)
($1,750,000)
$1,050,000
2009
150,000
500,000
(350,000)
2010
150,000
450,000
(300,000)
2011
150,000
400,000
(250,000)
2012
150,000
350,000
(200,000)
2013
150,000
300,000
(150,000)
2014
150,000
250,000
(100,000)
2015
150,000
200,000
(50,000)
2016
150,000
150,000
0
2017
150,000
100,000
50,000
2018
150,000
50,000
100,000
Net Cash Flow
$800,000
$1,000,000
($200,000)
IRR
16.95%
13.18%
7.99%
NPV @ 7.99%
$306,966
$306,878
$88
A.
Conceptually describe how ranking reversals can occur at the crossover discount rate.
B.
Which investment project is preferred at a relevant cost of capital that is below the crossover discount rate? Why?
C.
Which investment project is preferred at a relevant cost of capital that is above the crossover discount rate? Why?
Design X
Design Y
Design Z
Net annual cash flow
$438,750
$446,250
$255,000
Times PVIFA
´ 3.0373
´ 3.0373
´ 3.0373
Present value of annual net cash flows
$1,332,615
$1,355,395
$774,512
Deduct initial investment cost
– 1,200,000
– 900,000
– 750,000
Net present value (NPV)
$132,615
$455,395
$24,512
Relevant discount rate
12%
Franchise life (years)
4
47. Cost of Capital. Chock Full O’Coffee, Inc., processes and markets a leading brand of coffee. A security
analyst’s report issued by a national brokerage firm indicates that debt yielding 9%, comprises 60% of the
company’s overall capital structure. Furthermore, both earnings and dividends are expected to grow at a rate of
4% per year.
Currently, common stock in the company is priced at $20, and it should pay $1.40 per share in dividends during
the coming year. This yield compares favorably with the 8% return currently available on risk-free securities
and the 14% average for all common stocks, given the company’s estimated beta of 0.5.
A.
Calculate the component cost of equity using both the capital asset pricing model and the dividend yield plus expected growth model.
B.
Assuming a 50% marginal federal plus state income tax rate, calculate the company’s weighted average cost of capital.
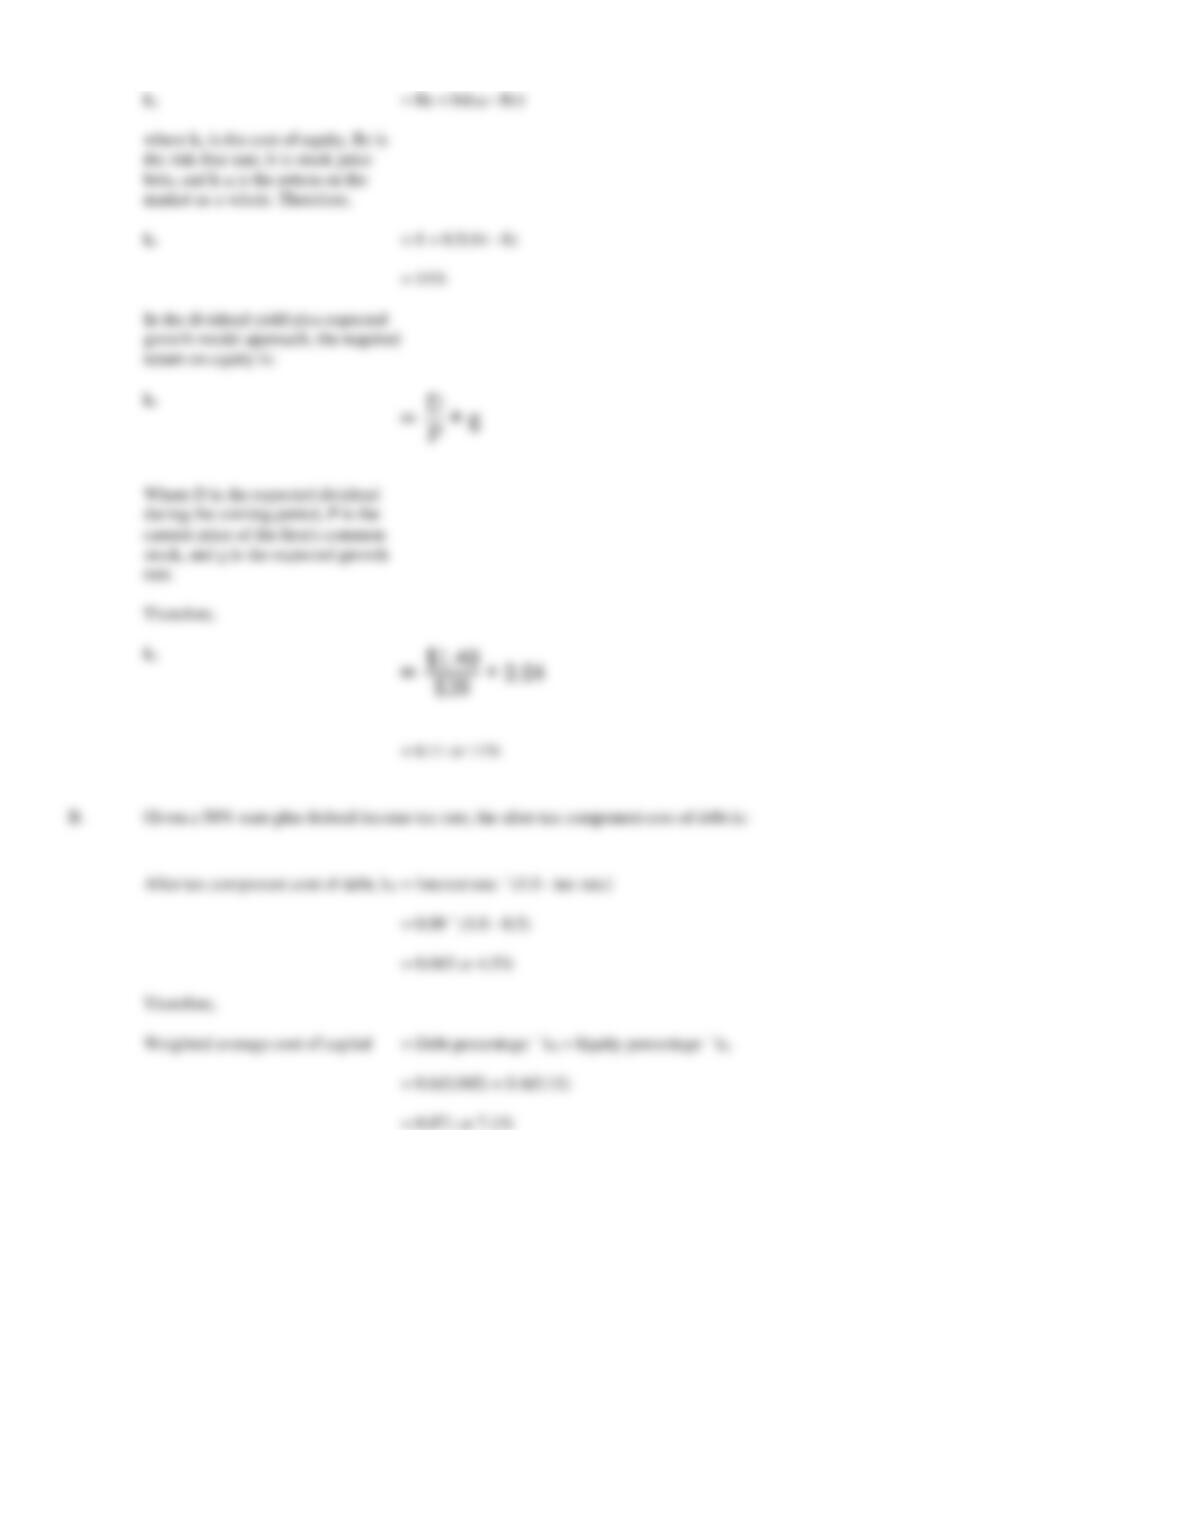
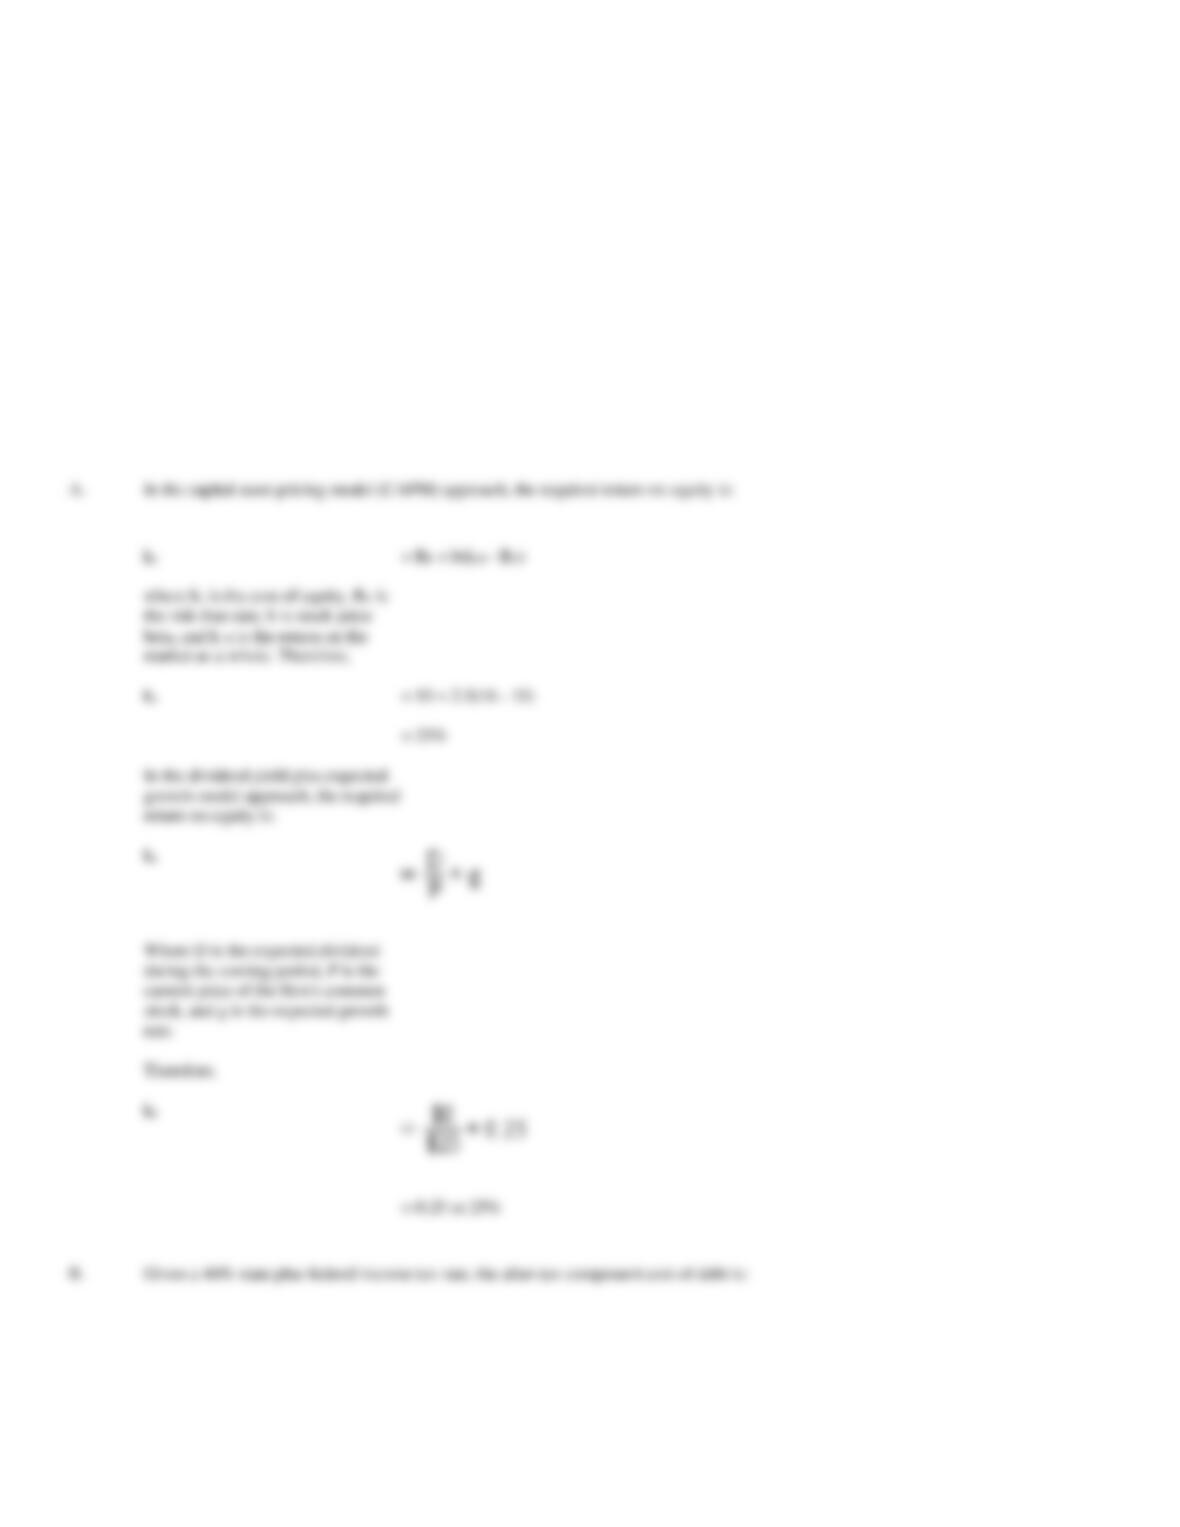
In the capital asset pricing model (CAPM) approach, the required return on equity is:
48. Cost of Capital. Northwest Bankshares, Inc., is a rapidly growing chain of commercial banks in north
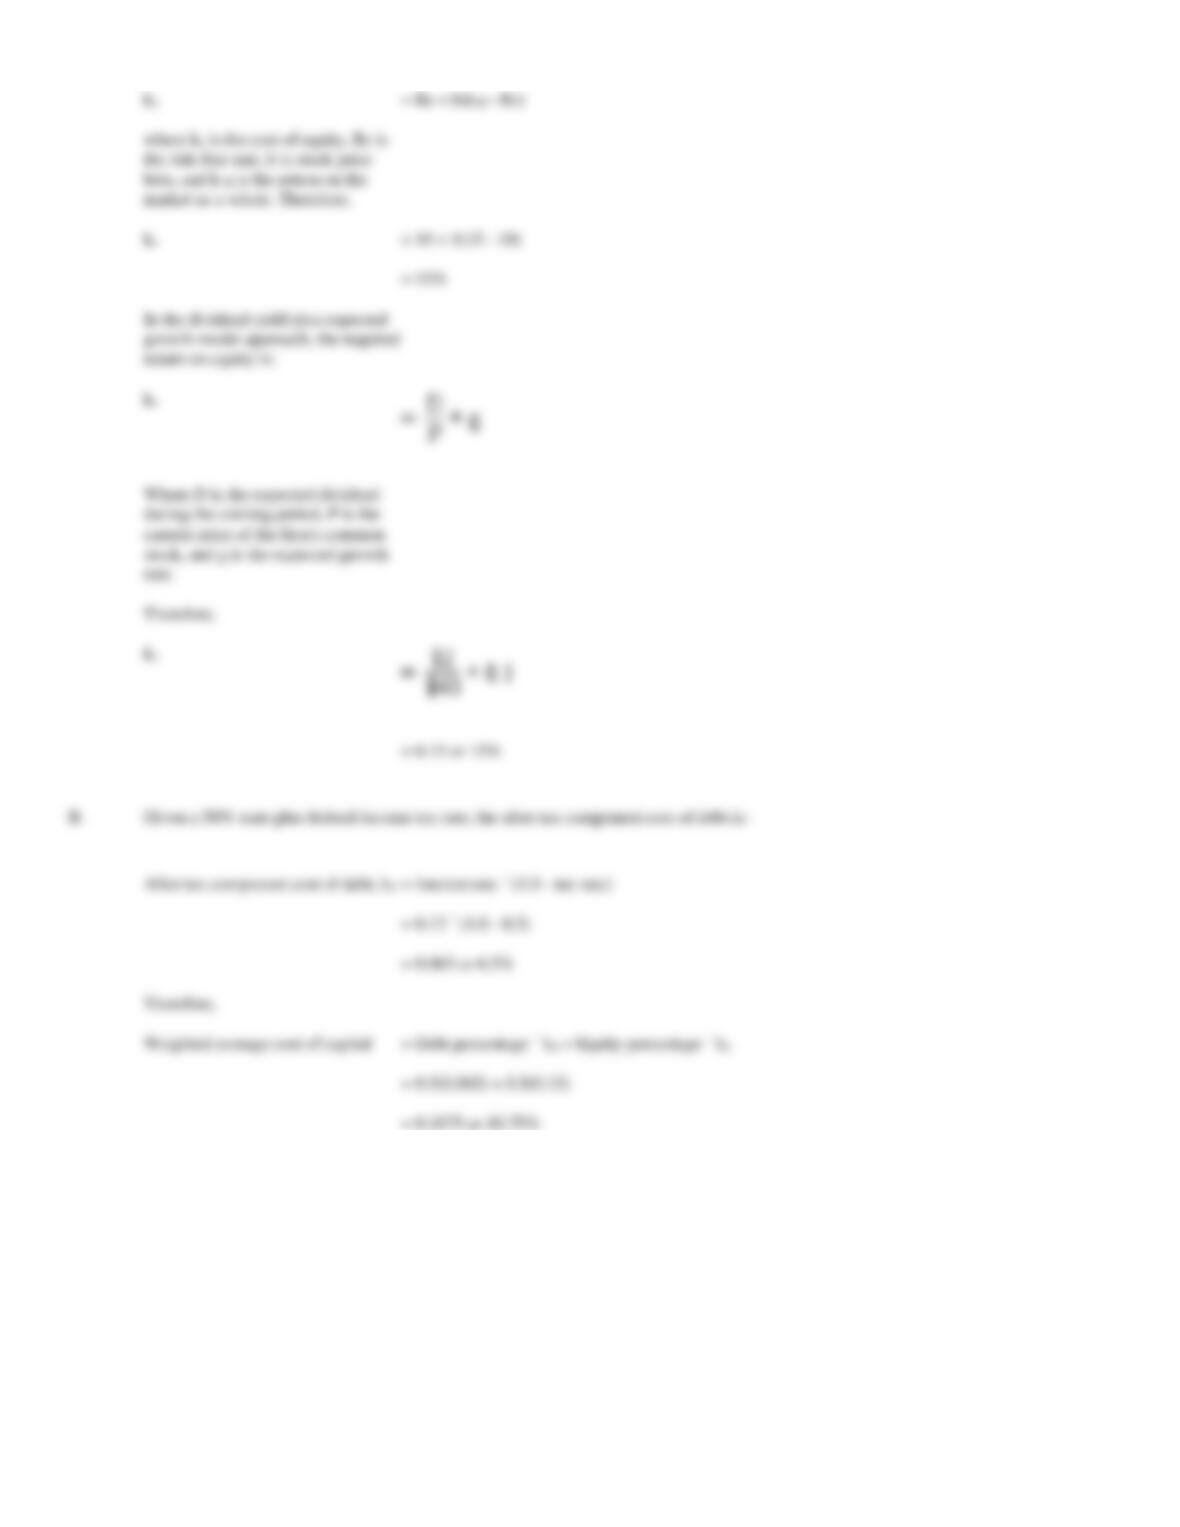
central states. A security analyst’s report issued by a national brokerage firm indicates that debt yielding 15%,
comprises 25% of Northwest’s overall capital structure. Furthermore, both earnings and dividends are expected
to grow at a rate of 25% per year.
Currently, common stock in the company is priced at $25, and is not expected to pay dividends during the
coming year. This yield compares favorably with the 10% return currently available on risk-free securities and
the 16% average for all common stocks, given the company’s estimated beta of 2.5.
A.
Calculate Northwest’s component cost of equity using both the capital asset pricing model and the dividend yield plus expected growth
model.
B.
Assuming a 40% marginal federal plus state income tax rate, calculate Northwest’s weighted average cost of capital.
stock, and g is the expected growth
rate.
Therefore,
= 0.25 or 25%
49. Cost of Capital. Marine Transport, Ltd., operates a fleet of oil and chemical tankers. A security analyst’s
report issued by a national brokerage firm indicates that debt yielding 13%, comprises 50% of Marine’s overall
capital structure. Furthermore, both earnings and dividends are expected to grow at a rate of 10% per year.
Currently, common stock in the company is priced at $40, and it should pay $2 per share in dividends during the
coming year. This yield compares favorably with the 10% return currently available on risk-free securities and
the 15% average for all common stocks, given the company’s estimated beta of 1.
A.
Calculate Marine’s component cost of equity using both the capital asset pricing model and the dividend yield plus expected growth
model.
B.
Assuming a 50% marginal federal plus state income tax rate, calculate Marine’s weighted average cost of capital.
In the capital asset pricing model (CAPM) approach, the required return on equity is:
After tax component cost of debt, kd
= Interest rate ´ (1.0 – tax rate)
= 0.15 ´ (1.0 – 0.4)
= 0.09 or 9%
Therefore,
Weighted average cost of capital
= Debt percentage ´ kd + Equity percentage ´ ke
= 0.25(0.09) + 0.75(0.25)
= 0.21 or 21%

50. Cost of Capital. Dartmouth Systems, Inc., is a leading supplier of sorters and collators to the copier and
computer printer market. A security analyst’s report issued by a national brokerage firm indicates that debt
yielding 8%, comprises 50% of Dartmouth’s overall capital structure. Furthermore, both earnings and dividends
are not expected to grow during coming years.
Currently, common stock in the company is priced at $75, and it should pay $7.50 per share in dividends during
the coming year. This yield compares favorably with the 7% return currently available on risk-free securities
and the 13% average for all common stocks, given the company’s estimated beta of 0.5.
A.
Calculate Dartmouth’s component cost of equity using both the capital asset pricing model and the dividend yields plus expected growth
model.
B.
Assuming a 40% marginal federal plus state income tax rate, calculate Dartmouth’s weighted average cost of capital.
stock, and g is the expected growth
rate.
Therefore,
= 0.10 or 10%