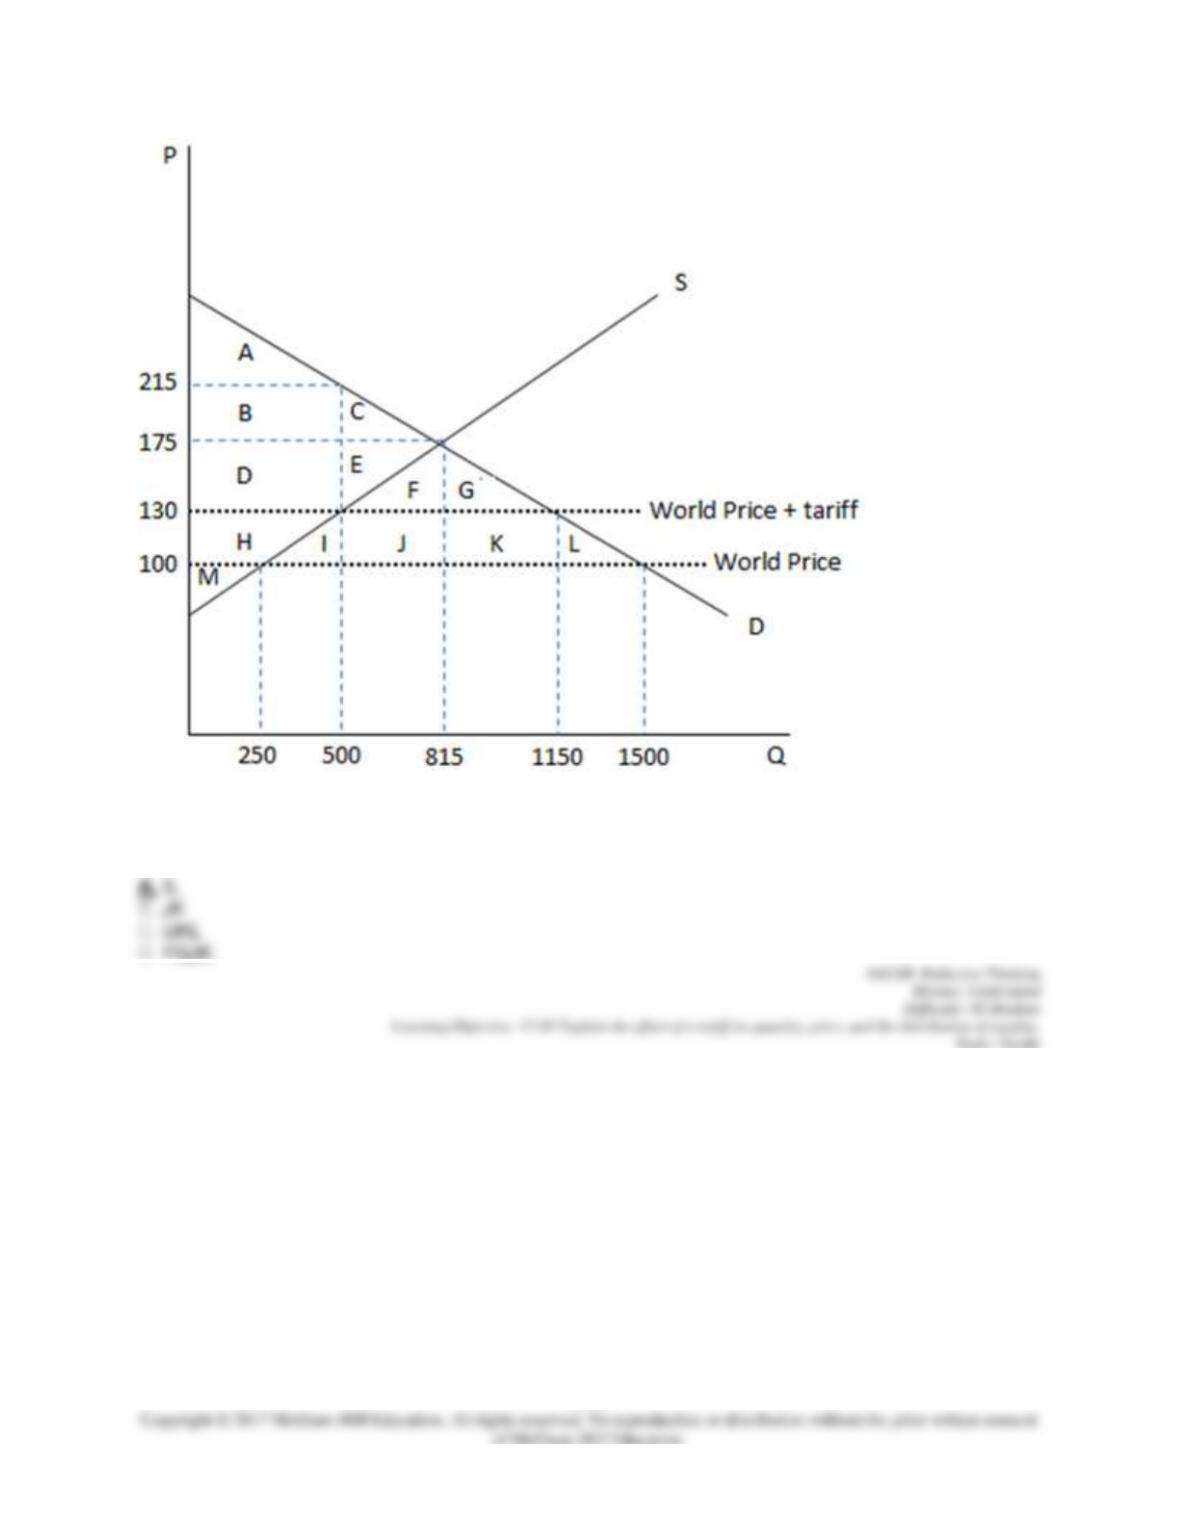
17–61
According to the graph shown, the amount of deadweight loss created by the imposition of a tariff is area:
110. This graph demonstrates the domestic demand and supply for a good, as well as a tariff and the
world price for that good.
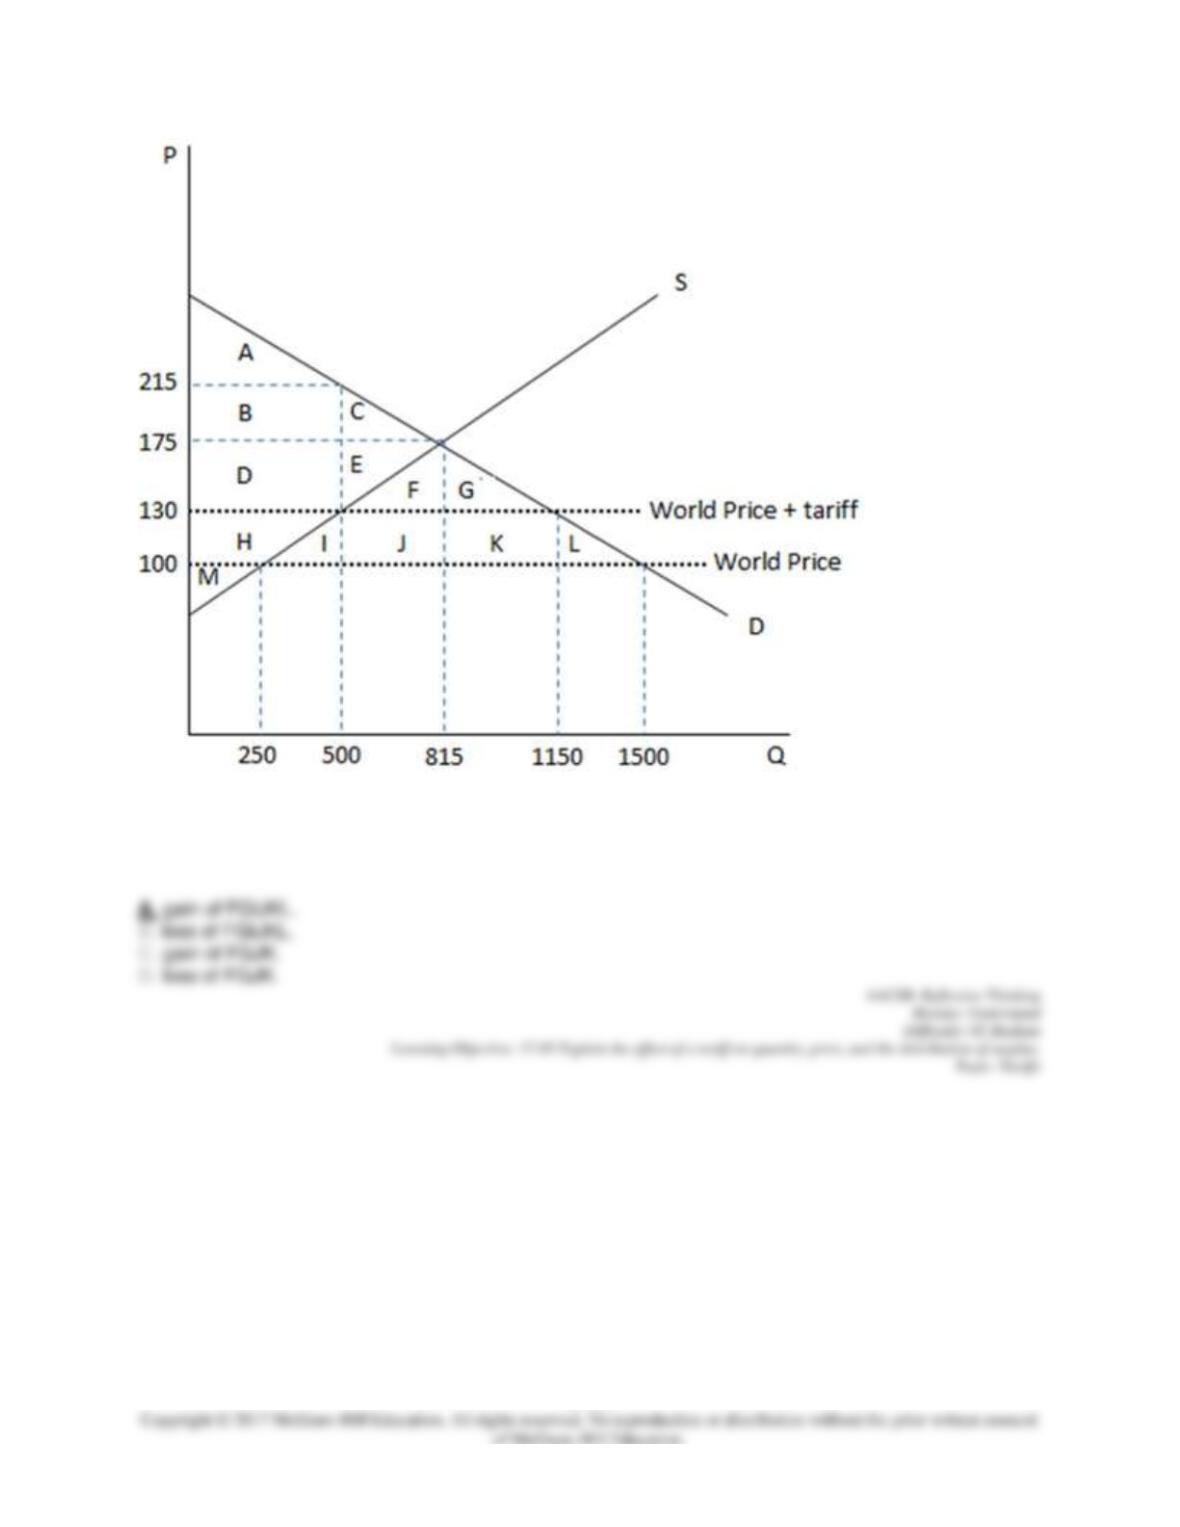
17–62
According to the graph shown, if the economy were operating in autarky and then moved to free trade,
the overall impact on surplus would be a net:
111. This graph demonstrates the domestic demand and supply for a good, as well as a tariff and the
world price for that good.
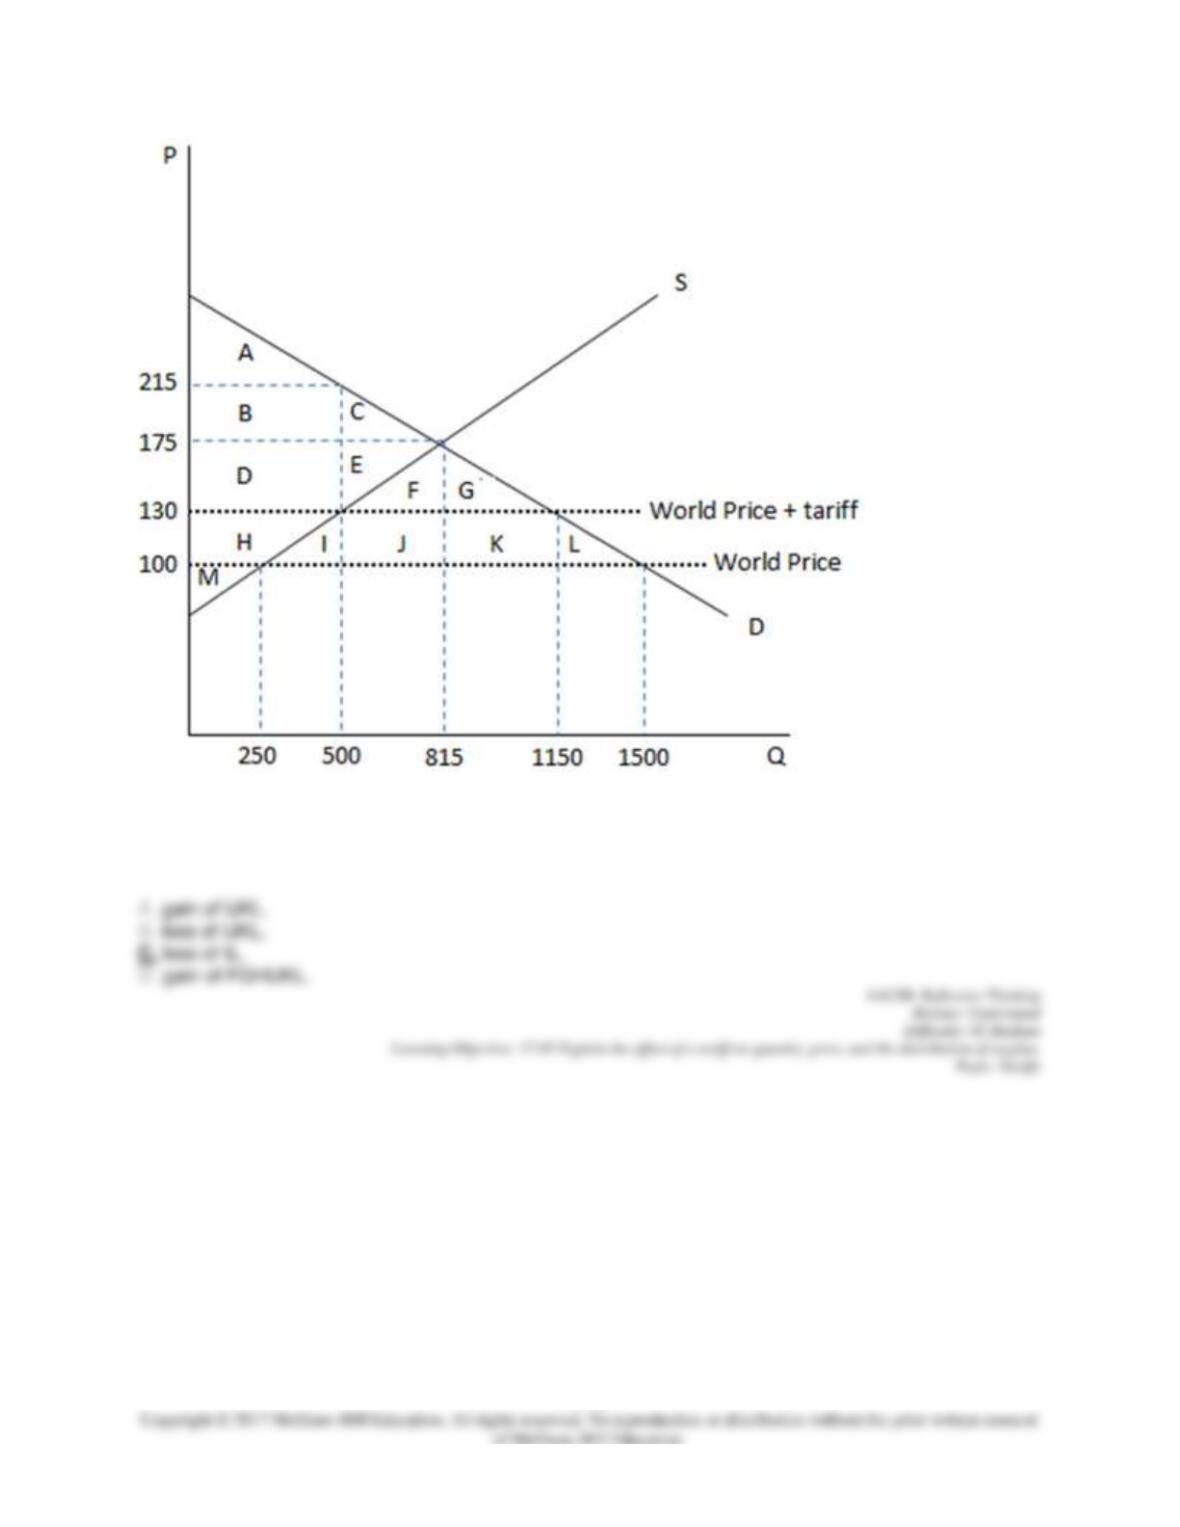
17–63
According to the graph shown, if the economy were operating under free trade and then imposed a tariff,
the overall impact on surplus would be a net:
112. This graph demonstrates the domestic demand and supply for a good, as well as a tariff and the
world price for that good.
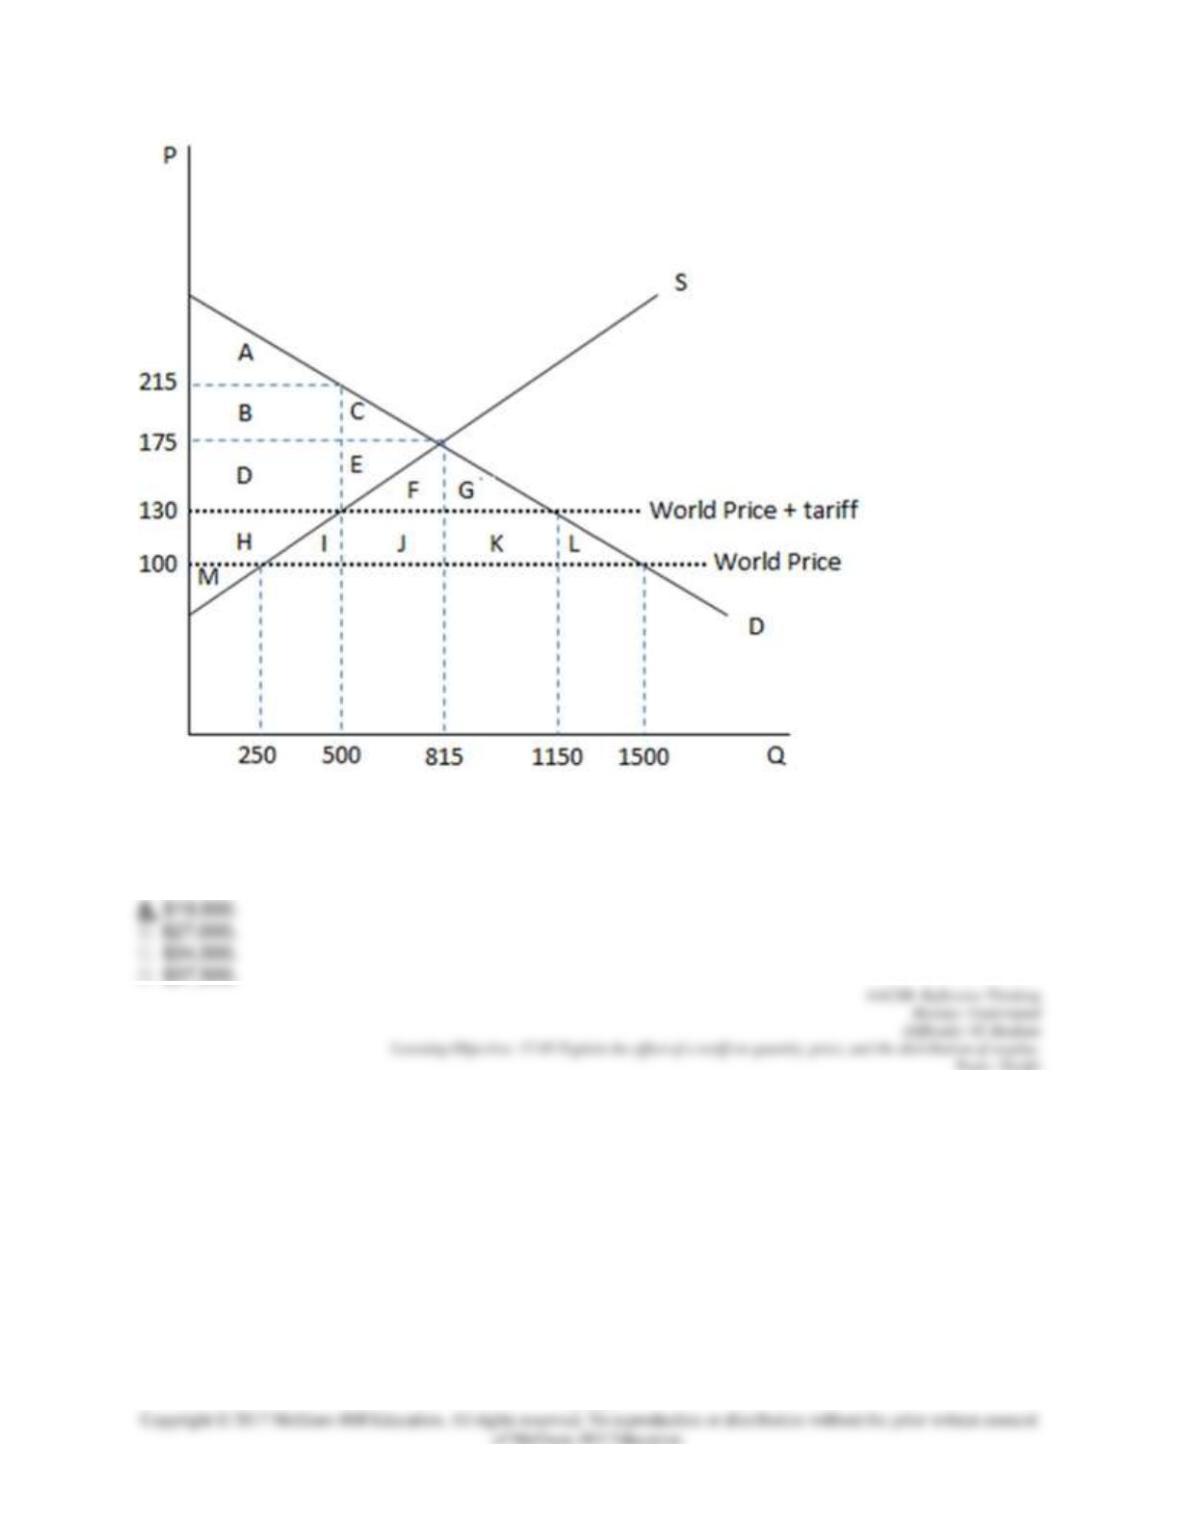
17–64
According to the graph shown, if the economy decides to impose a tariff, the government can expect to
raise how much in government revenues?
113. This graph demonstrates the domestic demand and supply for a good, as well as a tariff and the
world price for that good.
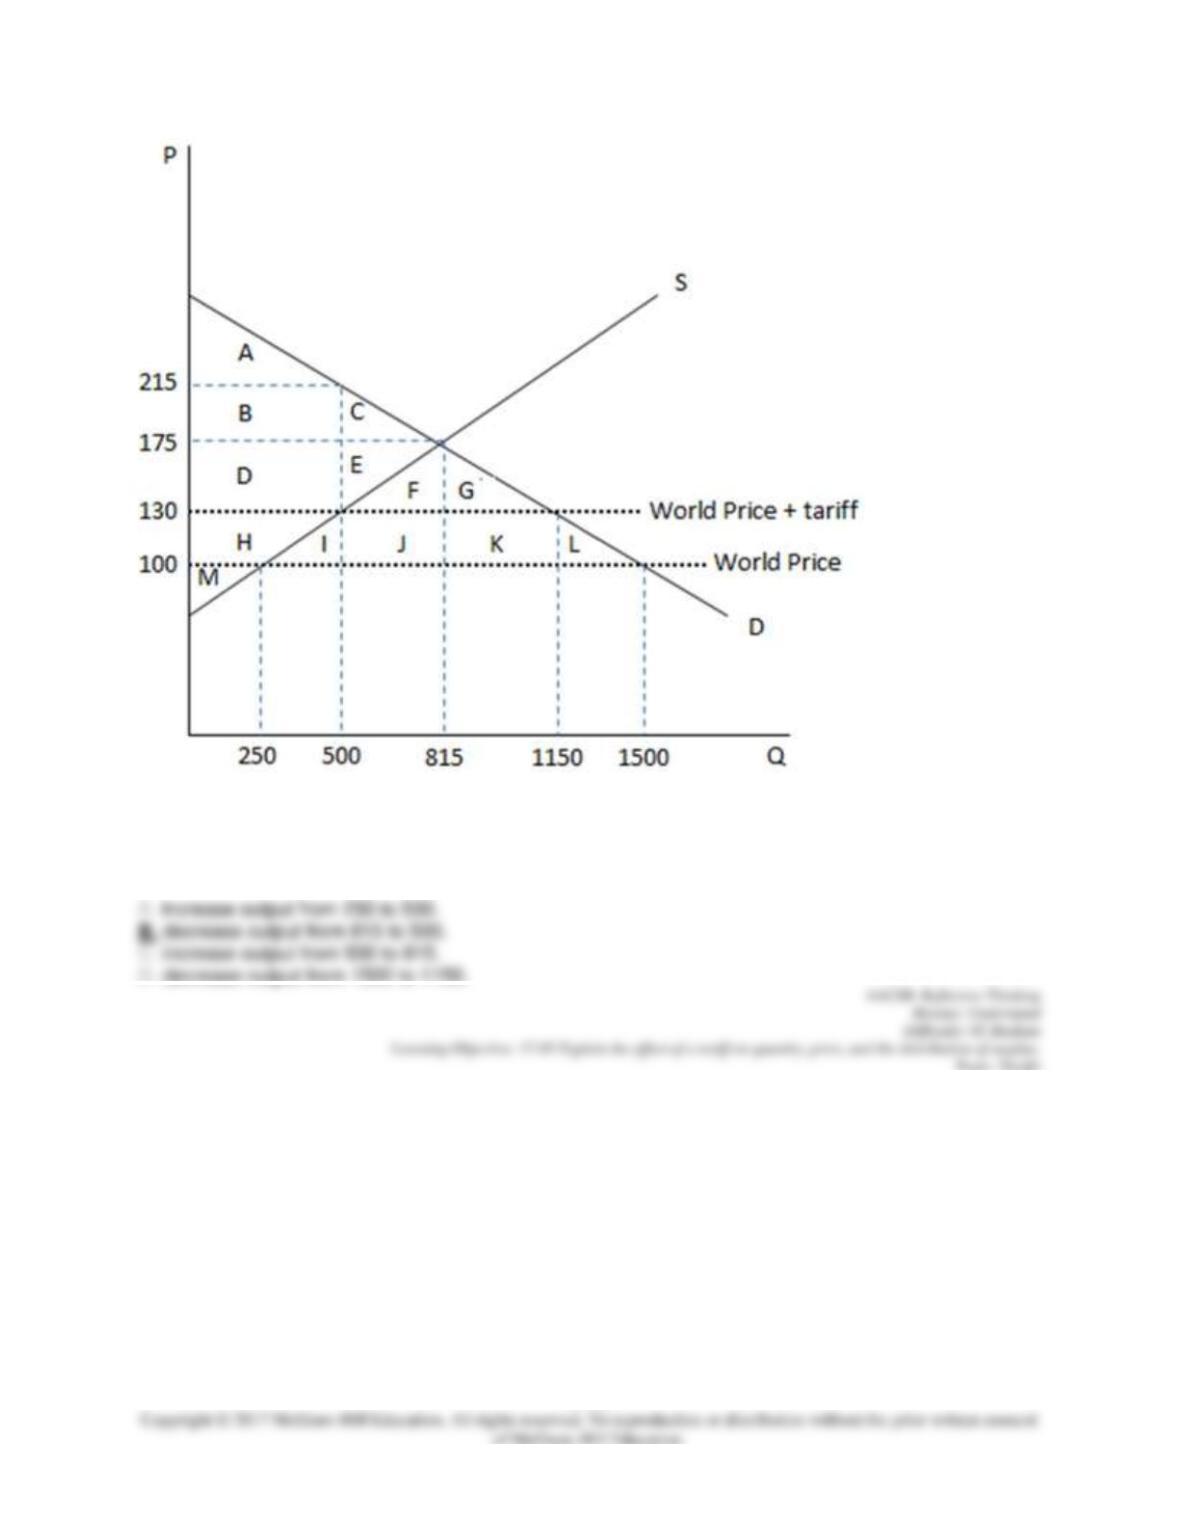
17–65
According to the graph shown, if the economy is in autarky and decides to open trade with a tariff, the
impact on domestic supply is they will:
114. This graph demonstrates the domestic demand and supply for a good, as well as a tariff and the
world price for that good.
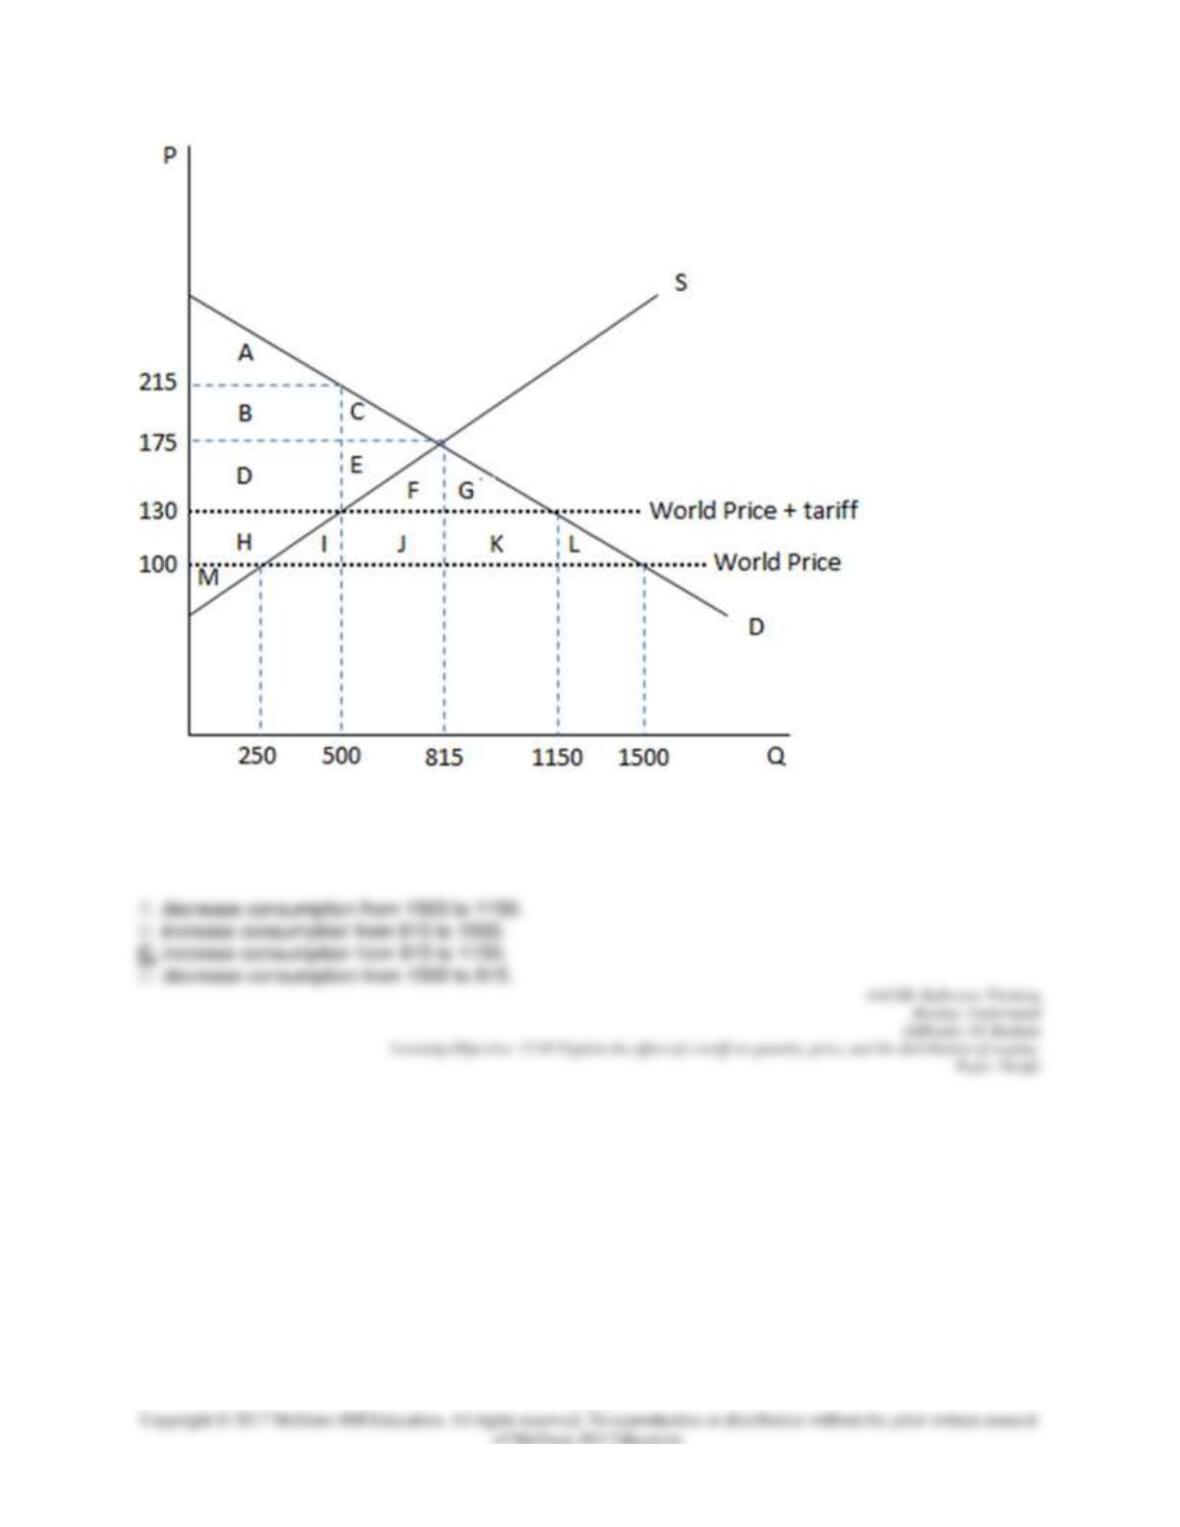
17–66
According to the graph shown, if the economy is operating in autarky and decides to open trade with a
tariff, the impact on domestic demand is they will:
115. This graph demonstrates the domestic demand and supply for a good, as well as a tariff and the
world price for that good.
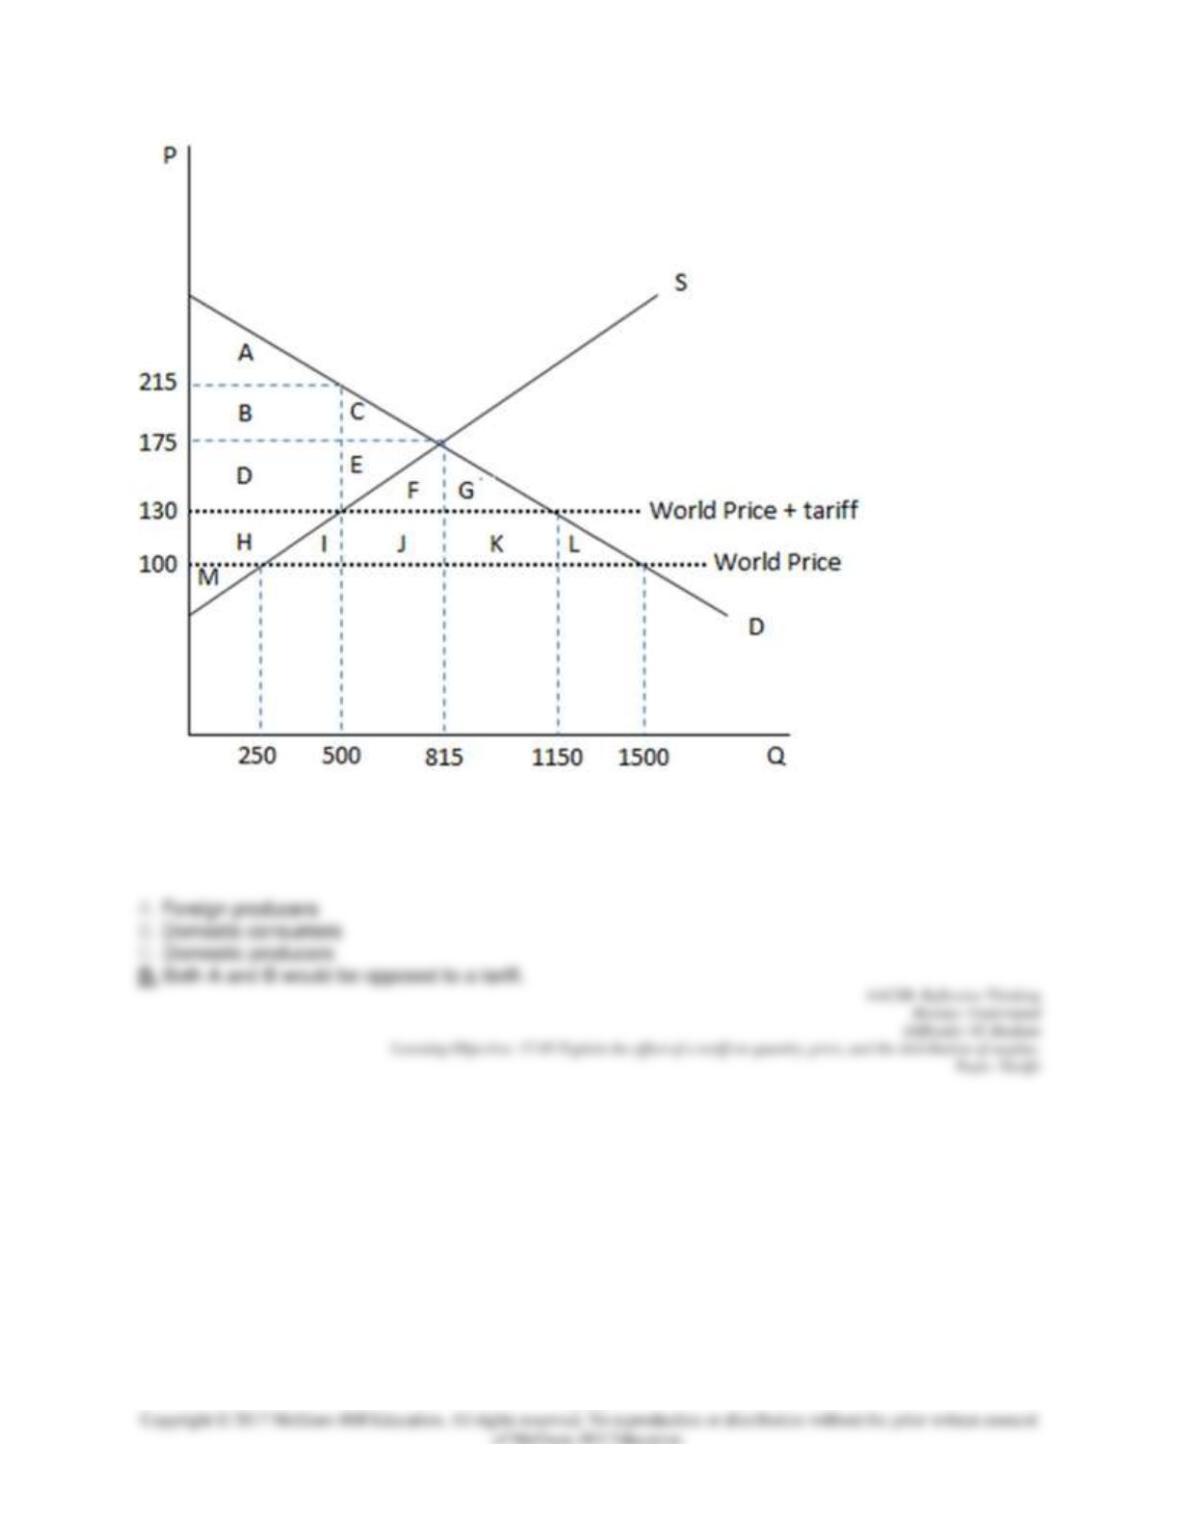
17–67
According to the graph shown, if the economy is operating under free trade, who would be opposed to a
tariff?
116. This graph demonstrates the domestic demand and supply for a good, as well as a tariff and the
world price for that good.
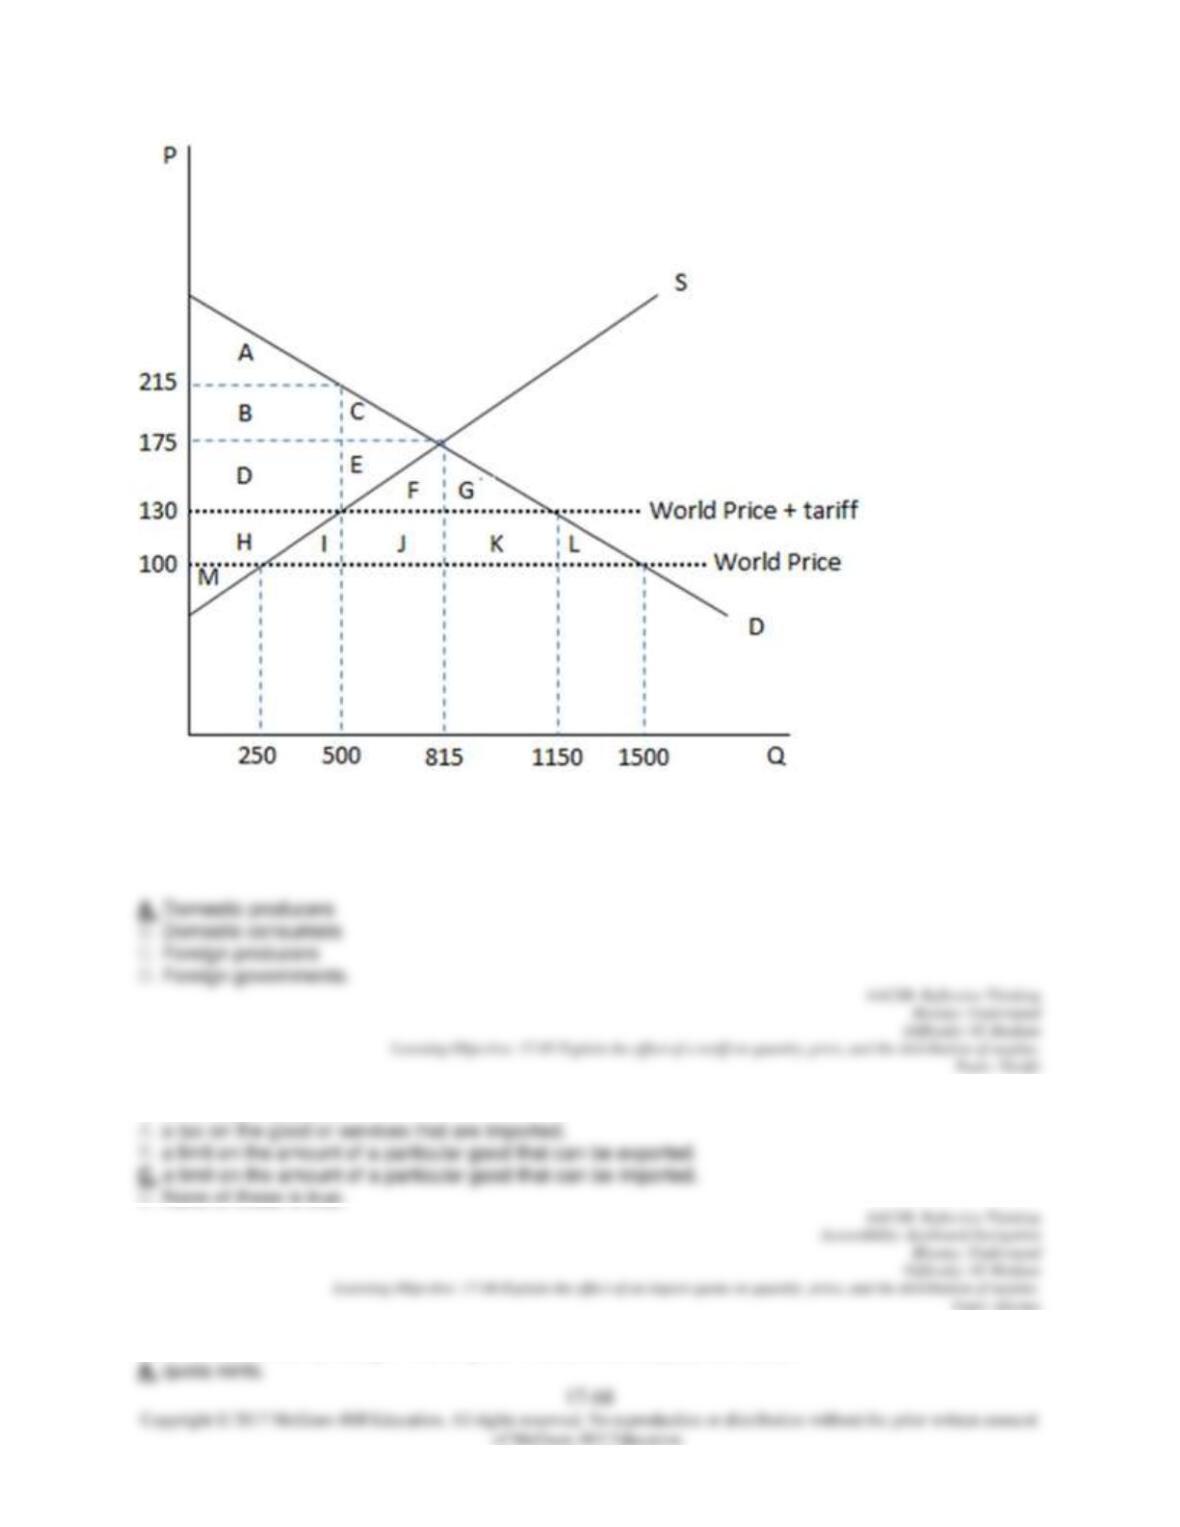
According to the graph shown, if the economy is operating under free trade, who would be in favor of a
tariff?
117. An import quota is:
118. Profits earned by foreign firms or governments under a quota are called:
17–69
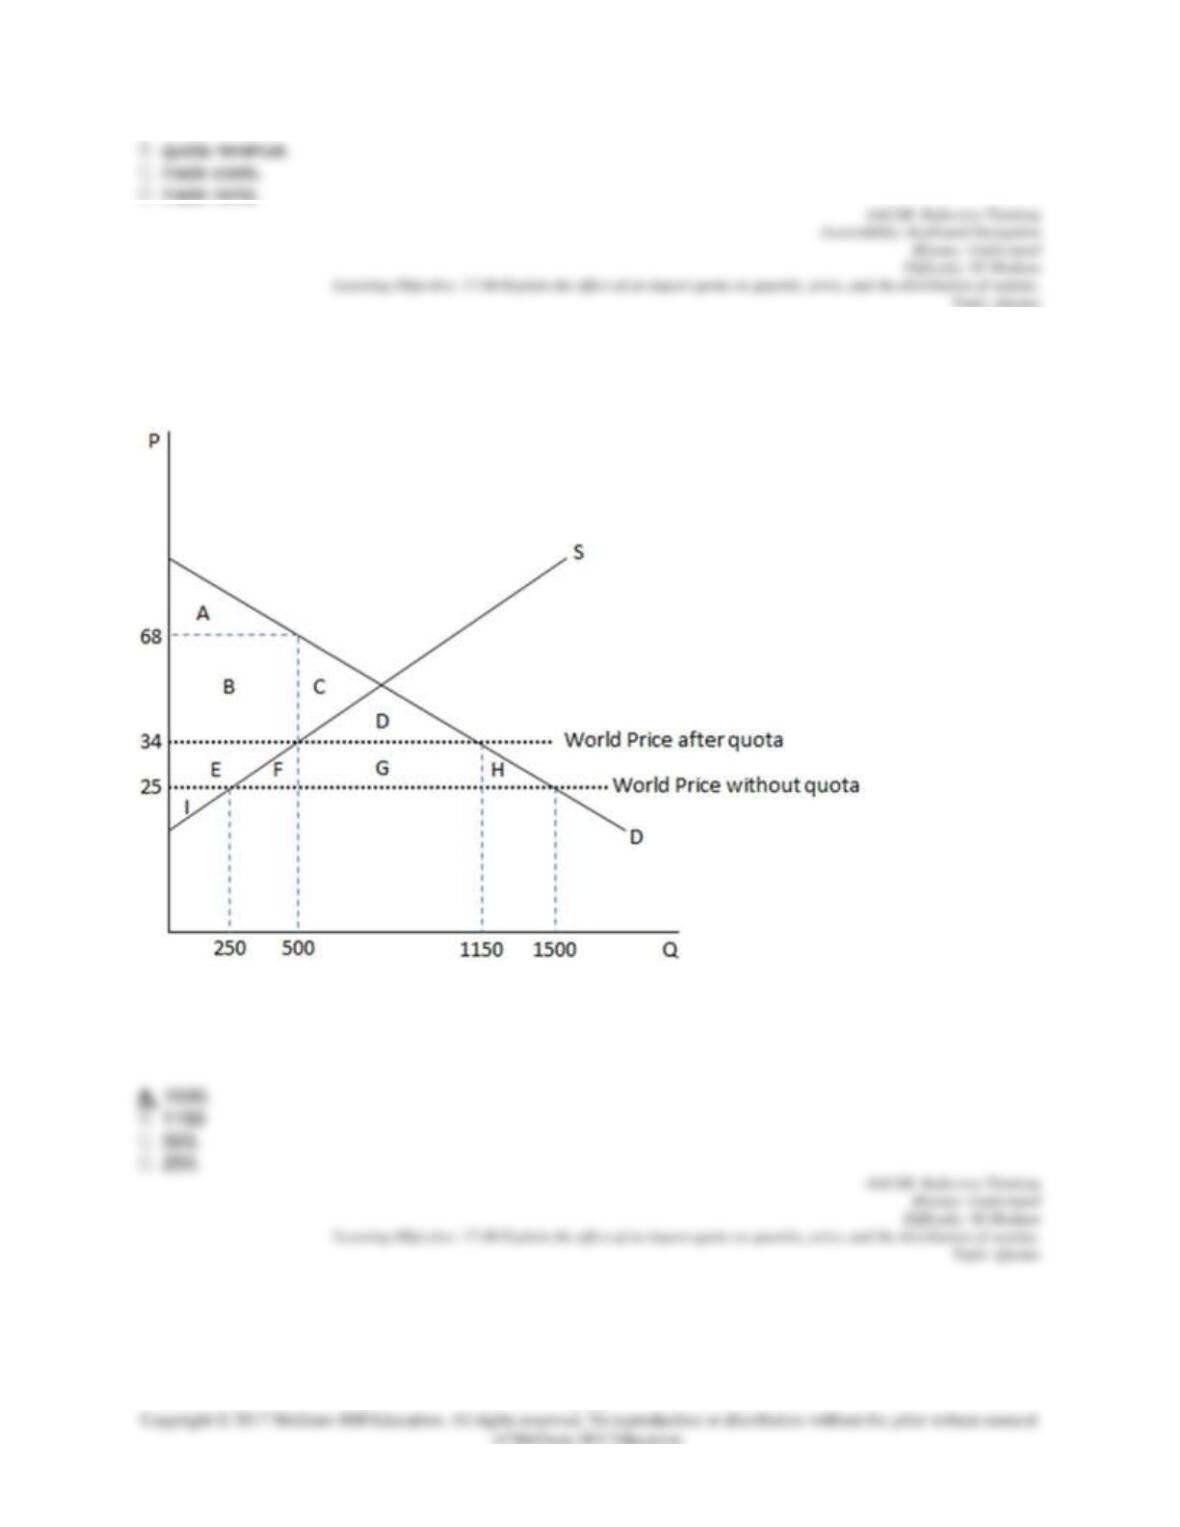
119. This graph demonstrates the domestic demand and supply for a good, as well as a quota and the
world price for that good.
According to the graph shown, the amount bought by domestic consumers when there is open trade for
this good is:
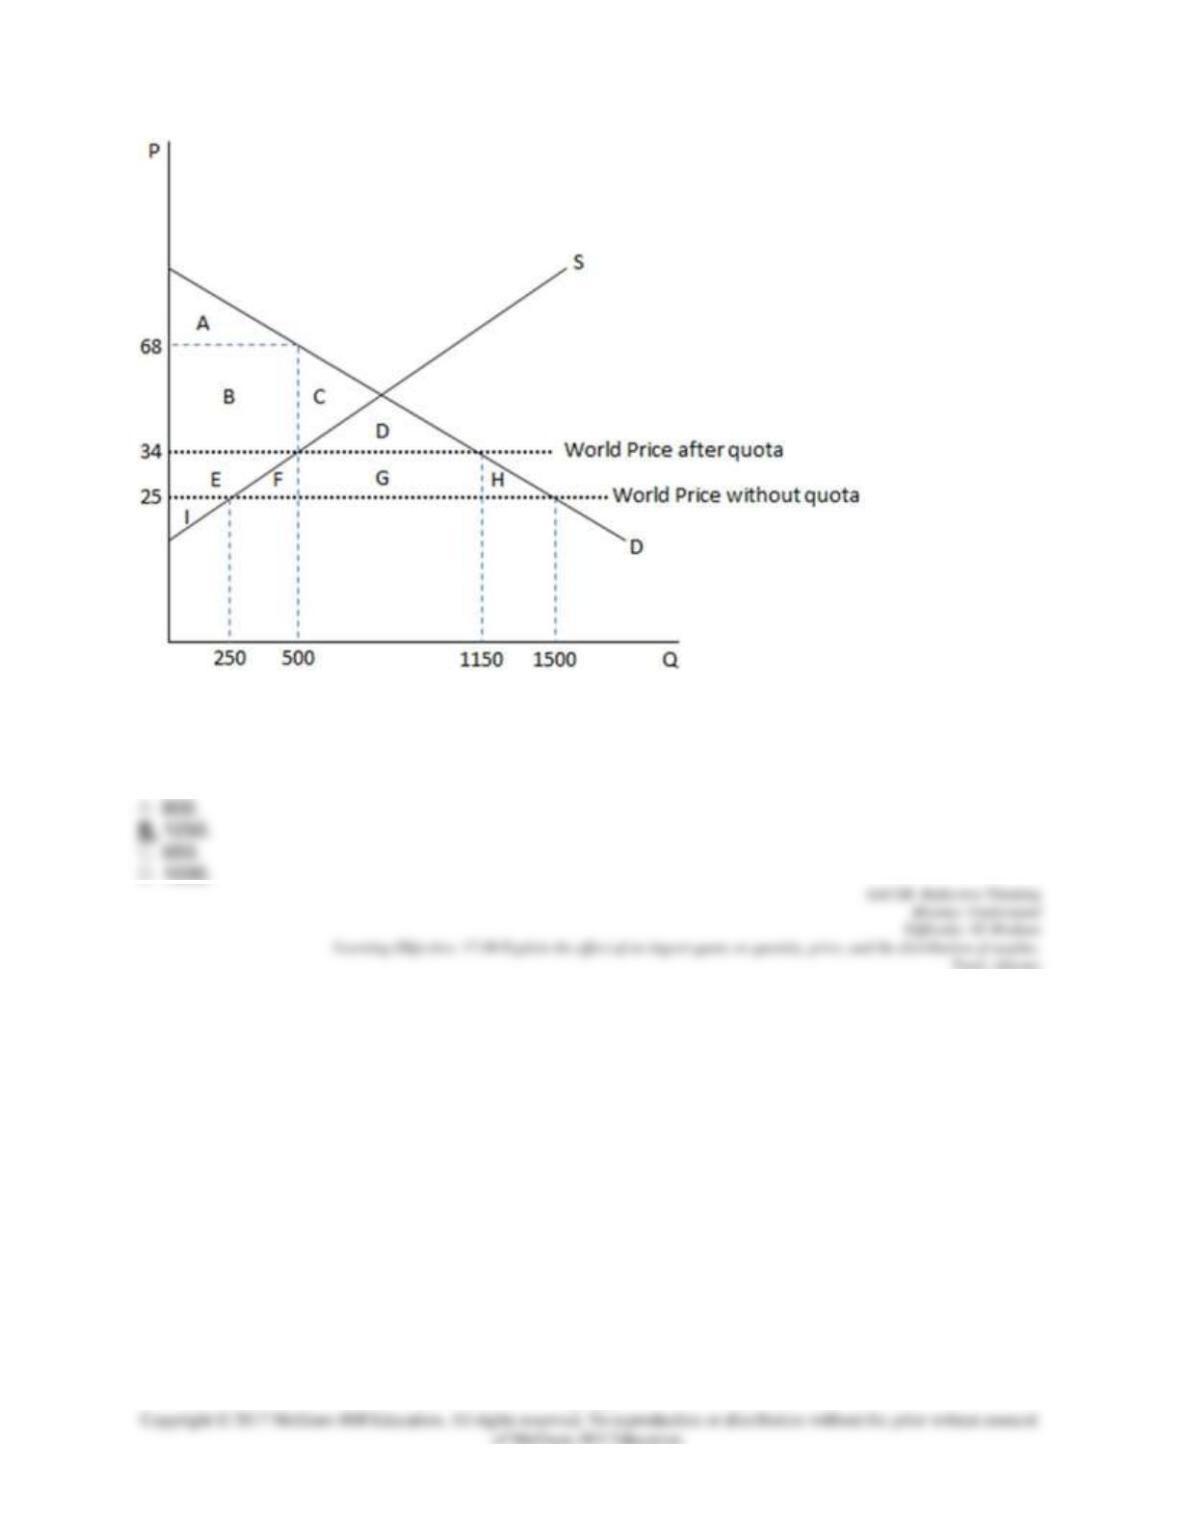
120. This graph demonstrates the domestic demand and supply for a good, as well as a quota and the
world price for that good.
17–70
According to the graph shown, when this economy is open to free trade without restriction, the amount
imported is:
121. This graph demonstrates the domestic demand and supply for a good, as well as a quota and the
world price for that good.
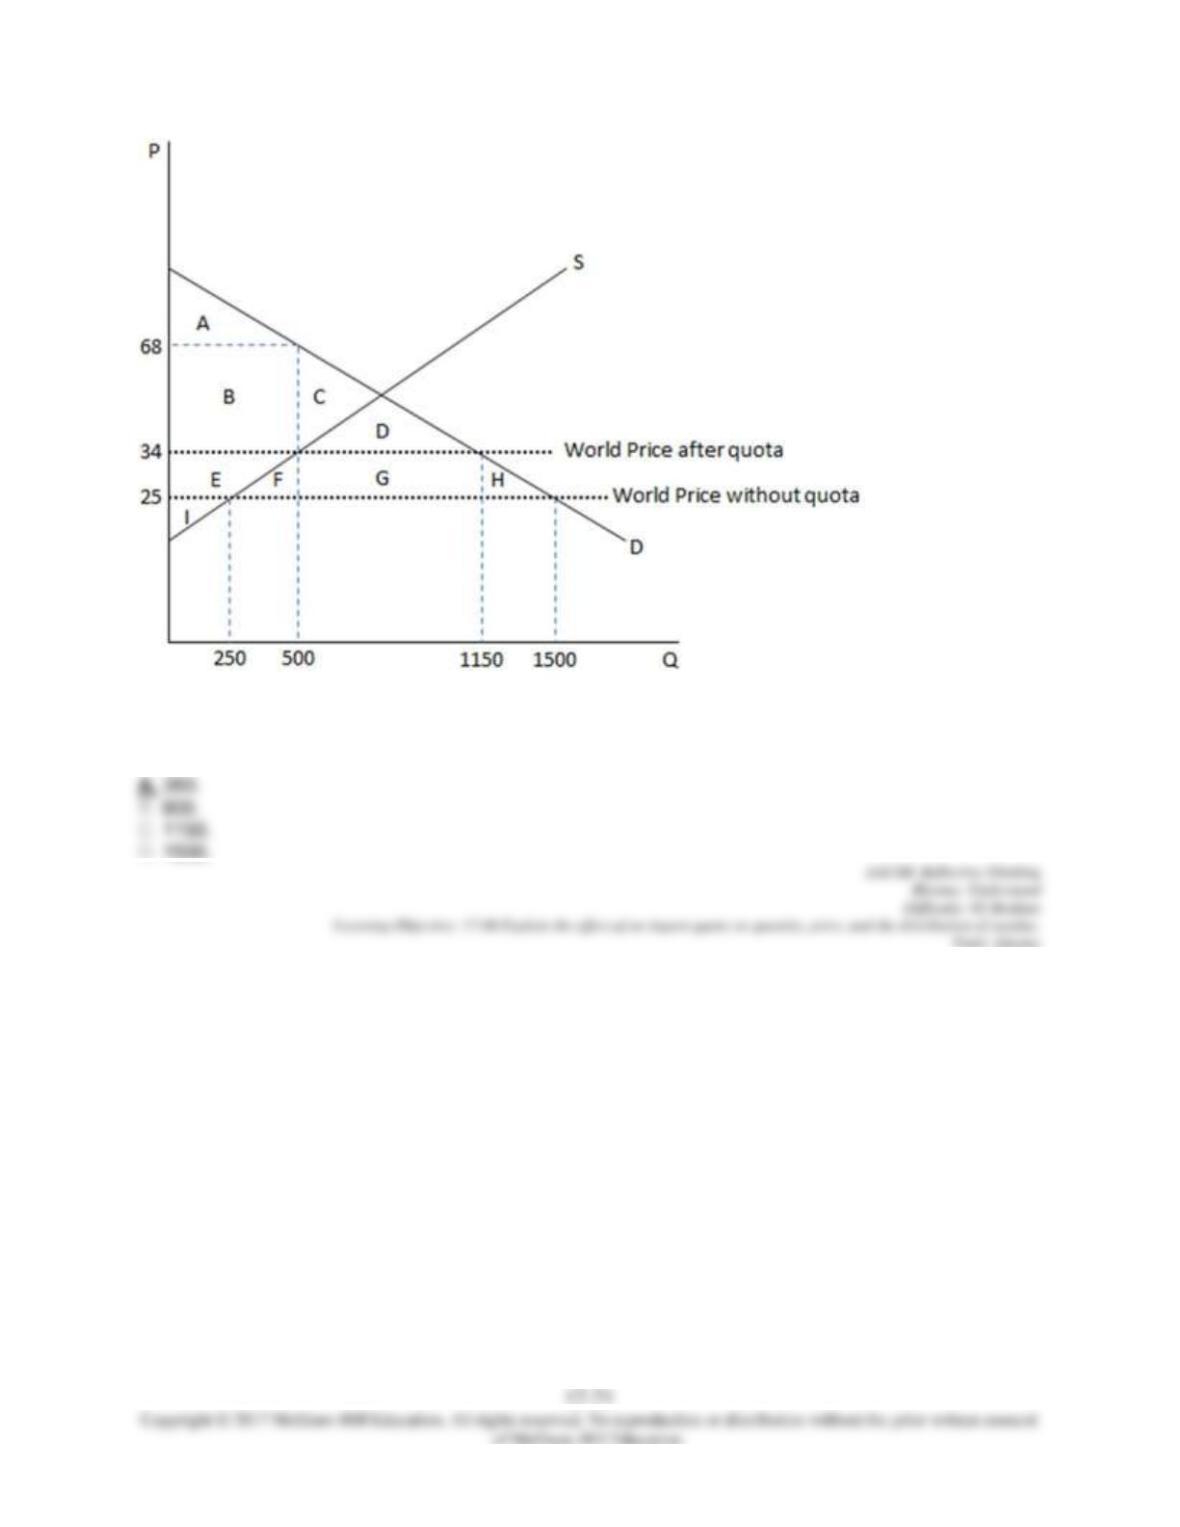
According to the graph shown, the government can restrict trade by imposing a quota of:
122. This graph demonstrates the domestic demand and supply for a good, as well as a quota and the
world price for that good.