120) The tables above show the marginal costs and benefits from production and consumption of
paper. From this information we can see that there are
A) external costs of producing paper.
B) external benefits of producing paper.
C) no externalities in production of paper.
D) external costs from consuming paper.
121) The tables above show the marginal costs and benefits from production of paper. If the
market is perfectly competitive and unregulated, at the equilibrium level of output, the marginal
external cost is
A) zero
B) $10
C) $20
D) $30
122) The tables above show the marginal costs and benefits from production of paper. The
efficient level of output is ________ of paper.
A) 1,600 tons
B) 2,400 tons
C) 3,200 tons
D) 4,000 tons
123) The tables above show the marginal costs and benefits from production of paper. If the
market is perfectly competitive and unregulated, the
A) allocation of resources is efficient.
B) market equilibrium produces 800 tons more than the efficient amount.
C) market equilibrium produces 1,600 tons more than the efficient amount.
D) market equilibrium produces 800 tons less than the efficient amount.

124) The tables above show the marginal costs and benefits from production of paper. If the
market is perfectly competitive and unregulated, the efficient level of output
A) is achieved.
B) can be achieved by giving paper producers a subsidy.
C) can be achieved by imposing a Pigovian tax on paper producers.
D) cannot be achieved.
125) The tables above show the marginal costs and benefits from production of paper. If the
market is perfectly competitive and unregulated, the efficient amount of paper will be produced
by setting a Pigovian tax of
A) $5 per ton.
B) $10 per ton.
C) $20 per ton.
D) $40 per ton.
126) The tables above show the marginal costs and benefits from production of paper. If the
efficient level of output is achieved by imposing a tax on paper producers, the government
collects tax revenue equal to
A) $64,000.
B) $56,000.
C) $72,000.
D) $48,000.
127) In the figure above showing the costs and benefits of paper production, there is an
A) external cost associated with paper production.
B) external benefit associated with paper production.
C) external cost associated with paper consumption.
D) external benefit associated with paper consumption.
128) In the above figure, the competitive unregulated equilibrium is producing and consuming
________ tons of paper at a price of ________ per ton.
A) 100; $150
B) 100; $100
C) 100; $50
D) 200; $100
129) If the government regulates the market in the above figure in a way to achieve efficiency,
then ________ tons of paper will be produced and consumed.
A) 0
B) 100
C) 200
D) None of the above answers is correct.
130) The government can aid in reducing pollution by using a policy of cap-and-trade, which
means that
A) polluters are taxed on the amount of pollution they discharge.
B) emission charges are established by the government.
C) each polluter is assigned a pollution limit and is given tradable permits that allow this amount
of pollution.
D) only some producers pollute and the others go out of business.
131) ________ played a large role is removing lead from the atmosphere in the United States.
A) Pigovian taxes
B) The Coase Theorem
C) Emissions charges
D) Marketable permits
132) There are two industries that emit sulfur dioxide. The government decides to use a cap-and-
trade policy by issuing permits for pollution. If Harry’s industry has a higher marginal cost of
reducing sulfur dioxide than does Joe’s industry, ________.
A) the cap-and-trade policy will not make the amount of pollution efficient
B) Joe’s industry will sell permits to Harry’s industry
C) Harry’s industry will sell permits to Joe’s industry
D) Harry’s industry and Joe’s industry will emit the same quantity of sulfur dioxide
133) With marketable permits to pollute, efficiency can be obtained if
A) the regulator knows the marginal cost schedule of every firm.
B) firms with low marginal costs of eliminating pollution sell their permits.
C) firms with low marginal costs of eliminating pollution buy up more permits.
D) only one firm gets the permits to pollute.
134) Both firm A and firm B emit 300 tons of pollution. Suppose both firm A and firm B have
permits that allow each to emit 100 tons of pollution. If it costs $5,000 for firm A to eliminate
100 tons of pollution and it costs firm B $6,000 to eliminate 100 tons of pollution, then
A) firm B will sell its permits to firm A for a price above $6,000.
B) firm A will sell its permits to firm B for a price below $6,000.
C) firm A will sell its permits to firm B for a price above $6,000.
D) firm B will sell its permits to firm A for a price below $6,000.
135) If the government creates a system of pollution permits, firms with low marginal costs of
reducing pollution will
A) buy permits from other firms.
B) sell permits to other firms.
C) hold on to the permits they have been issued and not attempt to buy more.
D) not be issued permits.
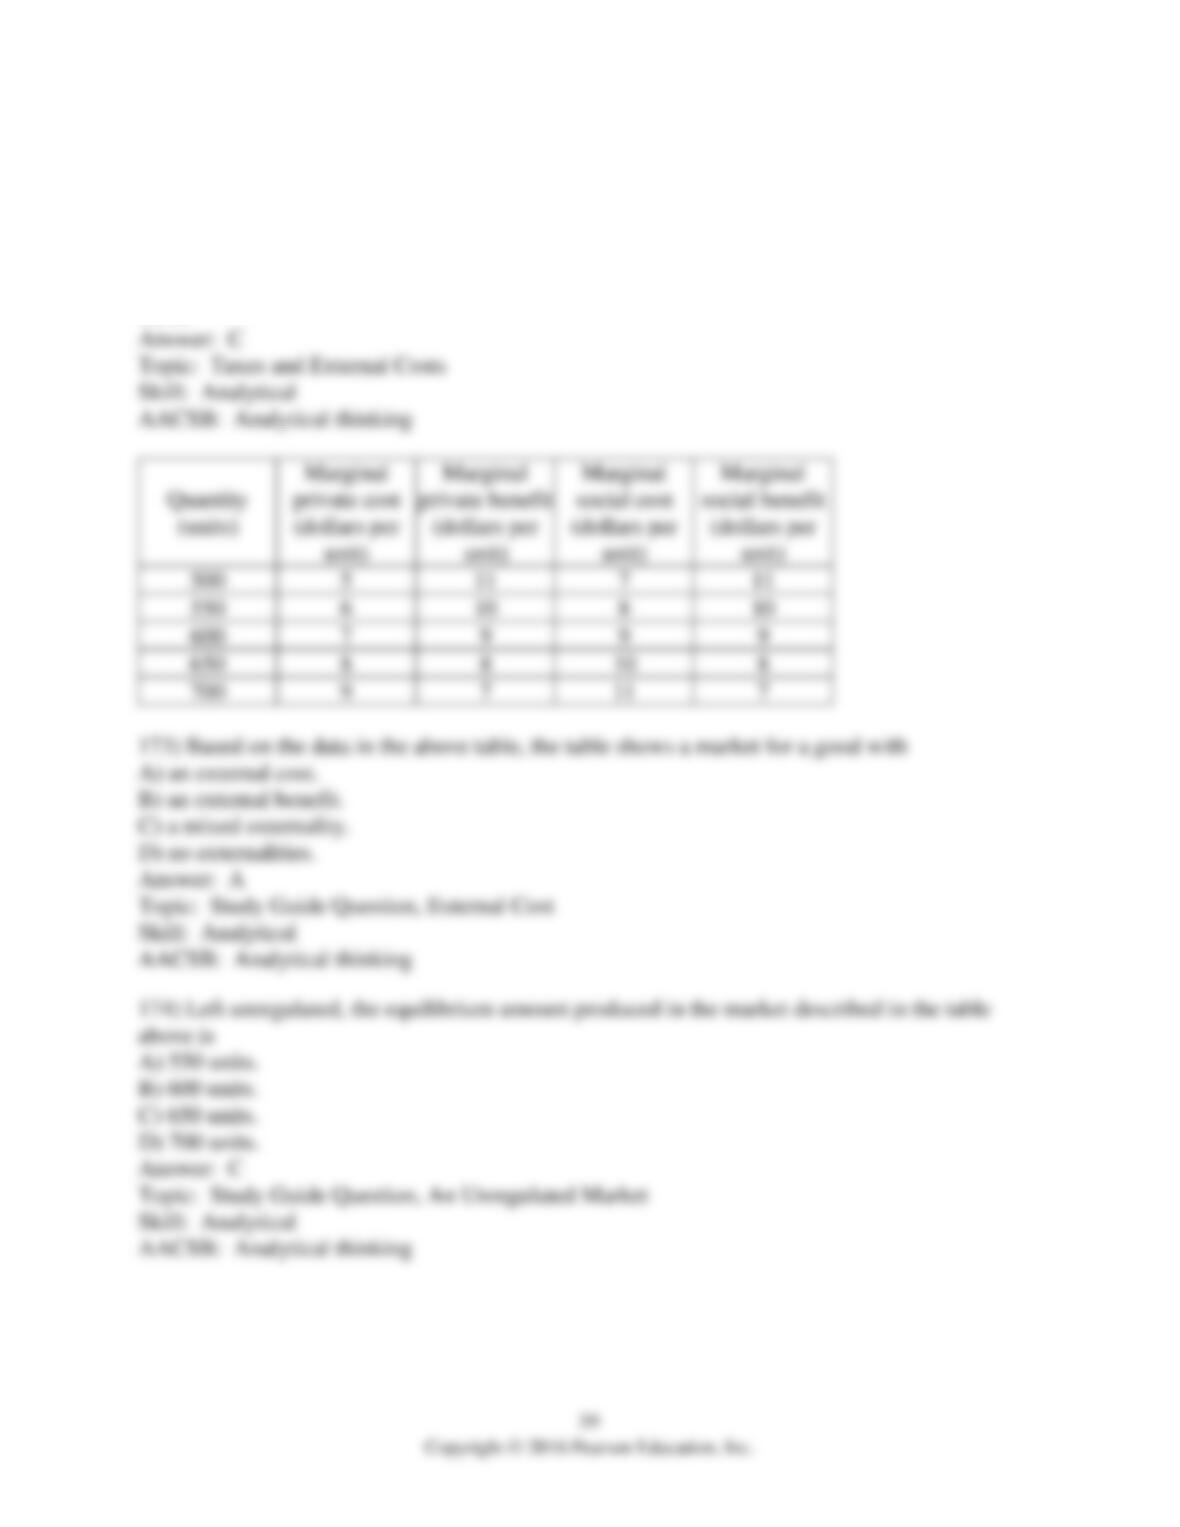
Quantity
(tons)
Marginal
private benefit
(dollars per
ton)
Marginal
private cost
(dollars per
ton)
Marginal
social cost
(dollars per
ton)
1,000
140
50
80
2,000
120
60
90
3,000
100
70
100
4,000
80
80
110
5,000
60
90
120
6,000
40
100
130
136) The above table shows the marginal benefits and costs from production of fertilizer. There
are no external benefits. Based on the data in the table, production of fertilizer has
A) external benefits.
B) external costs.
C) no externalities.
D) constant returns to scale.
137) The above table shows the marginal benefits and costs from production of fertilizer. There
are no external benefits. If the market is perfectly competitive and unregulated, the equilibrium
output will be
A) 2,000 tons.
B) 3,000 tons.
C) 4,000 tons.
D) 5,000 tons.
138) The above table shows the marginal benefits and costs from production of fertilizer. There
are no external benefits. If the market is perfectly competitive and unregulated, at the equilibrium
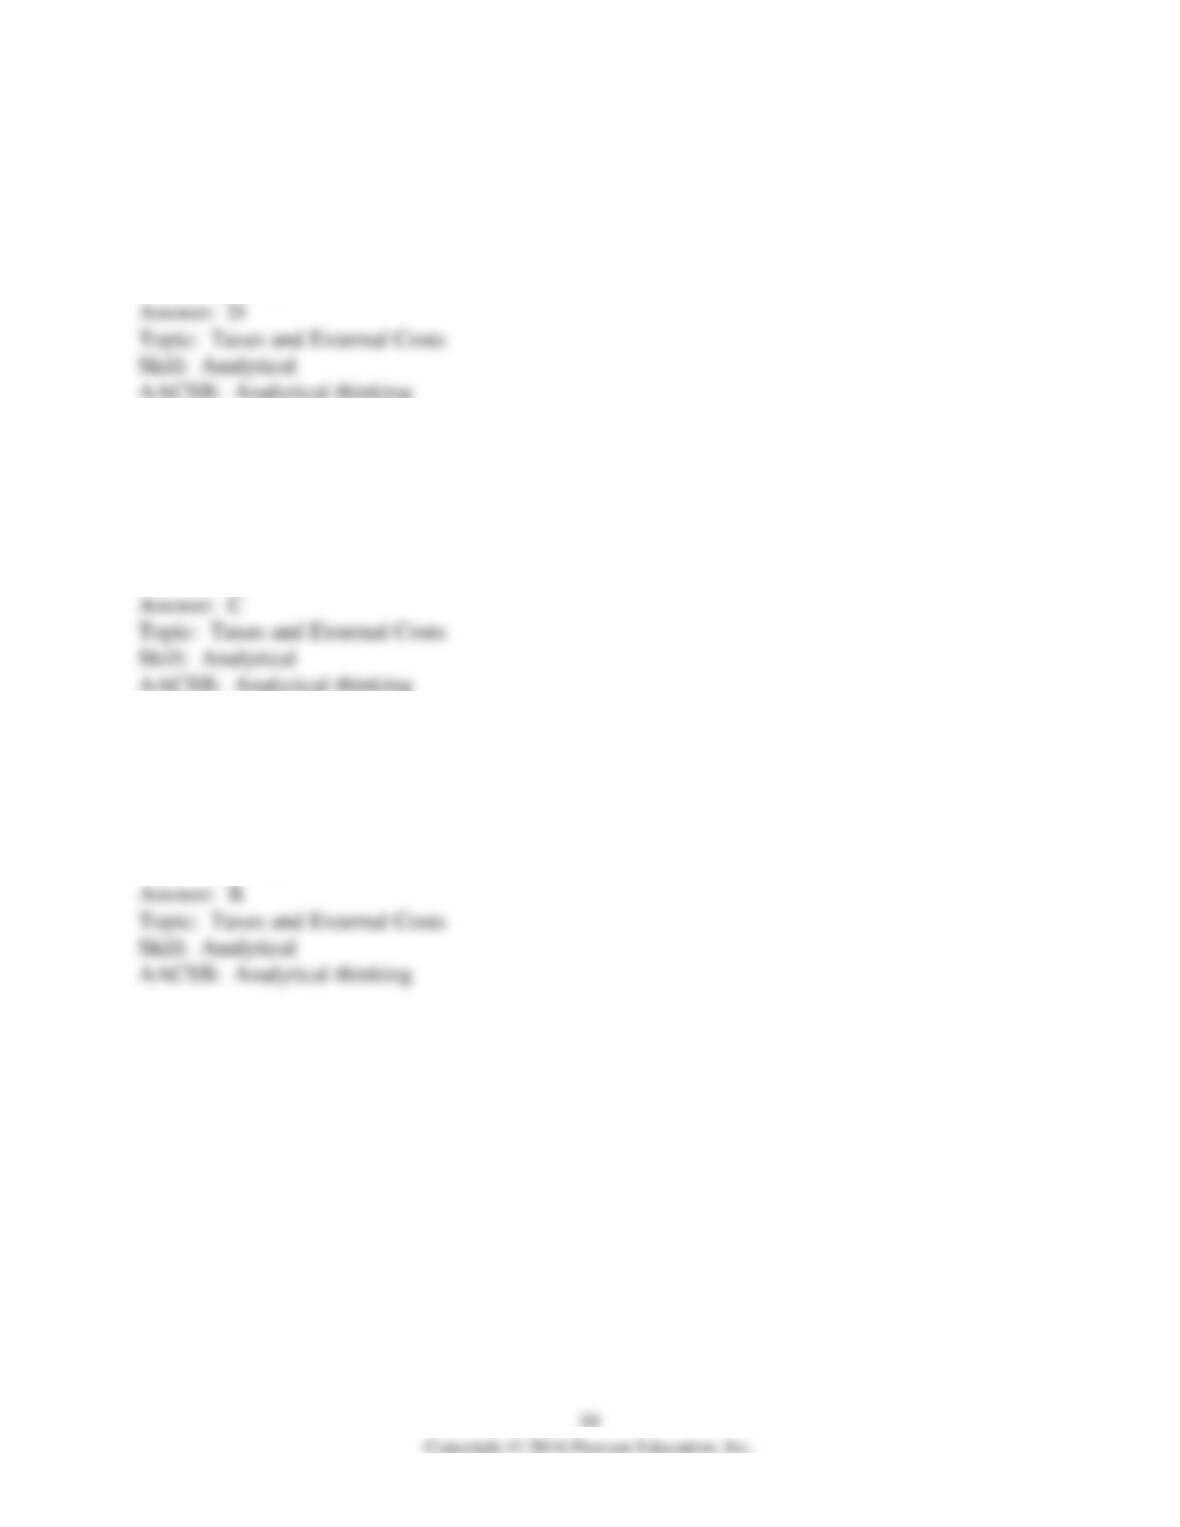
level of output,
A) resource allocation is efficient.
B) resource allocation is inefficient.
C) too few tons of fertilizer are produced.
D) consumers must pay too high a price for fertilizer.
139) The above table shows the marginal benefits and costs from production of fertilizer. There
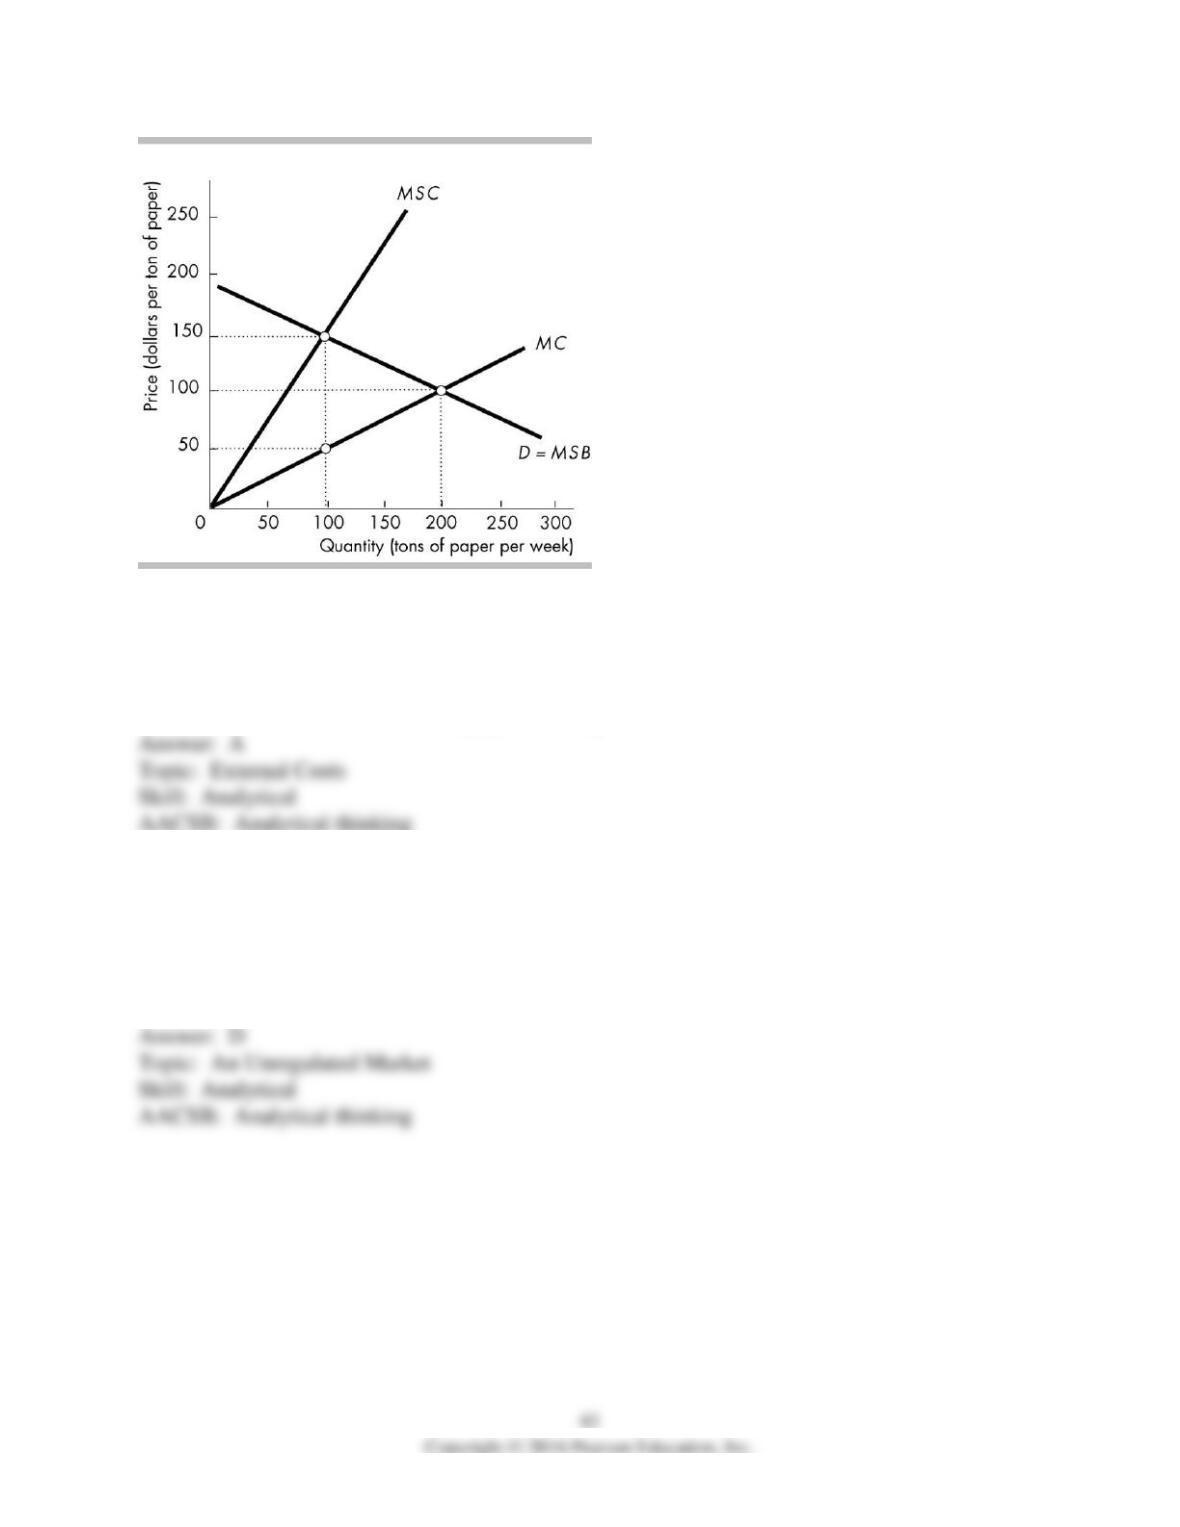
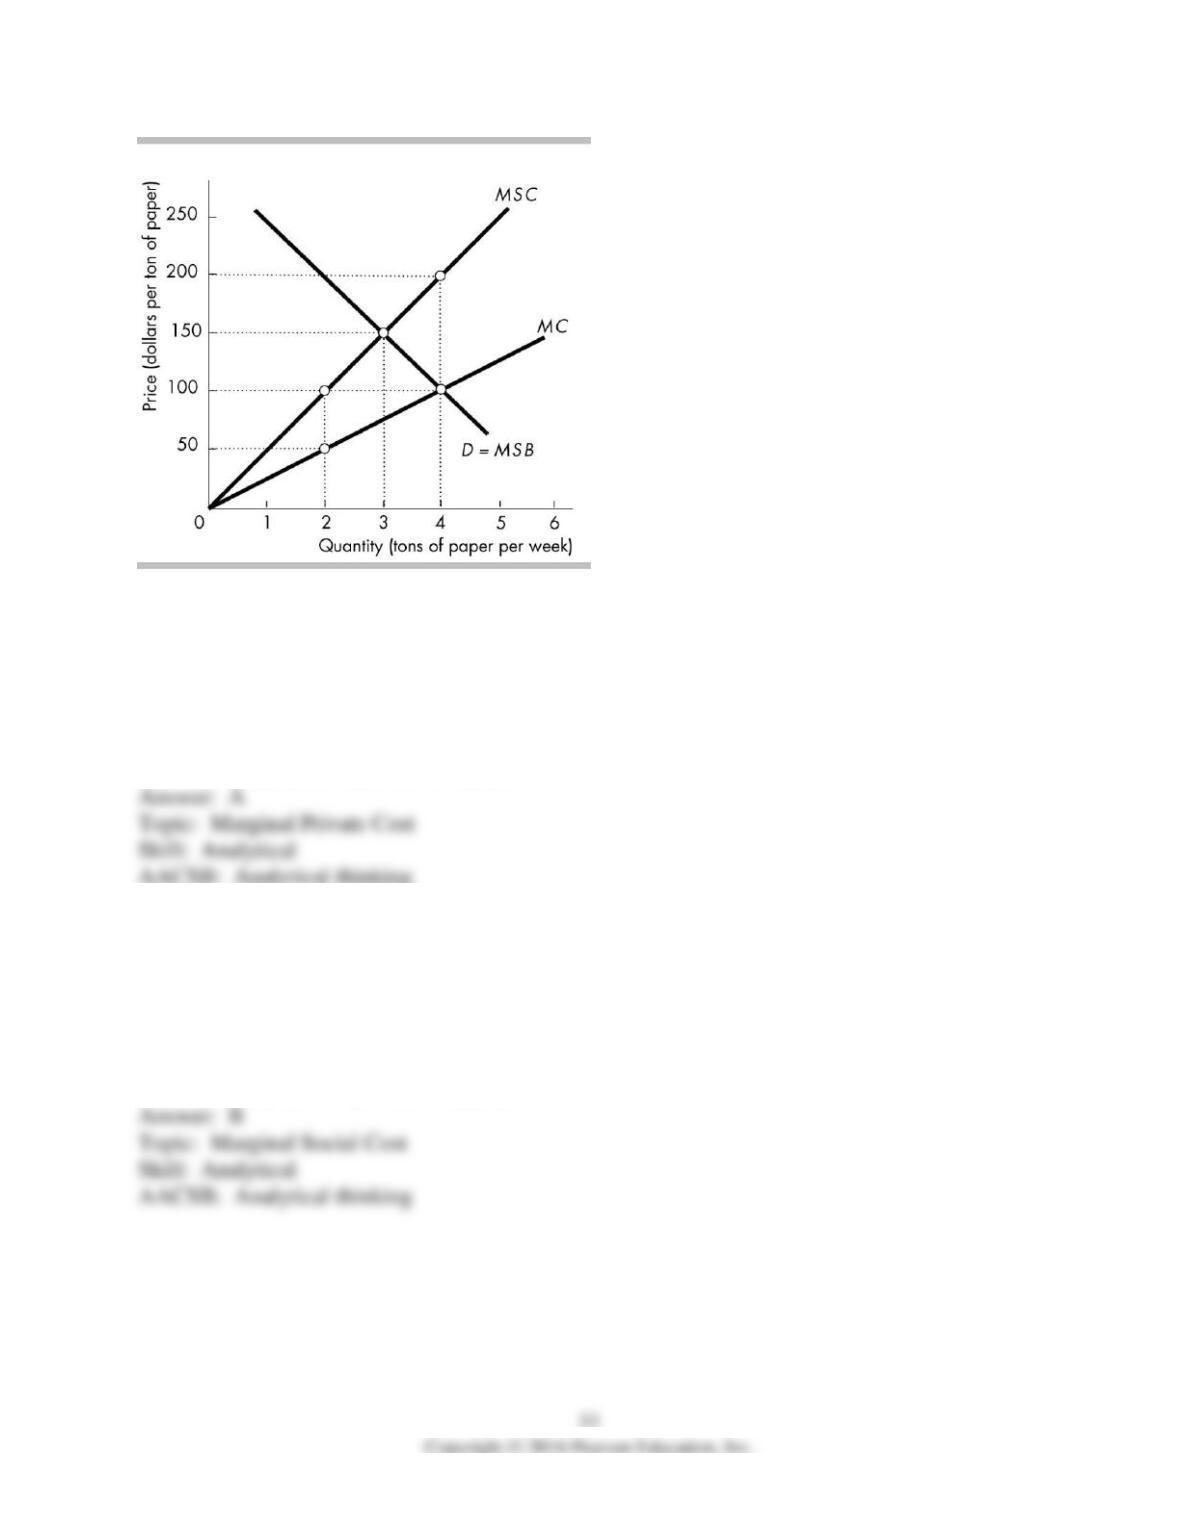
are no external benefits. If the market is perfectly competitive and unregulated, the equilibrium
price per ton will be
A) $70.
B) $80.
C) $90.
D) $100.
140) The above table shows the marginal benefits and costs from production of fertilizer. There
are no external benefits. If the market is perfectly competitive and unregulated, at the equilibrium
output, the
A) marginal private cost exceeds the marginal private benefit.
B) marginal private cost is less than the marginal private benefit.
C) marginal social cost equals the marginal private benefit.
D) marginal social cost is greater than the marginal private benefit.
141) The above table shows the marginal benefits and costs from production of fertilizer. There
are no external benefits. If the market is perfectly competitive and unregulated, at the equilibrium
level of output, the marginal external cost per ton is
A) zero.
B) $30.
C) $80.
D) $110.
142) The above table shows the marginal benefits and costs from production of fertilizer. There
are no external benefits. The efficient level of output is
A) 2,000 tons.
B) 3,000 tons.
C) 4,000 tons.
D) 5,000 tons.
143) The above table shows the marginal benefits and costs from production of fertilizer. There
are no external benefits. If the market is perfectly competitive and unregulated, the efficient level
of output could be achieved by setting a per ton tax of
A) zero.
B) $30.
C) $80.
D) $110.
144) In the figure above, if the market is unregulated, the output will be
A) zero.
B) 50 units.
C) 150 units.
D) 250 units.
145) In the figure above, if the market is unregulated,
A) more than the efficient amount of output will be produced.
B) less than the efficient amount of output will be produced.
C) the allocation of resources will be efficient because the efficient amount of output will be
produced.
D) the deadweight loss will be zero.
146) In the figure above, if the market is unregulated, the price will be
A) $250 per unit.
B) $200 per unit.
C) $150 per unit.
D) $100 per unit.
147) In the figure above, if the market is unregulated, then at the equilibrium output level, the
marginal social cost of production
A) is less than the marginal benefit to consumers.
B) exceeds the marginal benefit to consumers.
C) equals the marginal benefit to consumers.
D) equals the marginal private cost of production.
148) In the figure above, if the market is unregulated, at the equilibrium output the marginal
external cost is
A) zero.
B) $250 per unit.
C) $150 per unit.
D) $100 per unit.
149) In the figure above, in order to promote an efficient allocation of resources, the government
could impose a tax equal to
A) zero.
B) $250 per unit.
C) $150 per unit.
D) $100 per unit.
150) In the figure above, if an excise tax is imposed that generates an efficient allocation of
resources, then the amount of output will be
A) zero.
B) 50 units.
C) 150 units.
D) 250 units.
151) In the figure above, if a tax is imposed that generates an efficient allocation of resources,
then consumers will pay a price of
A) $250 per unit.
B) $200 per unit.
C) $150 per unit.
D) $100 per unit.
152) In the figure above, S is the supply curve and D is the demand curve in the unregulated,
competitive market for gasoline in Motorland. The external cost of gasoline is constant at $1.50
per gallon. The unregulated, competitive market for gasoline in Motorland
A) produces the efficient quantity of gasoline.
B) overproduces by 0.2 million gallons of gasoline a month.
C) underproduces by 0.1 million gallons of gasoline a month.
D) overproduces by 0.1 million gallons of gasoline a month.
153) The efficient quantity of gasoline to sell in Motorland is
A) 1.7 million gallons per month.
B) 1.8 million gallons per month.
C) 1.6 million gallons per month.
D) 1.9 million gallons per month.
154) When the market for gasoline in Motorland is in equilibrium, the market price of gasoline is
________ the marginal social cost.
A) $1.50 above
B) $1.50 below
C) equal to
D) $1.20 above
155) When the market for gasoline in Motorland is in equilibrium, the deadweight loss is
A) $37,500 per month.
B) $150,000 per month.
C) $75,000 per month.
D) zero.
156) Suppose Motorland’s government imposes a tax of $1.50 per gallon of gasoline sold. With
the tax, the market will
A) underproduce by 0.2 million gallons of gasoline a month.
B) underproduce by 0.1 million gallons of gasoline a month.
C) overproduce by 0.1 million gallons of gasoline a month.
D) produce the efficient quantity of gasoline.
157) Suppose Motorland’s government imposes a tax of $1.50 per gallon of gasoline sold. With
the tax, when the market is in equilibrium, the deadweight loss is
A) zero.
B) $37,500 per month.
C) $150,000 per month.
D) $75,000 per month.
158) The figure above shows the costs associated with producing paper. When paper is
produced, there is some pollution runoff into a lake. The marginal private cost when output
equals 2 tons of paper per week equals
A) $50 per ton
B) $100 per ton.
C) $150 per ton.
D) None of the above answers is correct.
159) The figure above shows the costs associated with producing paper. When paper is
produced, there is some pollution runoff into a lake. The marginal private cost borne by the firms
plus the people who enjoy a clean lake when output equals 2 tons of paper per week equals
A) $50 per ton.
B) $100 per ton.
C) $150 per ton.
D) None of the above answers is correct.
160) The figure above shows the costs associated with producing paper. When paper is
produced, there is some pollution runoff into a lake. Without regulation, ________ tons of paper
will be produced and the price will be ________ per ton.
A) 3; $150
B) 4; $100
C) 4; $200
D) None of the above answers is correct.
161) The figure above shows the costs associated with producing paper. When paper is
produced, there is some pollution runoff into a lake. If paper production is 4 tons per week, the
outcome is ________.
A) efficient because marginal benefit equals marginal private cost
B) efficient because private and external costs are accounted for
C) inefficient because only marginal external benefits are accounted for
D) inefficient because marginal social cost exceeds marginal social benefit
162) The figure above shows the costs associated with producing paper. When paper is
produced, there is some pollution runoff into a lake. According to the Coase Theorem, if the
transactions costs are low and there are only a few people involved, the output will equal
________ tons of paper if ________ own the lake.
A) 3; only the lakeside residents
B) 3; either the firms or lakeside residents
C) 4; the firms
D) 4; either the firms or lakeside residents
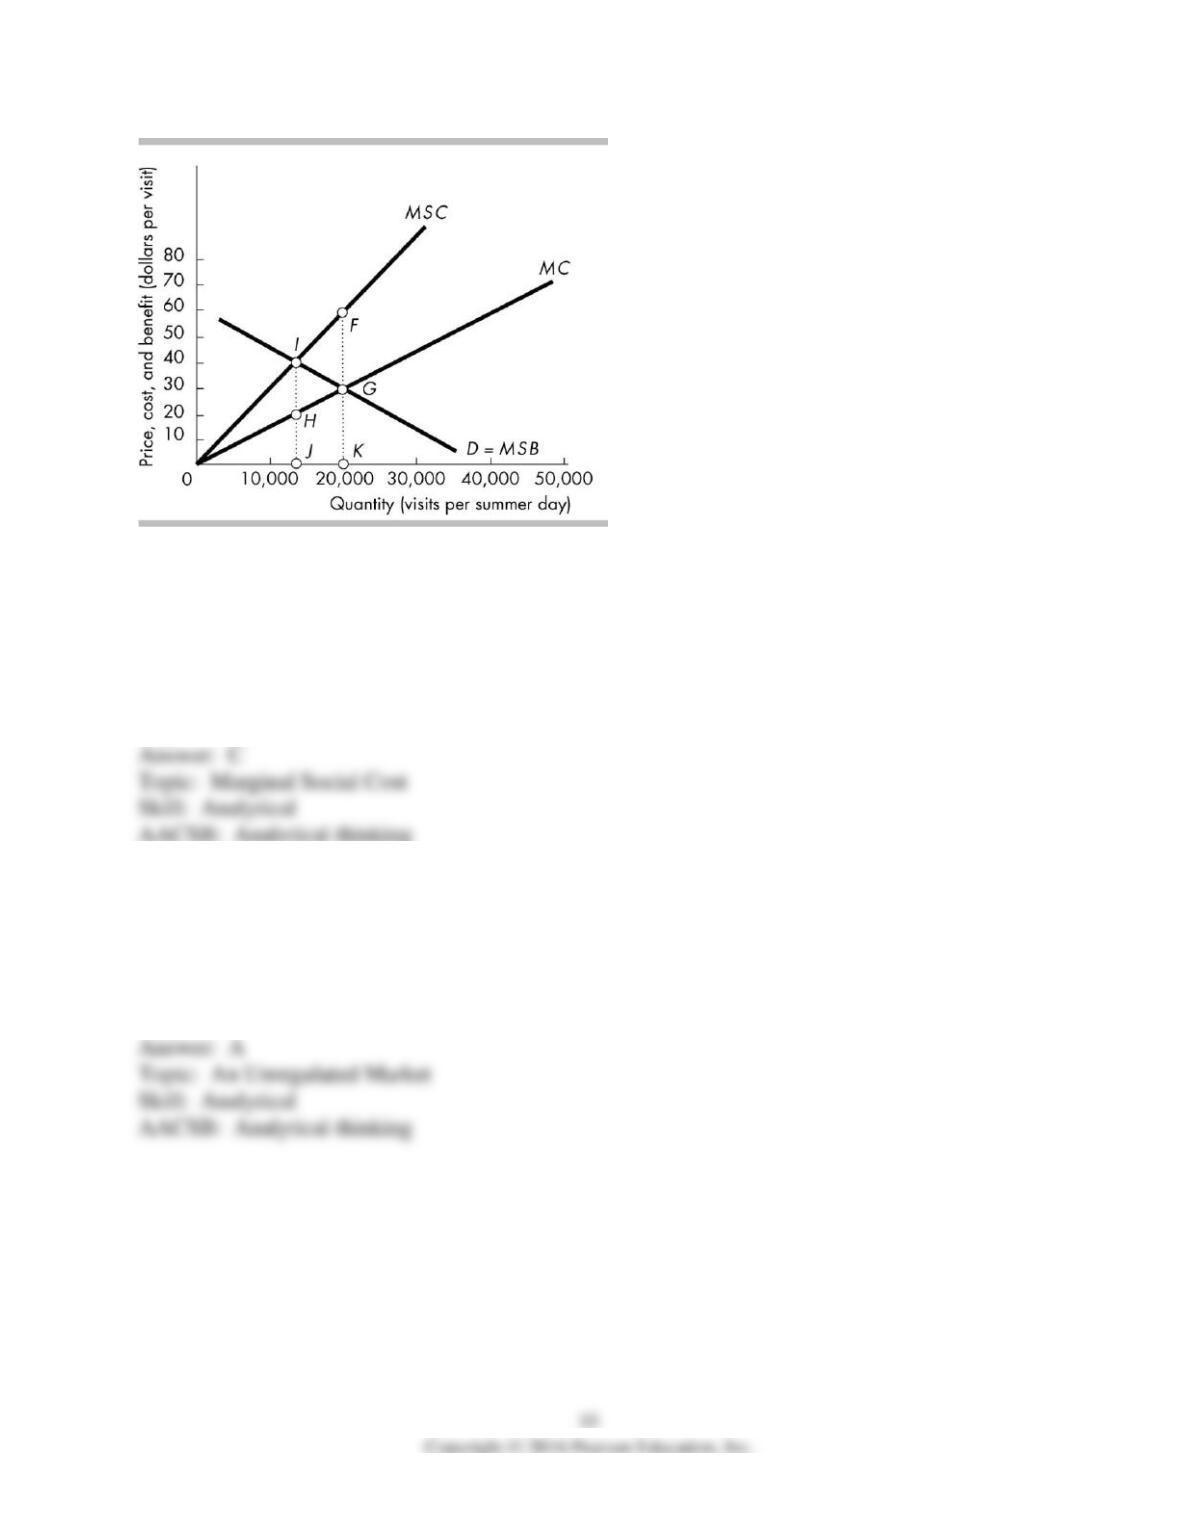
163) The figure above illustrates the problem of overcrowding and external costs experienced
during the summer months in the state park. If the market is unregulated, in equilibrium the
external cost of visiting the state park is given by the distance between
A) points H and G.
B) points I and F.
C) points F and G.
D) points G and K.
164) The figure above illustrates the problem of overcrowding and external costs experienced
during the summer months in the state park. The competitive equilibrium is at
A) point G.
B) point H.
C) point I.
D) point J.
165) The figure above illustrates the problem of overcrowding and external costs experienced
during the summer months in the state park. An efficient allocation of resources occurs at
A) point F.
B) point G.
C) point H.
D) point I.
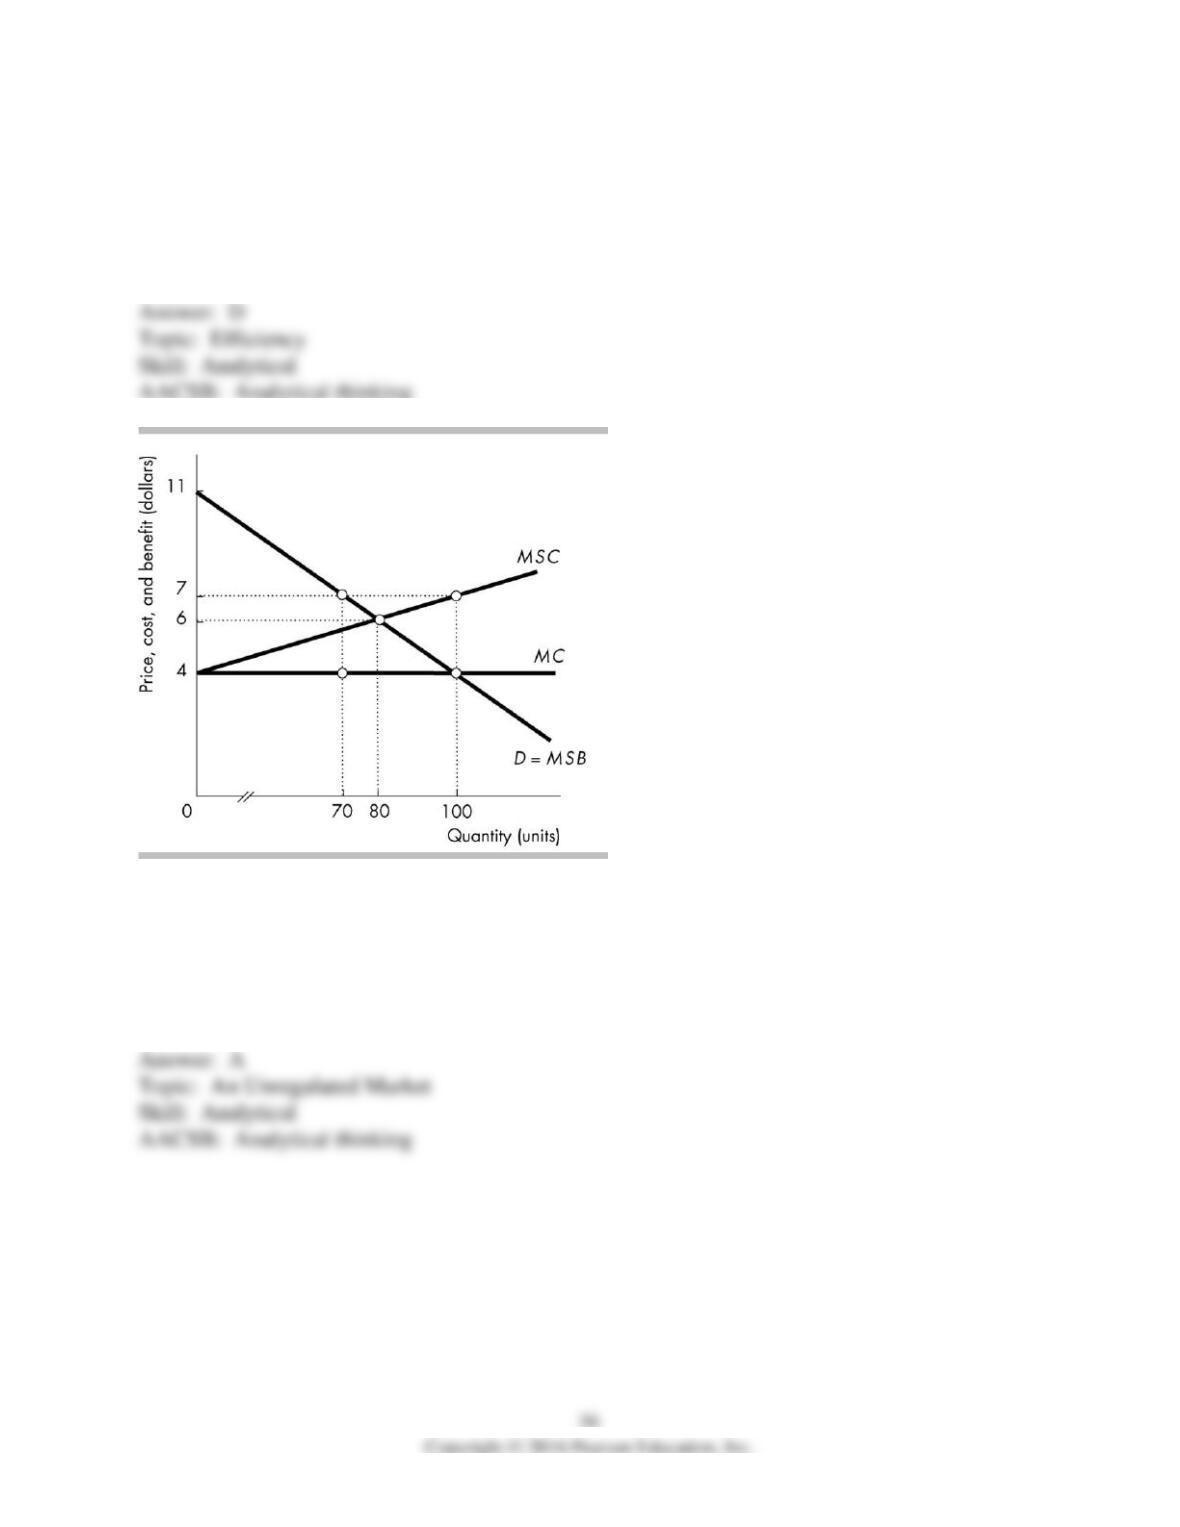
166) In the above figure, if no government intervention occurs, at the unregulated competitive
market equilibrium, the marginal cost of the externality is ________ per unit.
A) $3
B) $4
C) $6
D) $7
167) In the above figure, if the market is unregulated, the equilibrium quantity is
A) 0 units.
B) 70 units.
C) 80 units.
D) 100 units.
168) In the above figure, the efficient quantity is
A) 0 units.
B) 70 units.
C) 80 units.
D) 100 units.
169) In the above figure, in order to achieve efficiency, a tax of ________ per unit is needed.
A) $3
B) $6
C) $0
D) $2
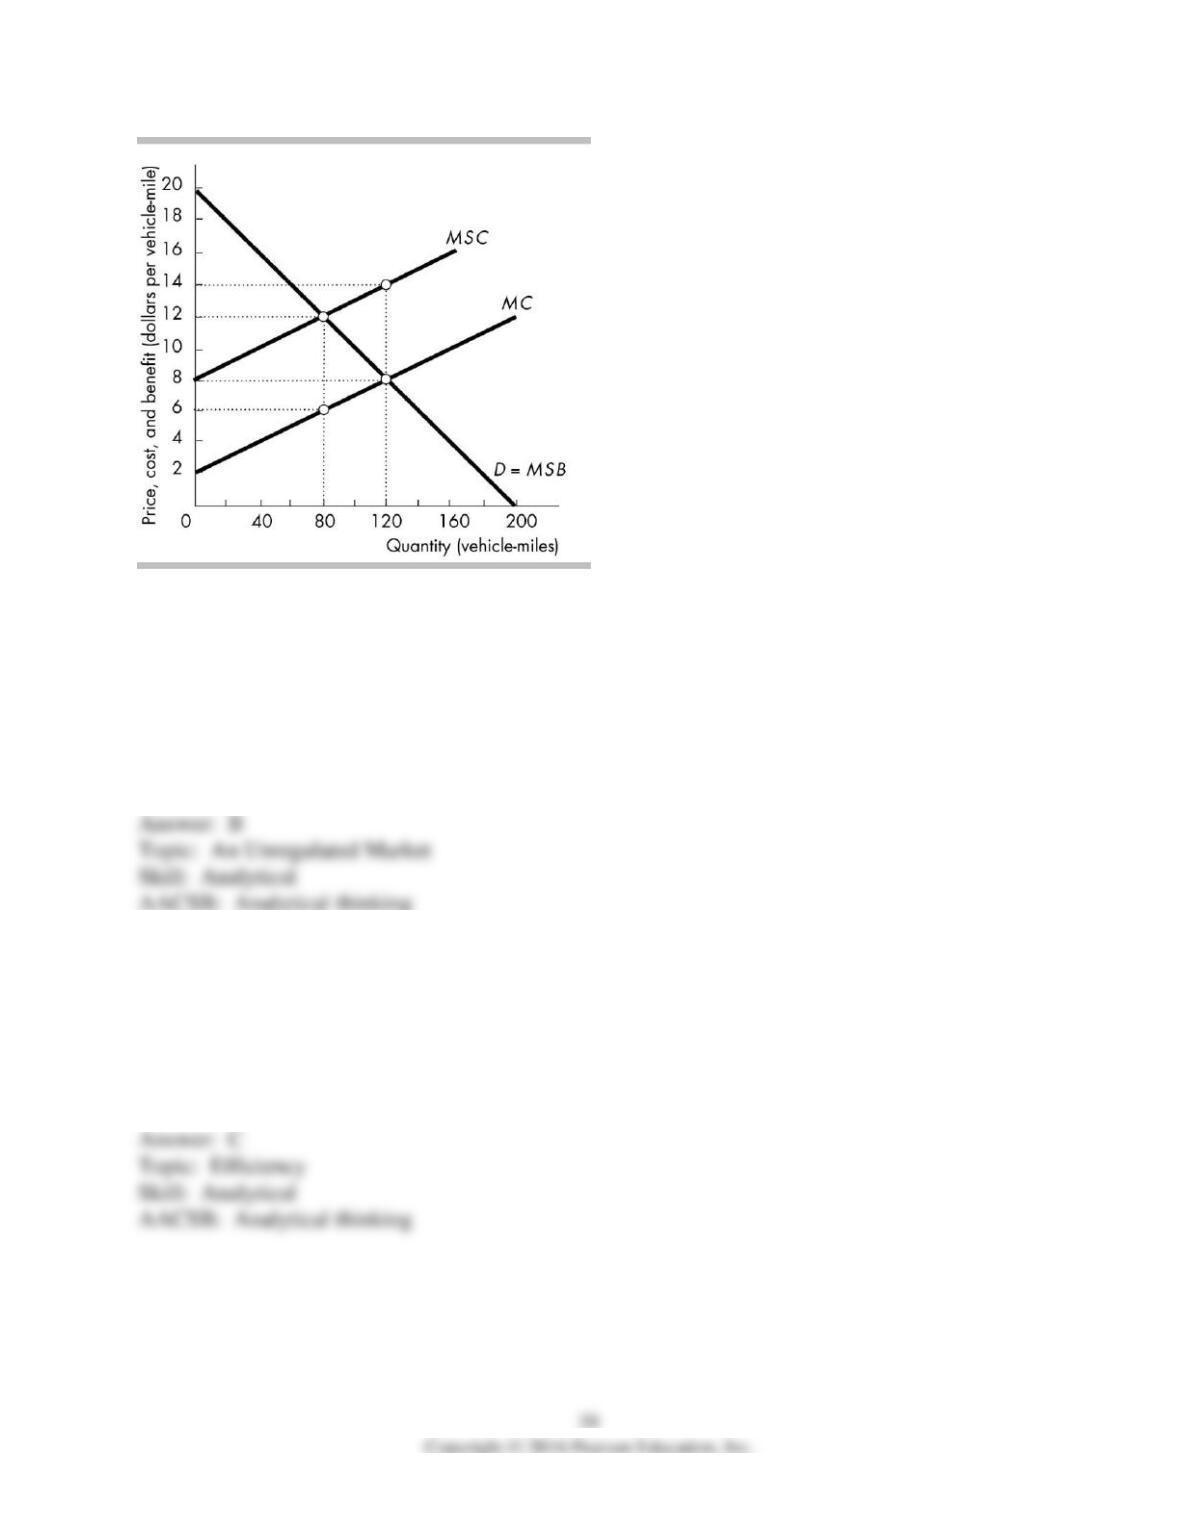
170) The figure above shows the market for transportation services, which produces an external
cost due to the air pollution that is created. If the market for transportation services is
competitive and unregulated, the equilibrium quantity is ________ and the equilibrium price is
________.
A) 120; $14
B) 120; $8
C) 80; $12
D) 80; $6
171) The figure above shows the market for transportation services, which produces an external
cost due to the air pollution that is created. The efficient quantity of transportation services is
________ and the corresponding price is ________.
A) 120; $14
B) 120; $8
C) 80; $12
D) 80; $6
172) The figure above shows the market for transportation services, which produces an external
cost due to the air pollution that is created. Suppose that the government decides to introduce a
pollution tax. What is the tax per vehicle mile that will achieve the efficient outcome?
A) $2
B) $4
C) $6
D) $8
Quantity
(units)
Marginal
private cost
(dollars per
unit)
Marginal
private benefit
(dollars per
unit)
Marginal
social cost
(dollars per
unit)
Marginal
social benefit
(dollars per
unit)
500
5
11
7
11
550
6
10
8
10
600
7
9
9
9
650
8
8
10
8
700
9
7
11
7
173) Based on the data in the above table, the table shows a market for a good with
A) an external cost.
B) an external benefit.
C) a mixed externality.
D) no externalities.
174) Left unregulated, the equilibrium amount produced in the market described in the table
above is
A) 550 units.
B) 600 units.
C) 650 units.
D) 700 units.
175) Based on the data in the table above, the efficient level of output equals
A) 550 units.
B) 600 units.
C) 650 units.
D) 700 units.
176) Based on the data in the above table, to assure that the efficient amount is produced the
government can
A) subsidize the suppliers $8 per unit.
B) subsidize the suppliers $2 per unit.
C) tax suppliers $2 per unit.
D) tax suppliers $8 per unit.
177) A copper ore refiner pollutes the water upstream from a brewery. These are the only two
parties involved. The transactions costs of reaching an agreement between the refinery and the
brewery are low. The amount of water pollution will be at the efficient level
A) only when the property right to the stream is assigned to the ore refinery.
B) only when the property right to the stream is assigned to the brewery.
C) when the property right to the stream is assigned to either the refinery or to the brewery.
D) when no one has clear property rights.