17–41
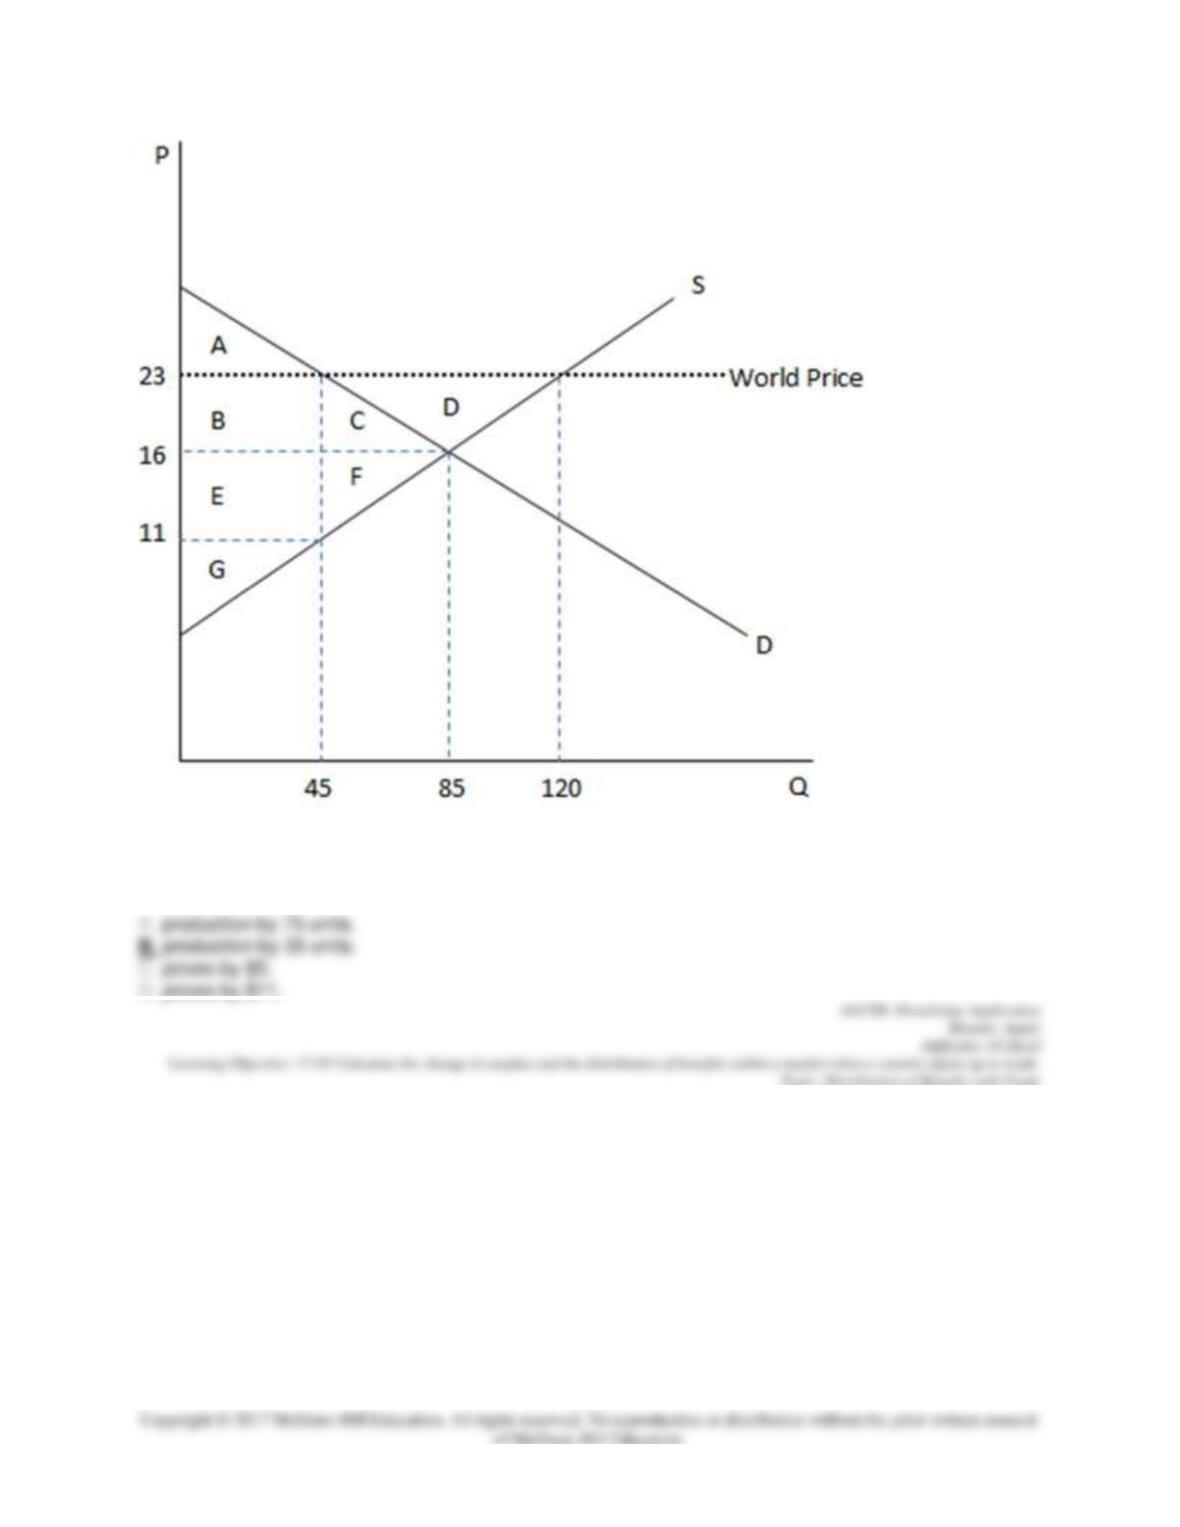
According to the graph shown, if this economy were to open to trade, domestic producers would increase:
76. This graph demonstrates the domestic demand and supply for a good, as well as the world price for
that good.
17–42
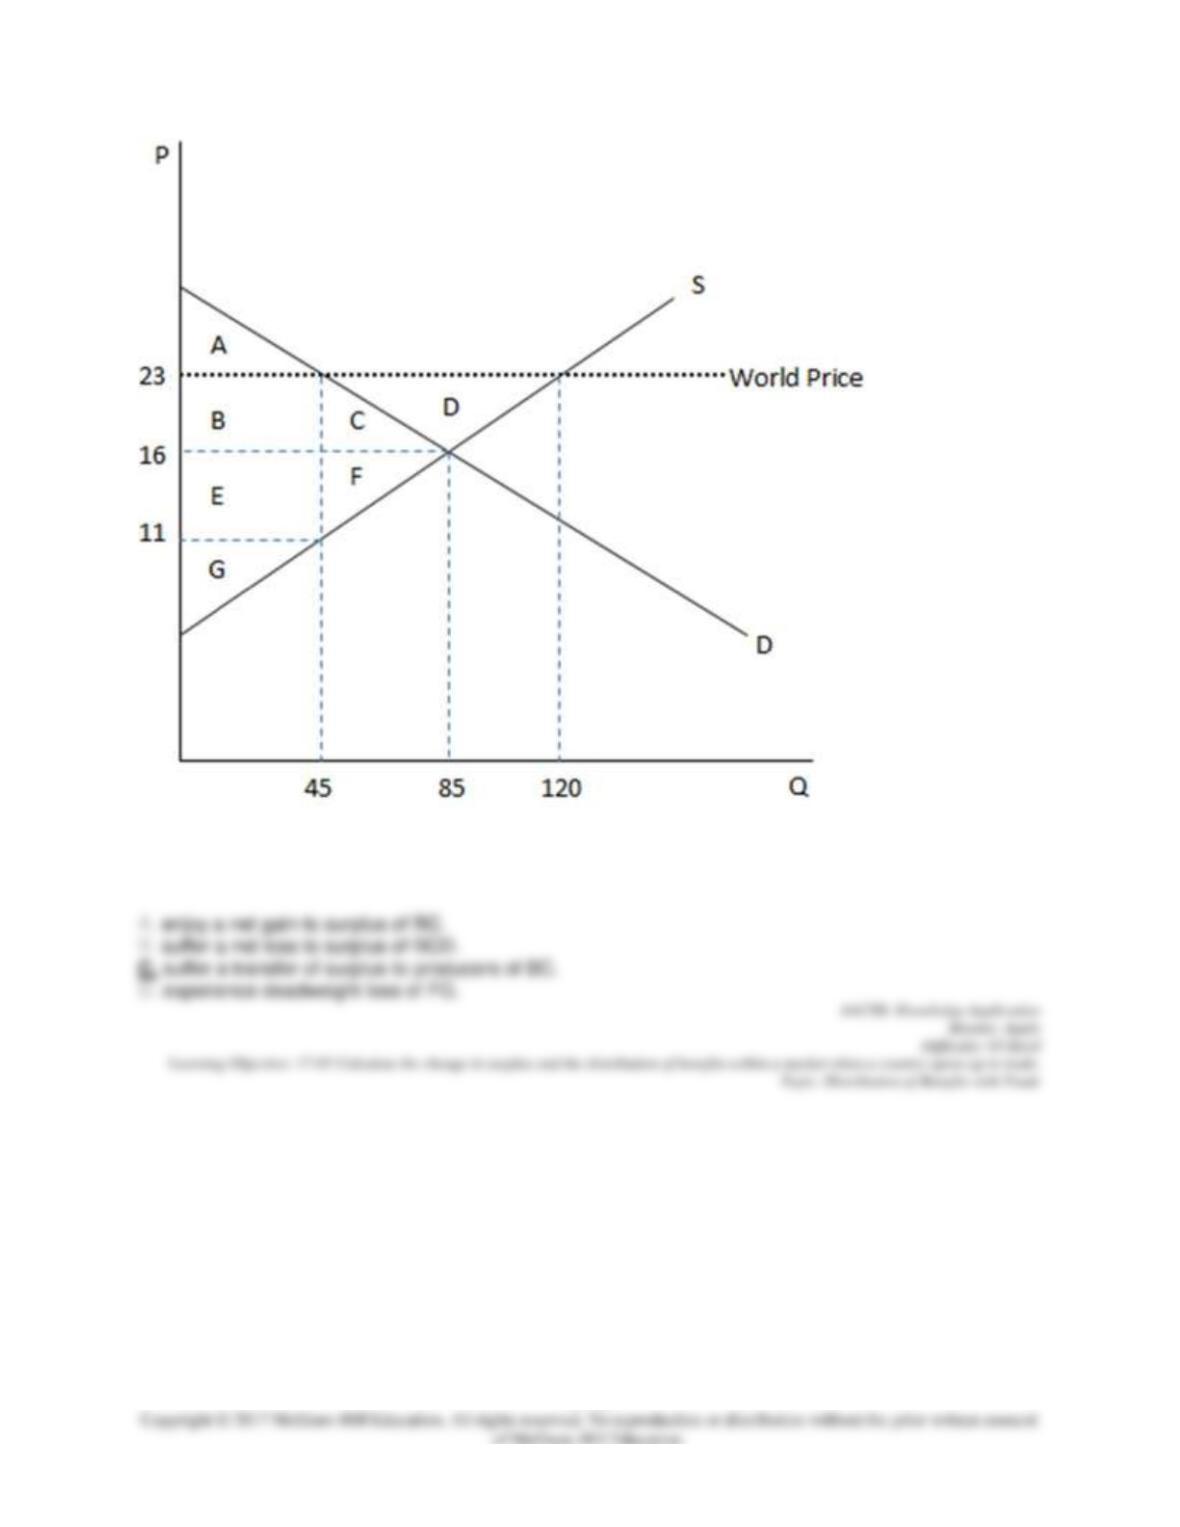
According to the graph shown, if this economy were to open to trade, domestic producers would increase:
77. This graph demonstrates the domestic demand and supply for a good, as well as the world price for
that good.
17–43
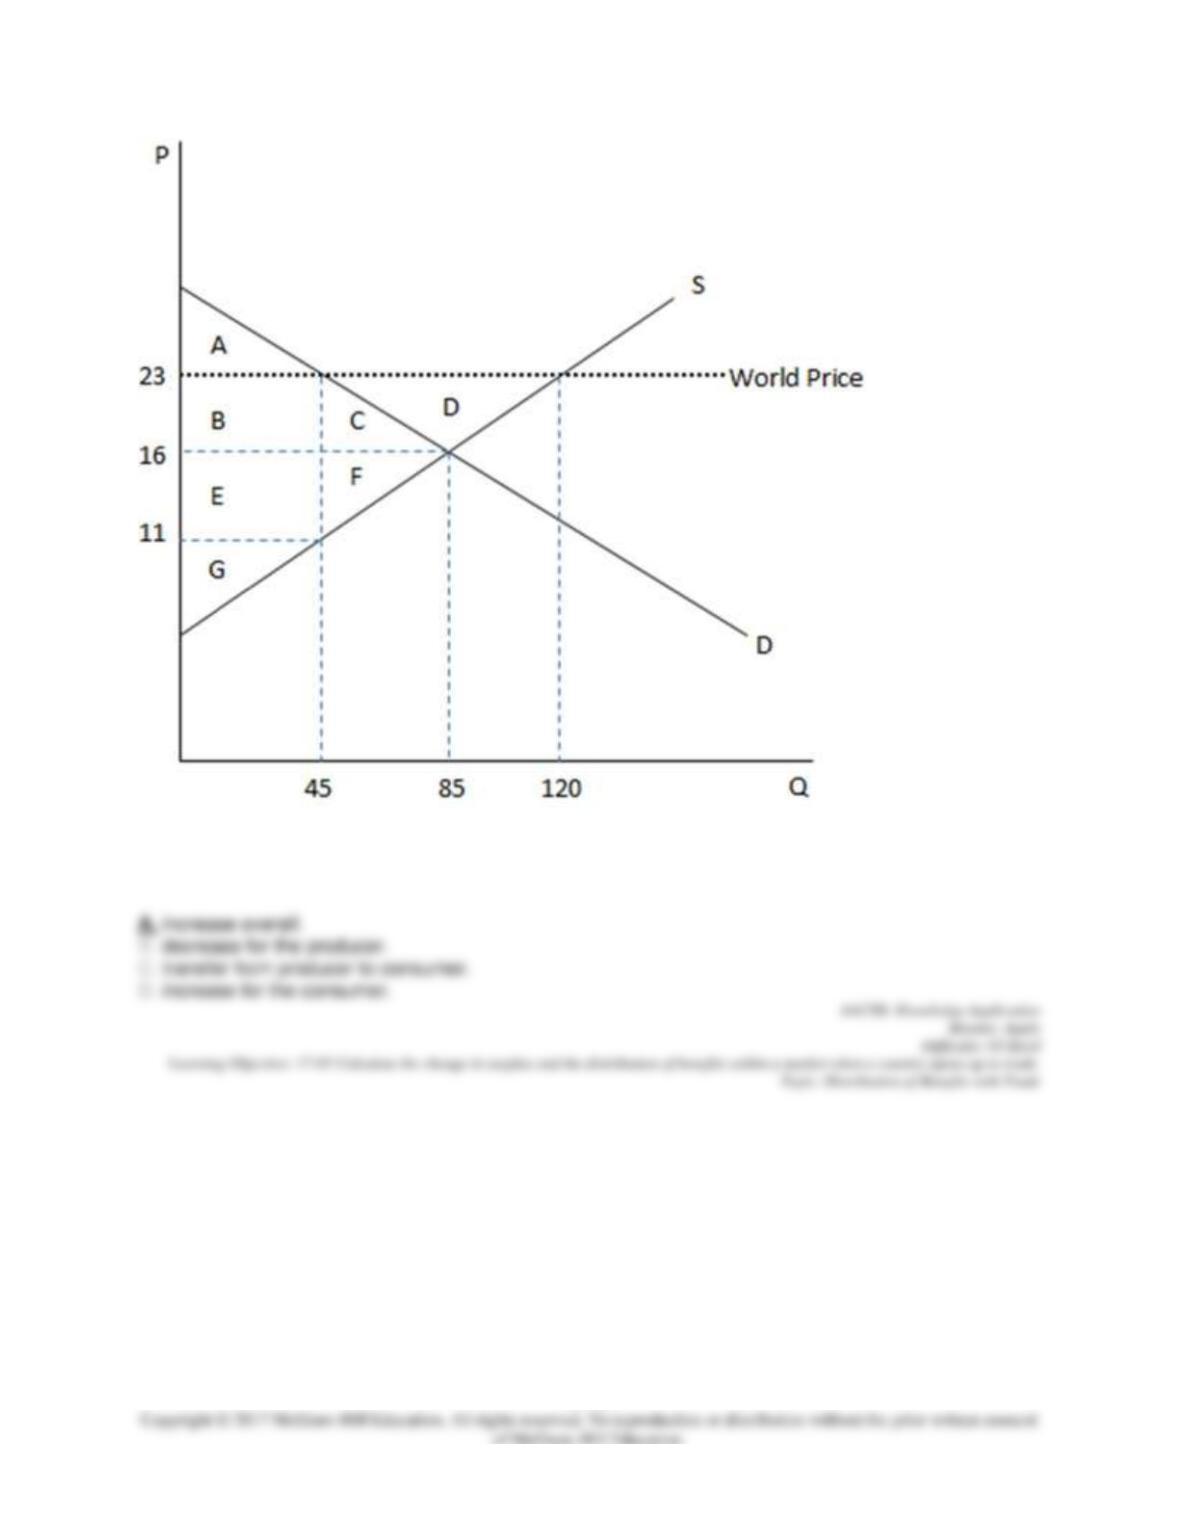
According to the graph shown, if this economy were to open to trade, surplus would:
78. This graph demonstrates the domestic demand and supply for a good, as well as the world price for
that good.
17–44
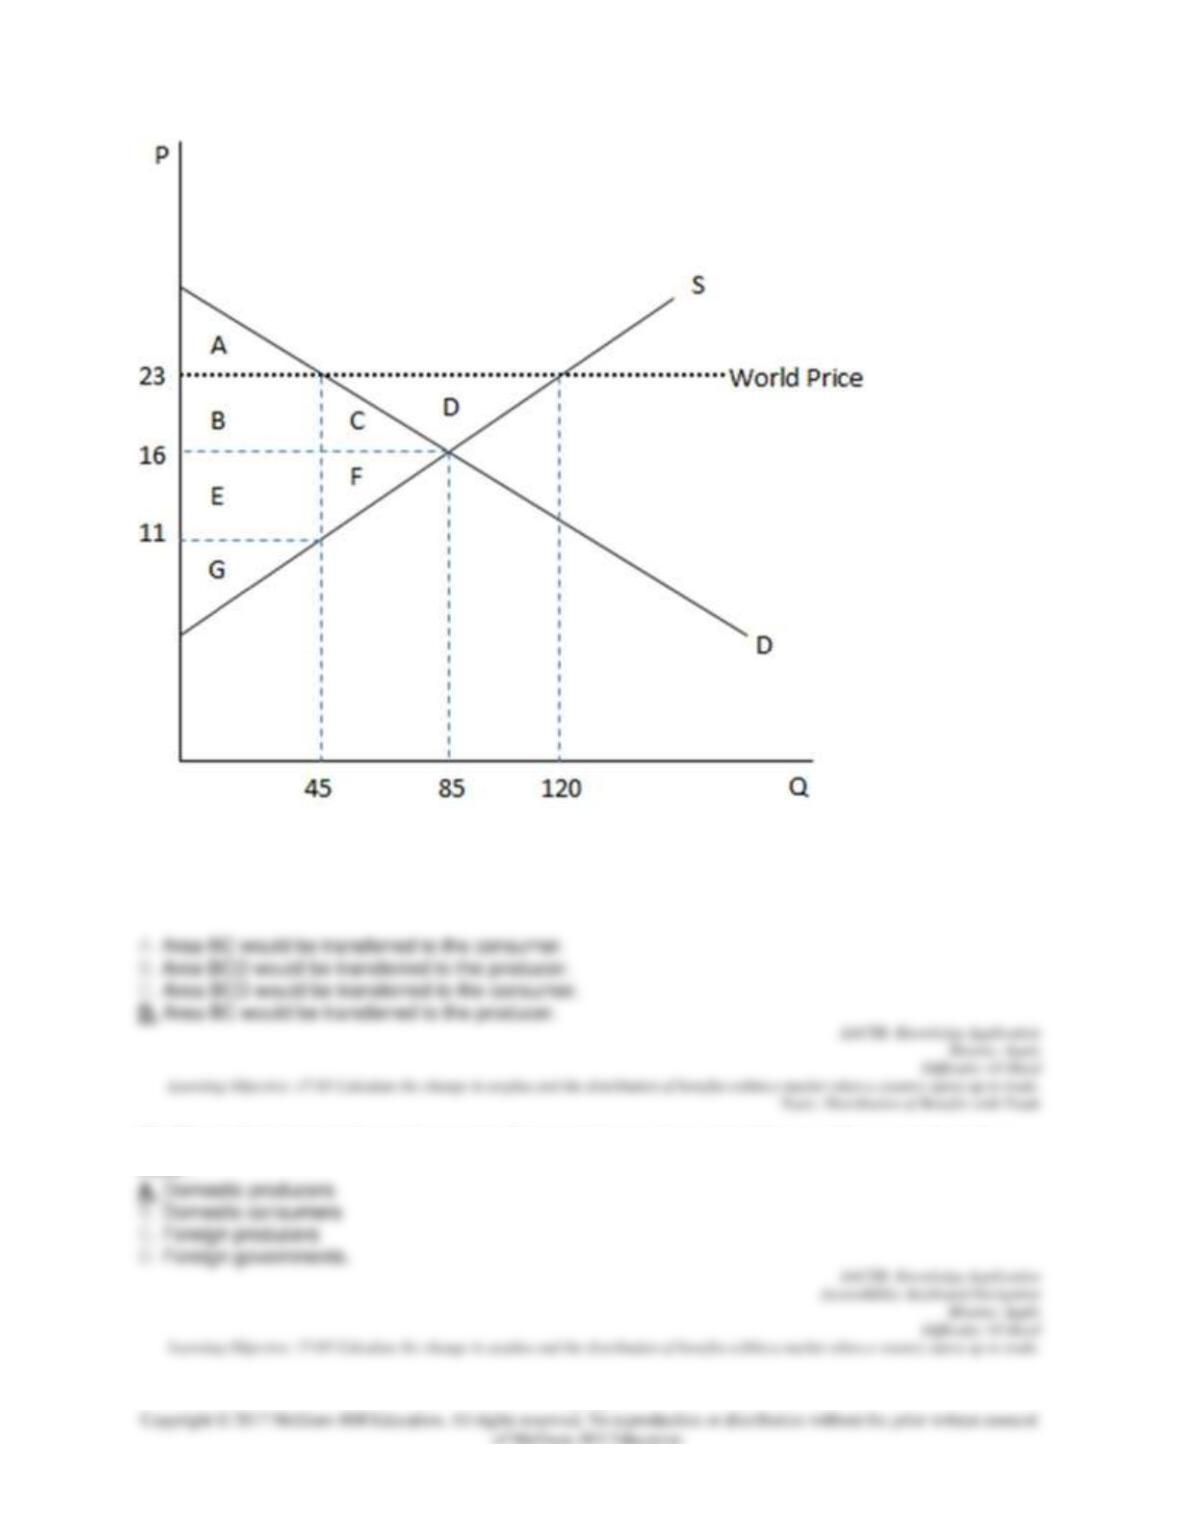
According to the graph shown, if this economy were to open to trade, which amount of surplus would be
transferred?
79. Who is likely to be in favor of a country that would be a net-exporter if it moved from autarky to free
trade?
80. Suppose a country, whose production and consumption of cell phones is large relative to the world
market, has just entered the global market. If the country is a net-importer of cell phones, we would
expect the world:
81. International trade will:
82. For a country to be a price taker in the global market for some good:
83. When a price-taking country joins the global market for some good, it:
84. For a single country to influence the price of some good in the global market:
17–46
85. Suppose a country, whose production and consumption of coffee is large relative to the world market,
has just entered the global market. If the country is a net exporter of coffee, we would expect the world:
86. Suppose a country, whose production and consumption of coffee is large relative to the world market,
has just entered the global market. If the country is a net exporter of coffee, we would expect:
87. Suppose a country, whose production and consumption of cell phones is large relative to the world
market, has just entered the global market. If the country is a net-importer of cell phones, we would
expect:
88. If a country has a comparative advantage in wine moved from autarky to free trade, this would cause
what reaction in the world market?
89. If a country has a comparative advantage in tea moved from autarky to free trade, this would cause
what reaction in the world market?
90. Who is likely to be in favor of a country that would be a net-importer if it moved from autarky to free
91. Laws limiting trade are often referred to as:
92. A preference for policies that place limits on trade is called:
93. Actions that reduce trade restrictions and promote free trade are often referred to as:
94. A common tool for restricting trade through taxation is:
17–48
95. A common tool for restricting trade through quantity is:
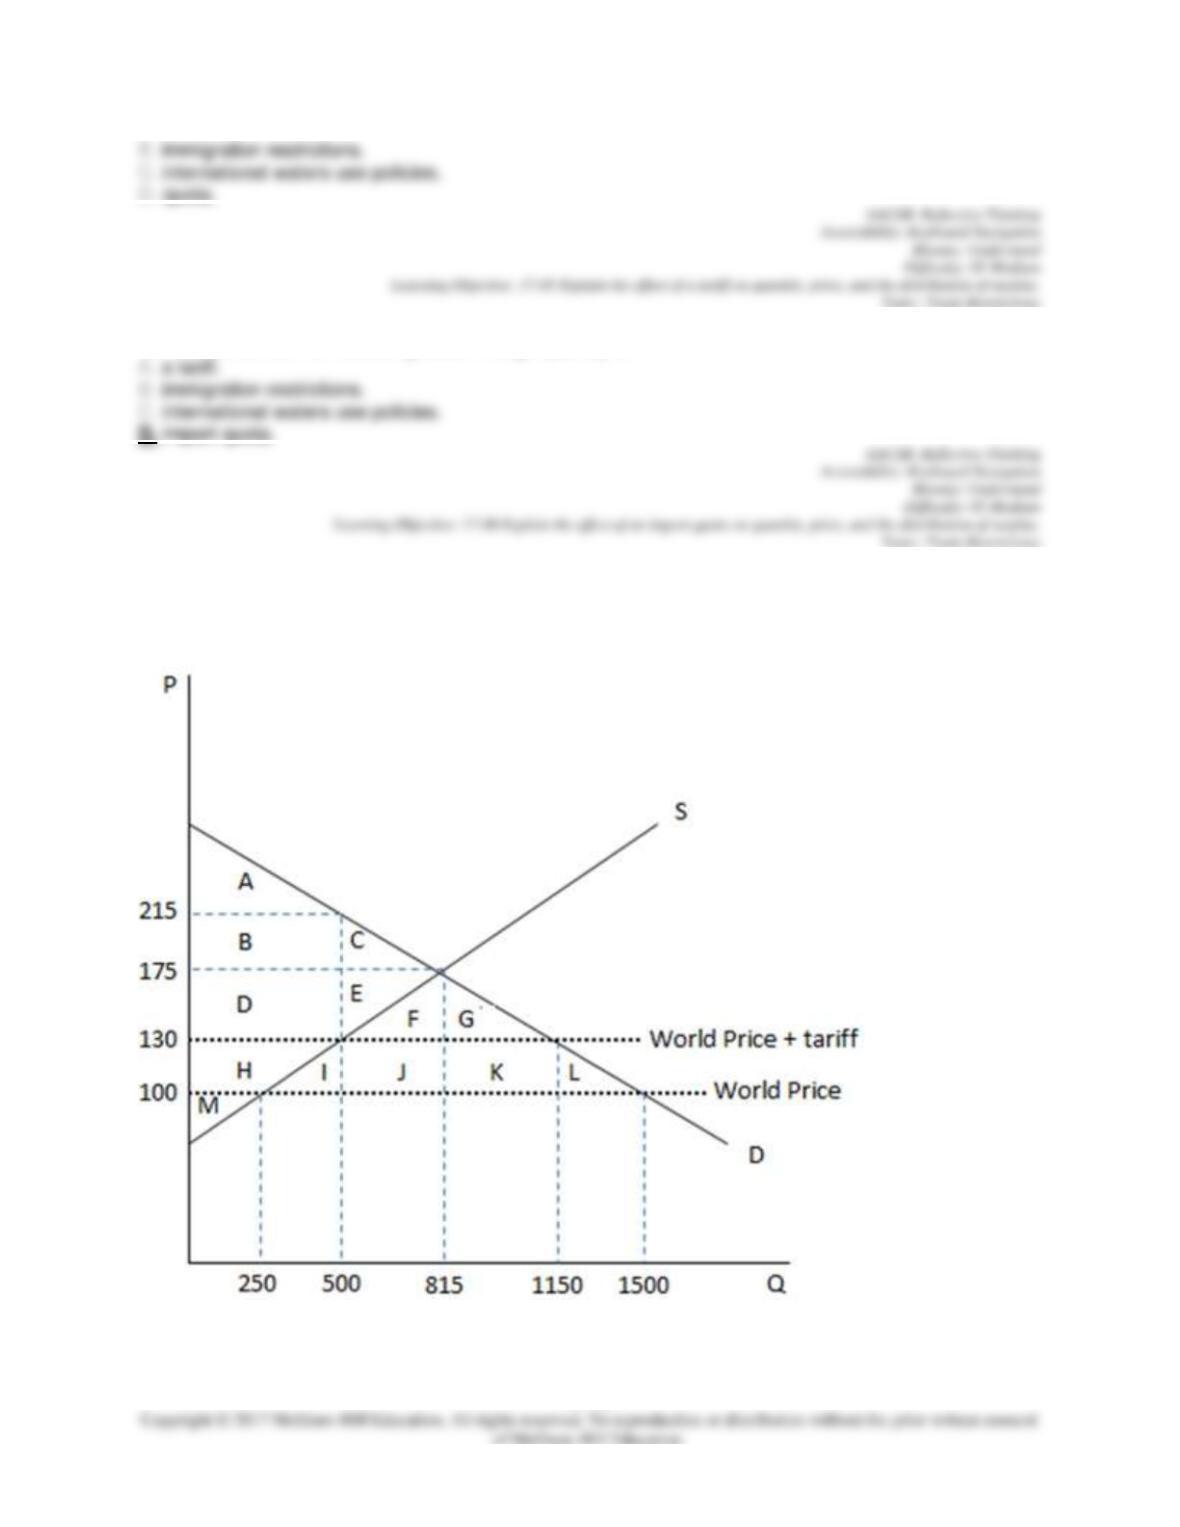
96. This graph demonstrates the domestic demand and supply for a good, as well as a tariff and the world
price for that good.
According to the graph shown, if this economy is an autarky, its equilibrium price is:
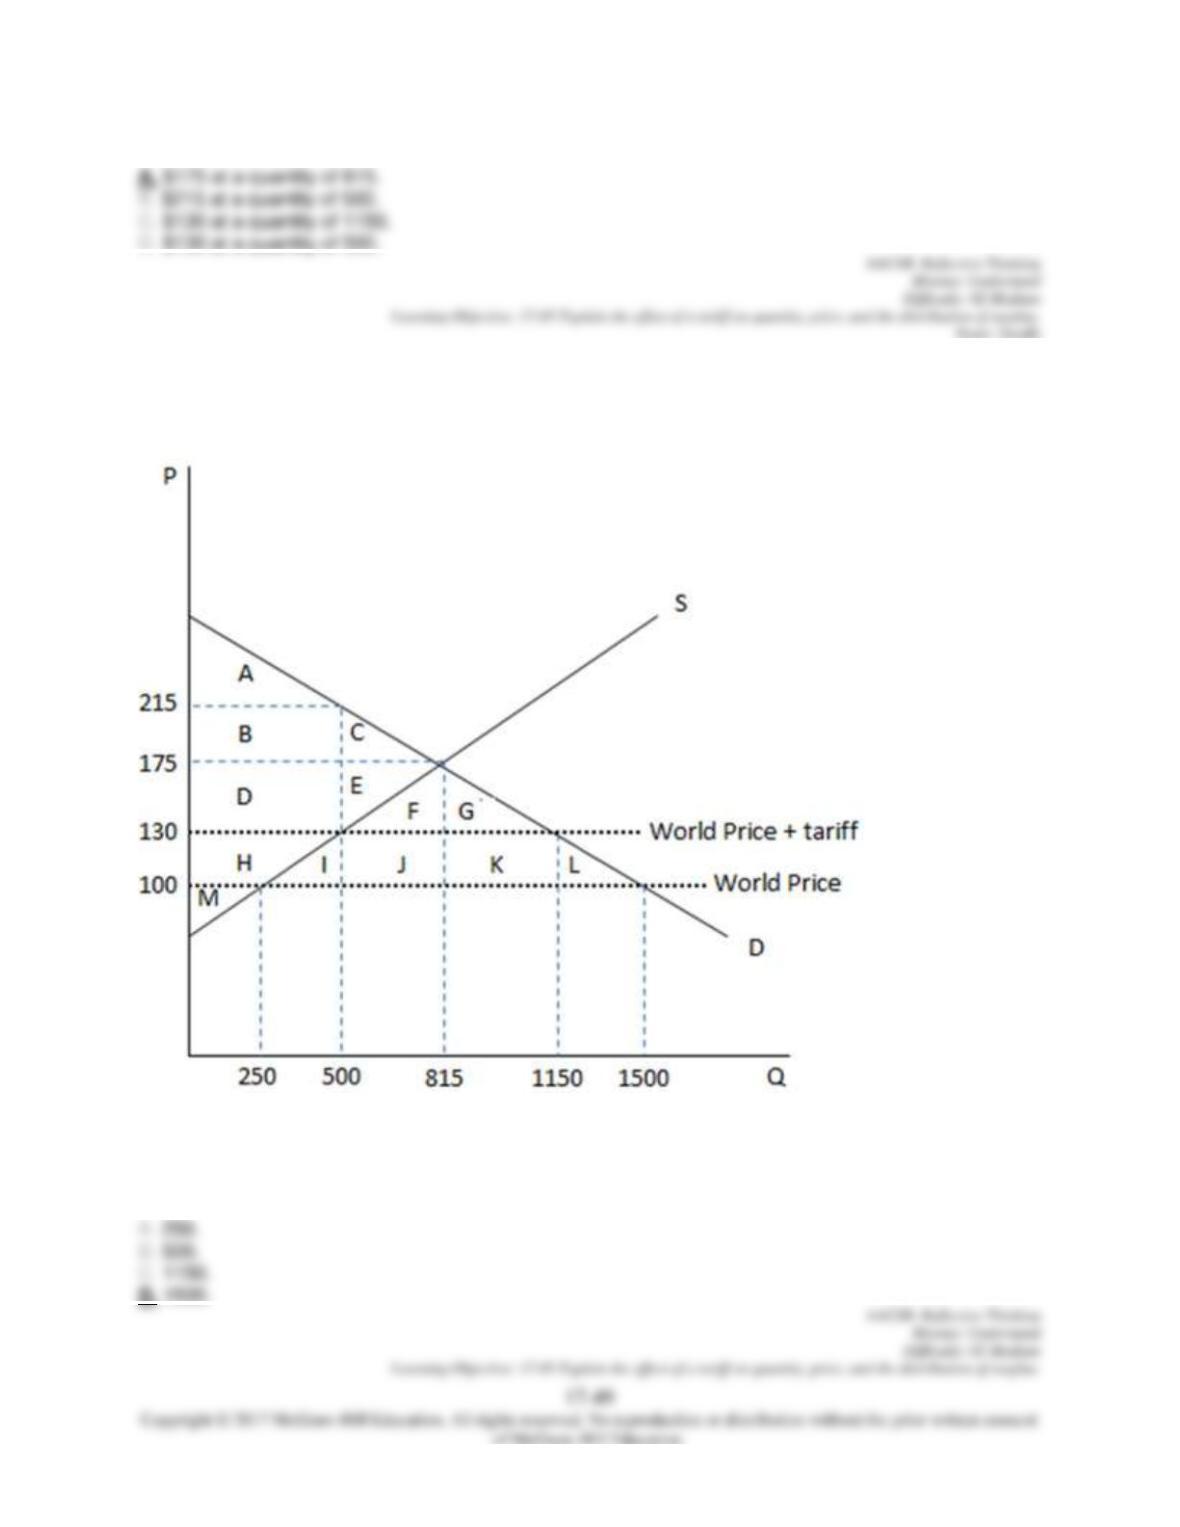
97. This graph demonstrates the domestic demand and supply for a good, as well as a tariff and the world
price for that good.
According to the graph shown, if this economy were to open to free trade, the domestic quantity
demanded would be:
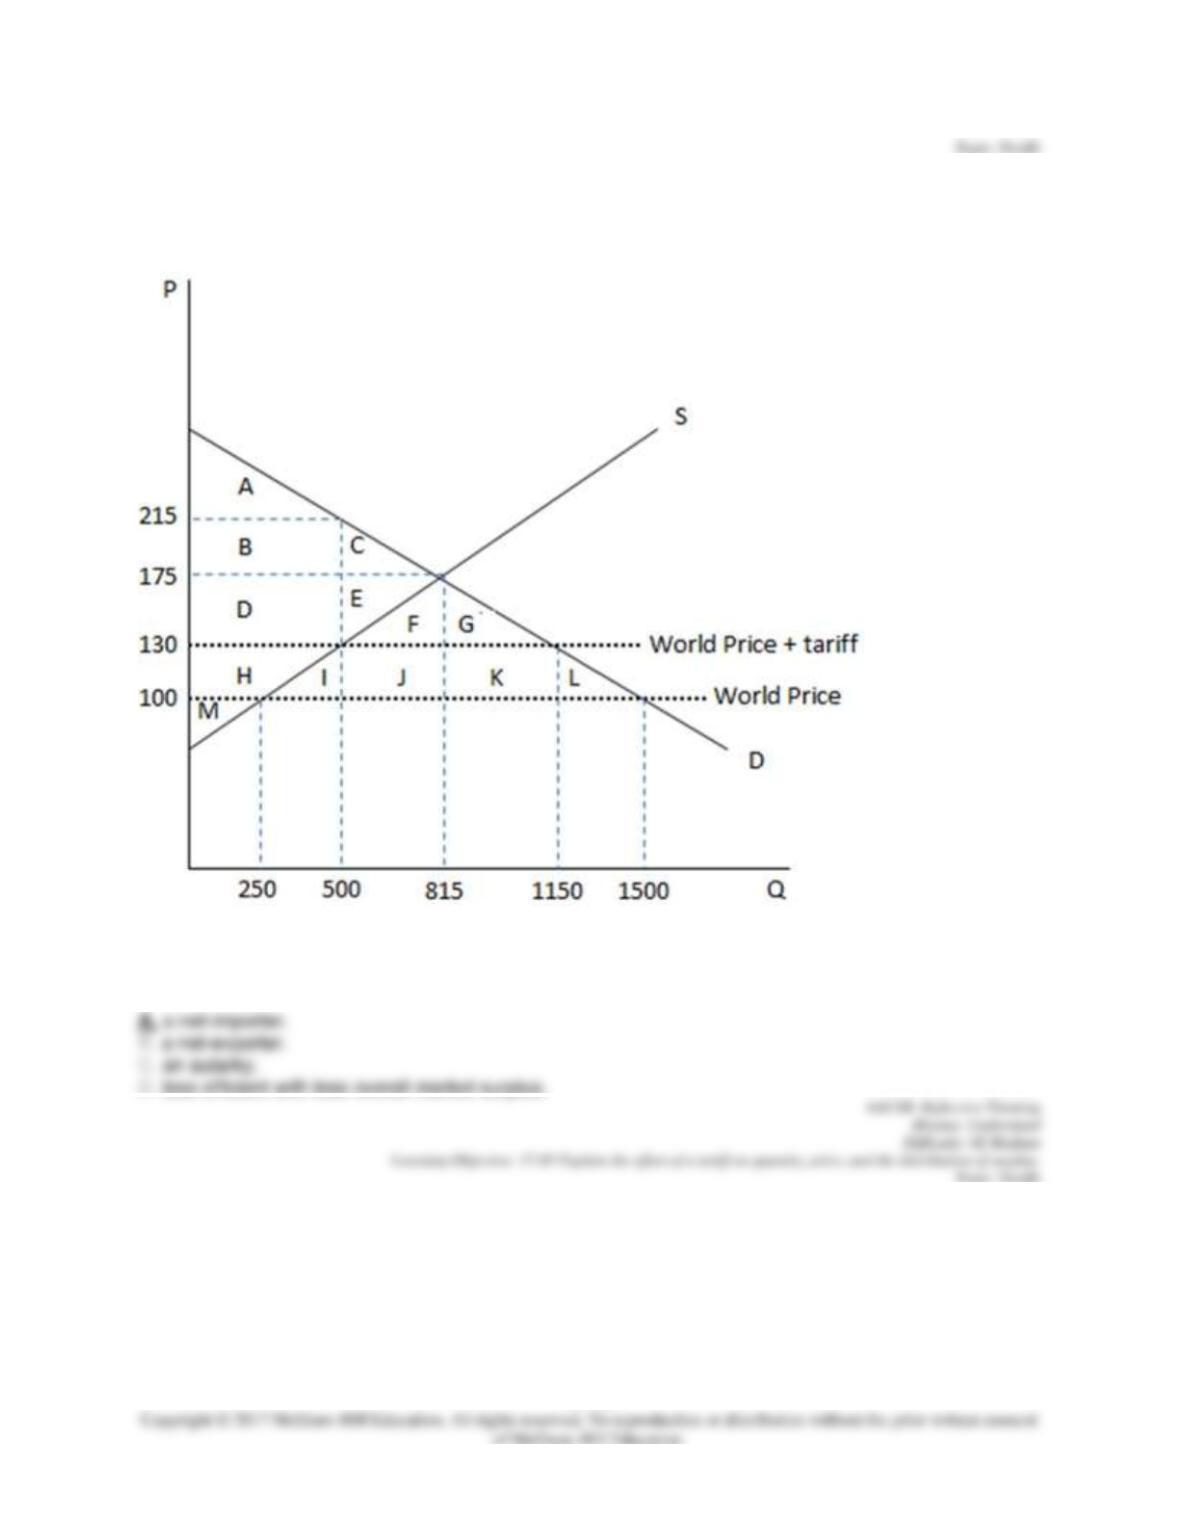
17–50
98. This graph demonstrates the domestic demand and supply for a good, as well as a tariff and the world
price for that good.
According to the graph shown, if the economy were to open to free trade, it would become:
99. This graph demonstrates the domestic demand and supply for a good, as well as a tariff and the world
price for that good.
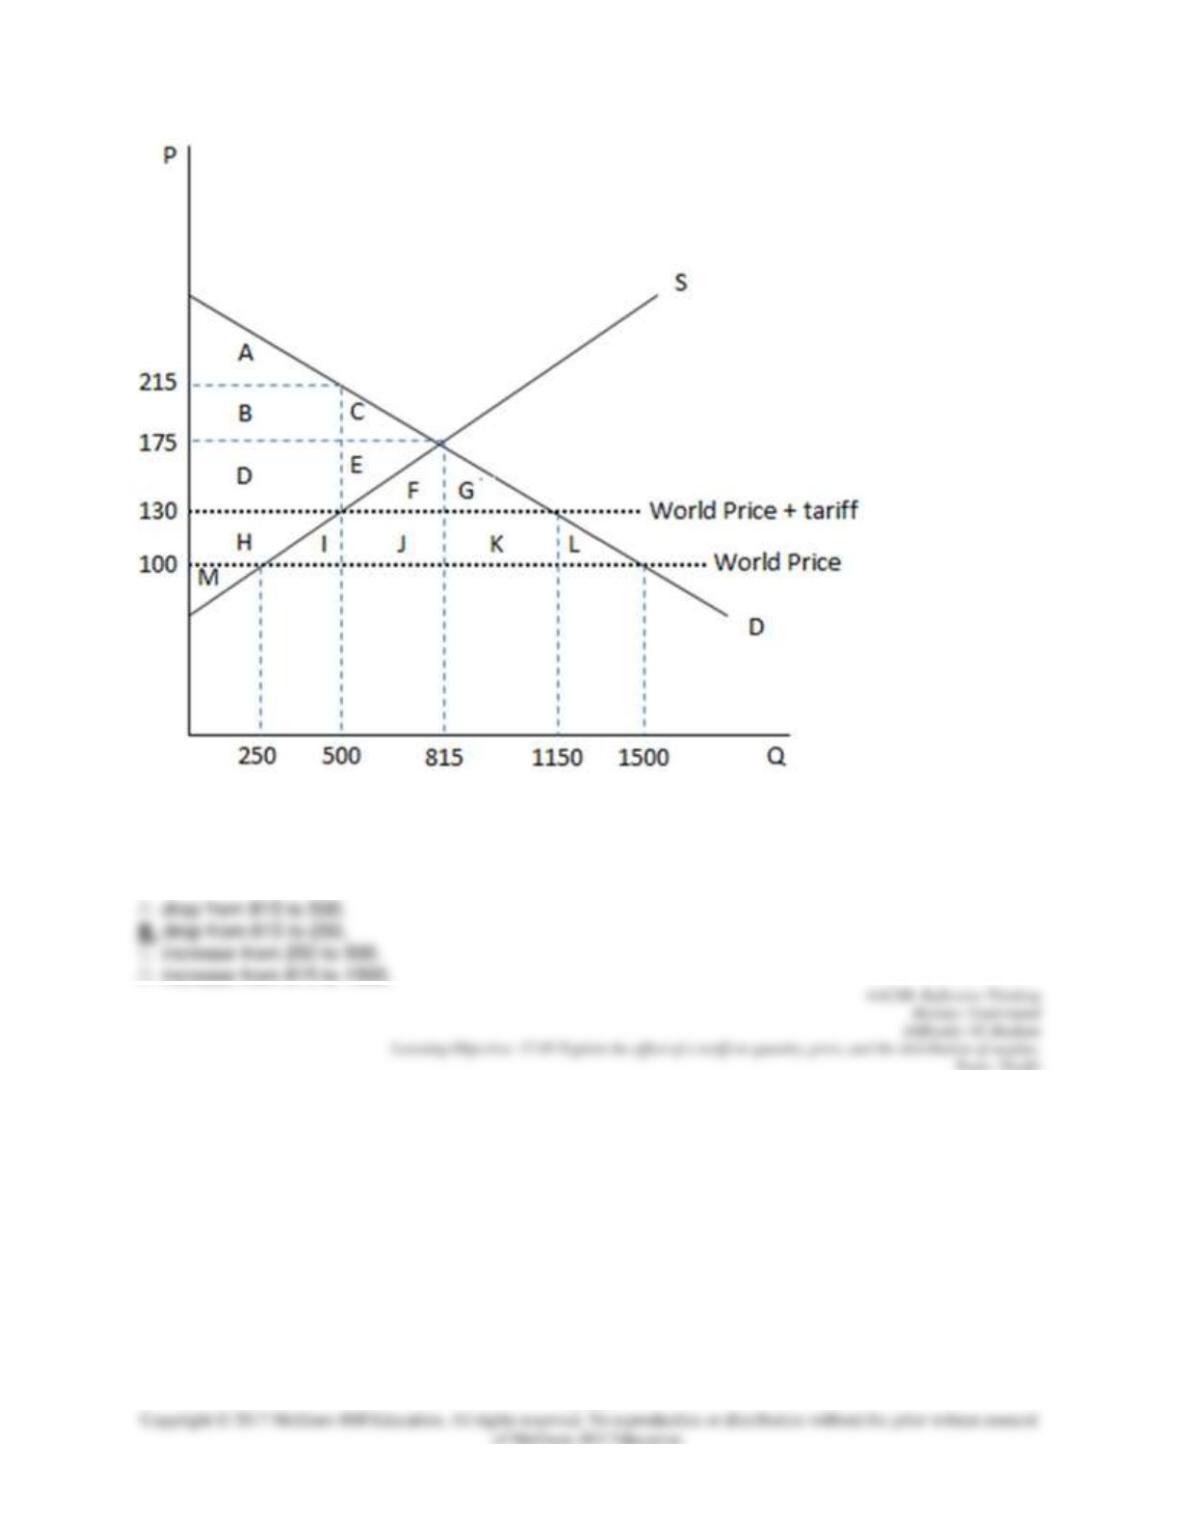
17–51
According to the graph shown, if the economy were open to free trade, the domestic quantity supplied
would:
100. This graph demonstrates the domestic demand and supply for a good, as well as a tariff and the
world price for that good.
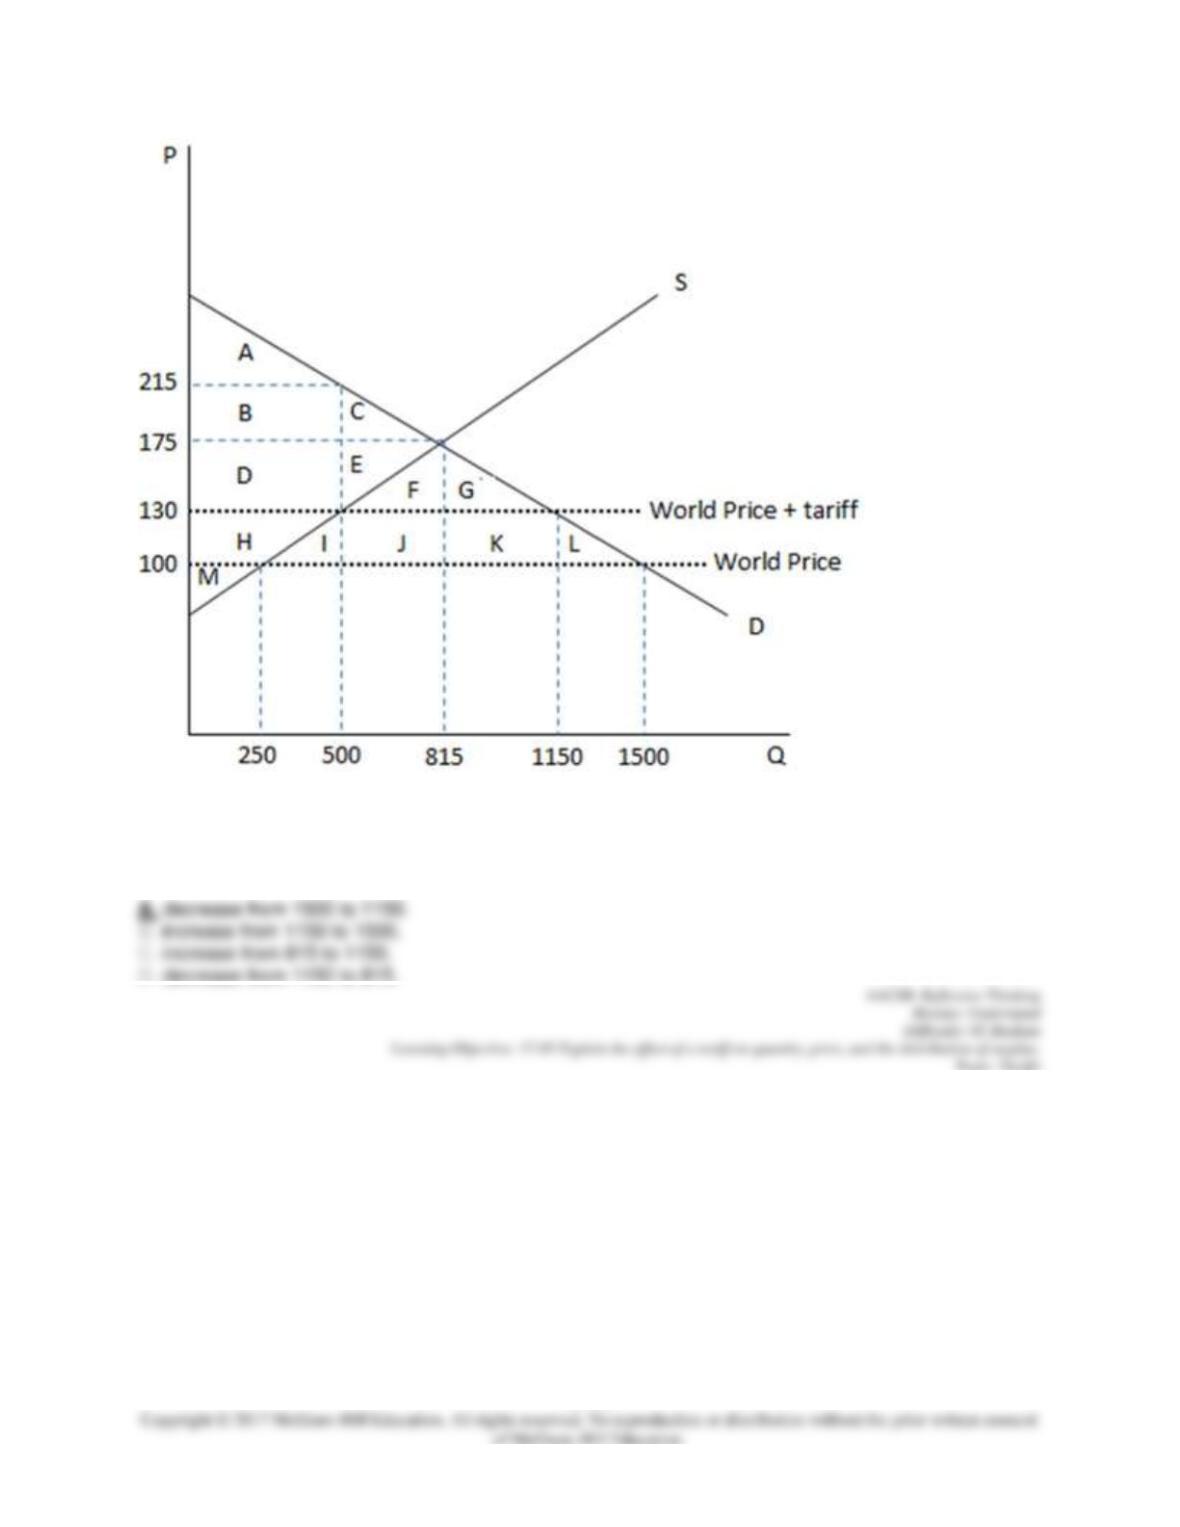
17–52
According to the graph shown, if this economy were open to free trade, and decided to impose a tariff, the
domestic quantity demanded would:
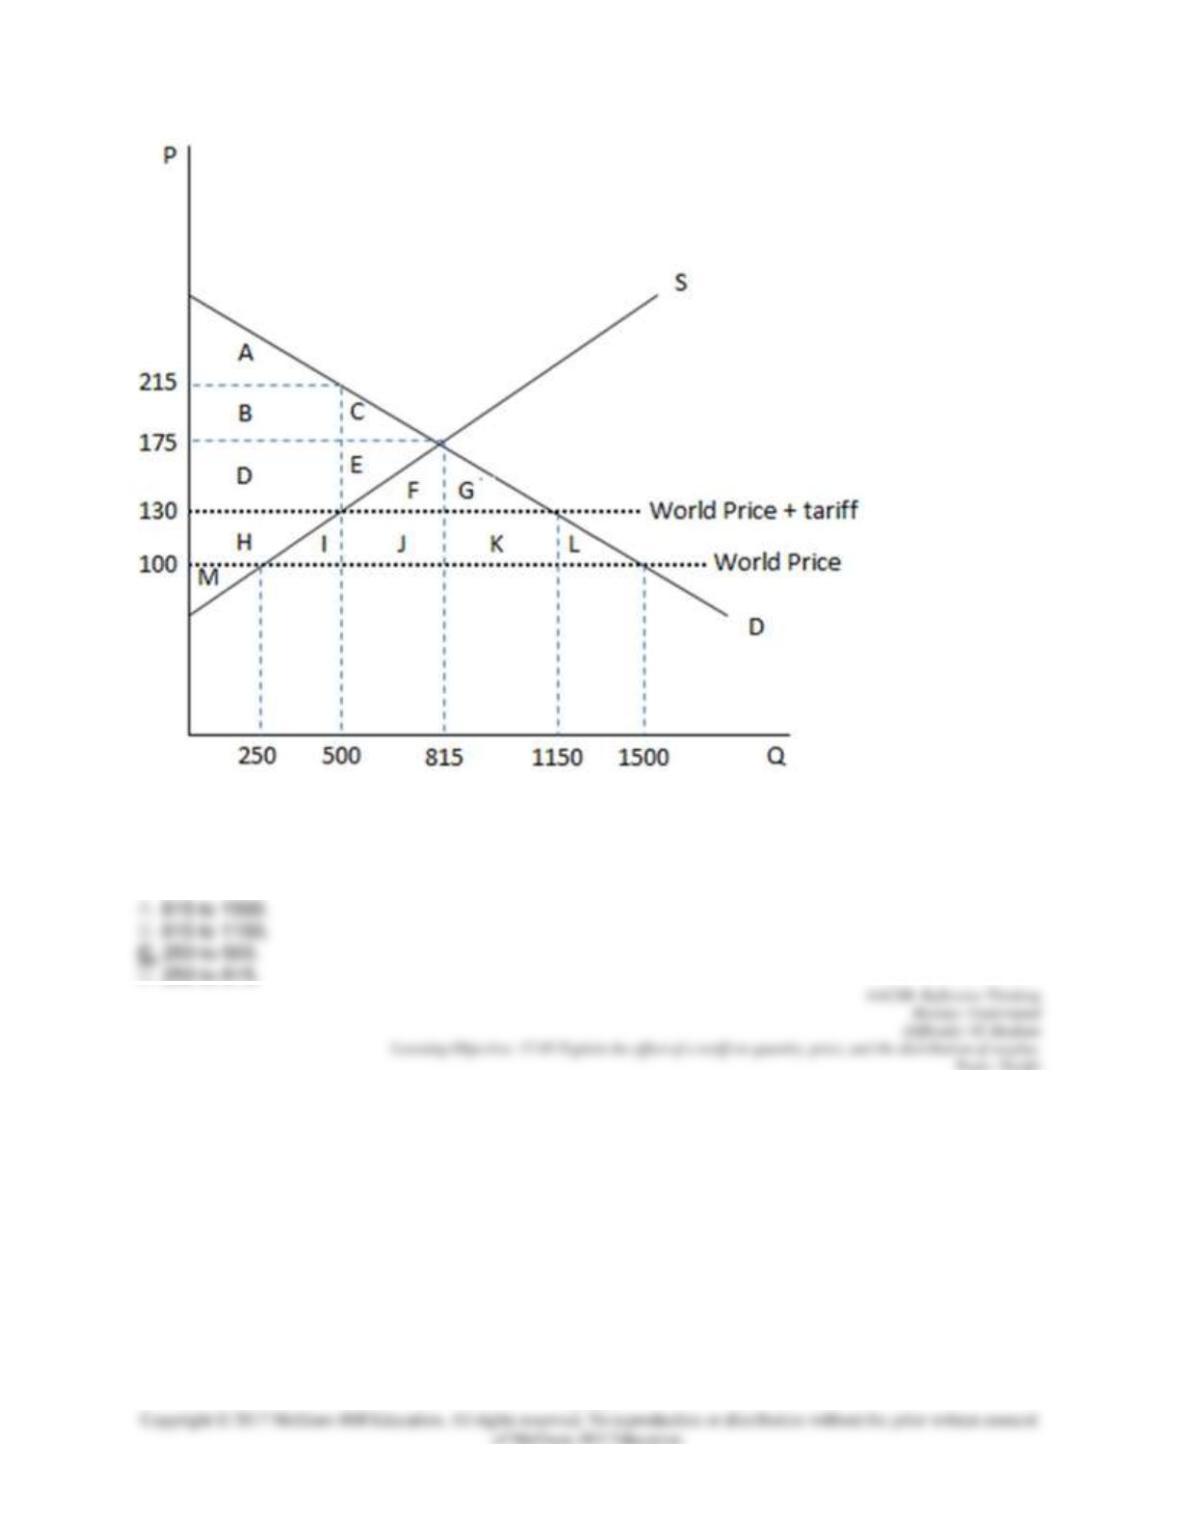
101. This graph demonstrates the domestic demand and supply for a good, as well as a tariff and the
world price for that good.
17–53
According to the graph shown, if this economy were open to free trade, and decided to impose a tariff, the
domestic quantity supplied would increase from:
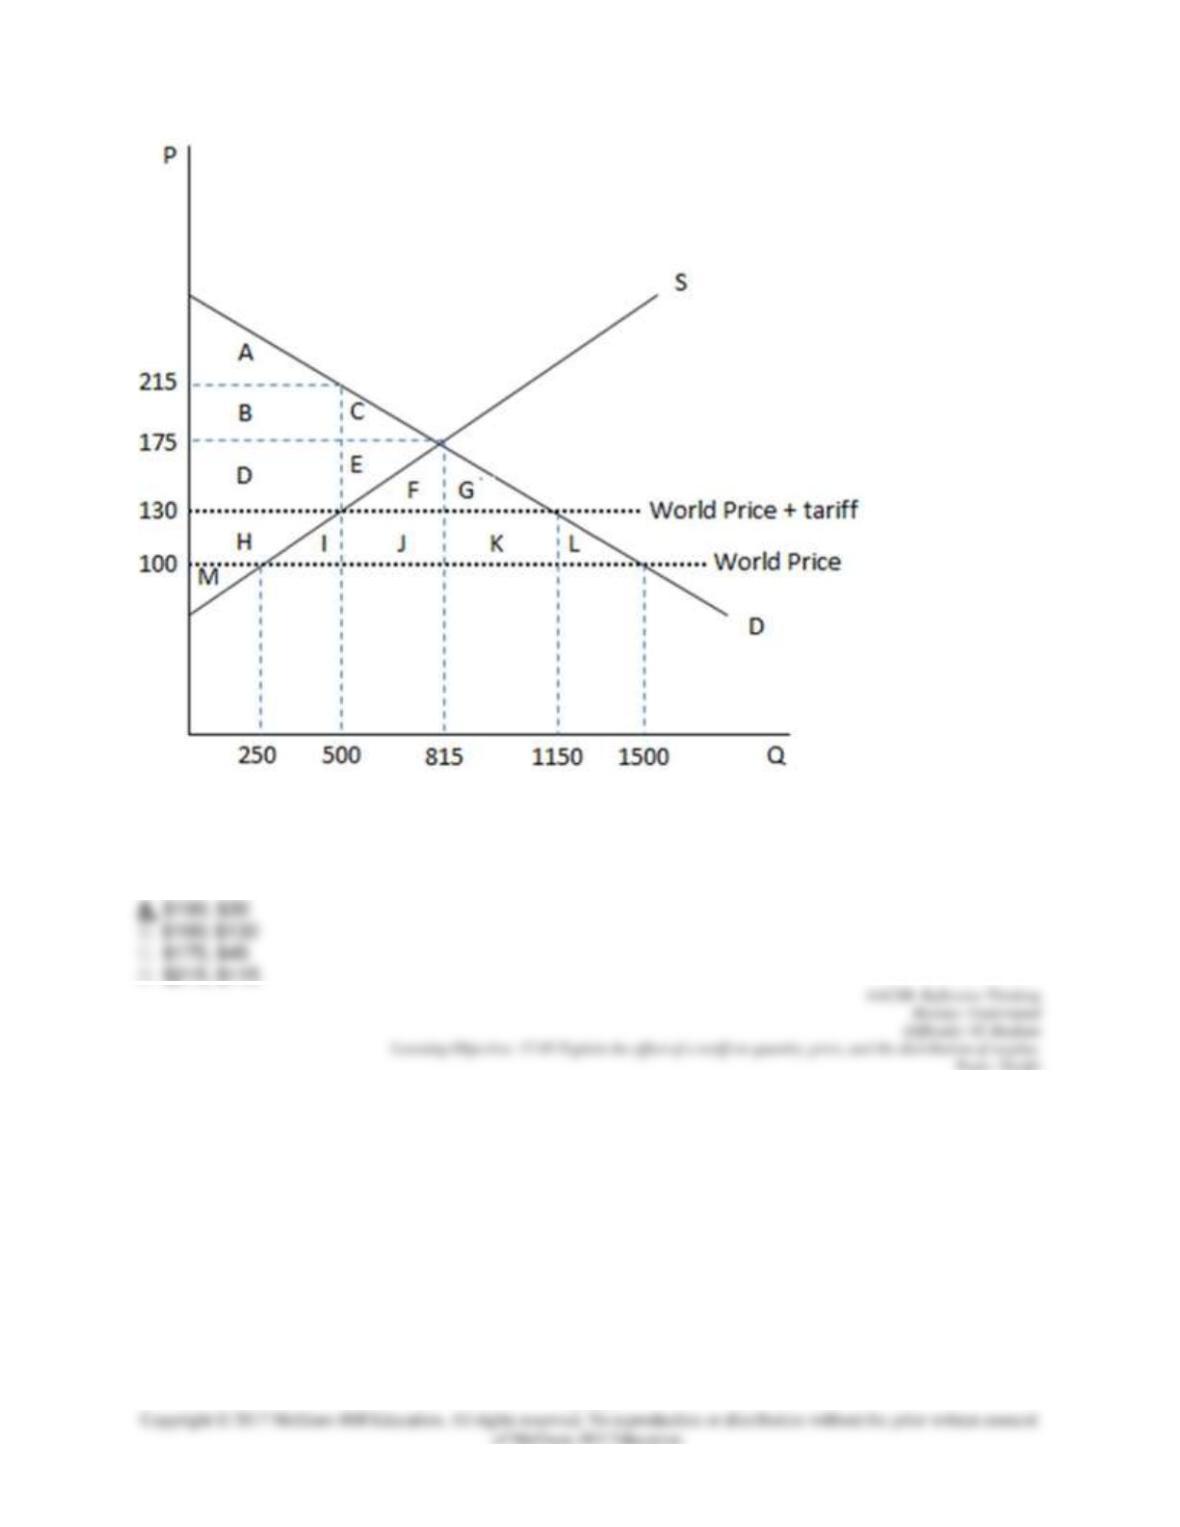
102. This graph demonstrates the domestic demand and supply for a good, as well as a tariff and the
world price for that good.
17–54
According to the graph shown, the original world price is _______ and the amount of the tariff is
_________.
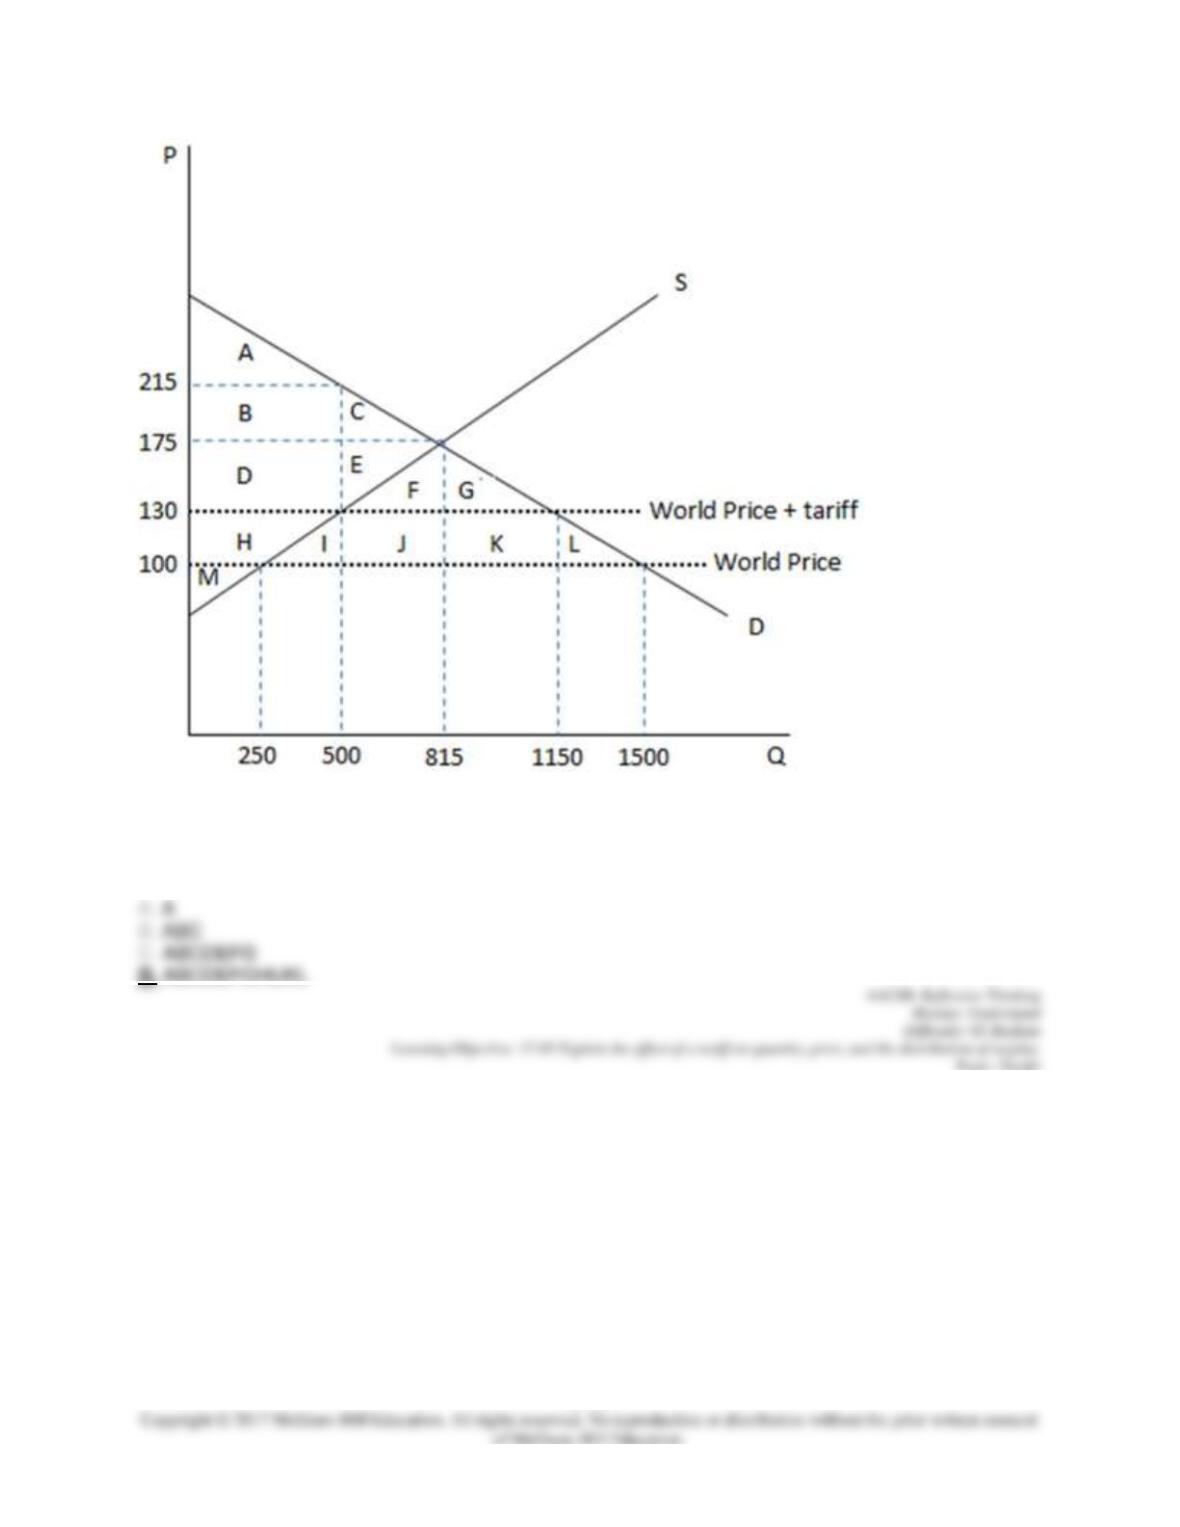
103. This graph demonstrates the domestic demand and supply for a good, as well as a tariff and the
world price for that good.
17–55
According to the graph shown, the amount of surplus enjoyed by domestic consumers with free trade
before the tariff is area:
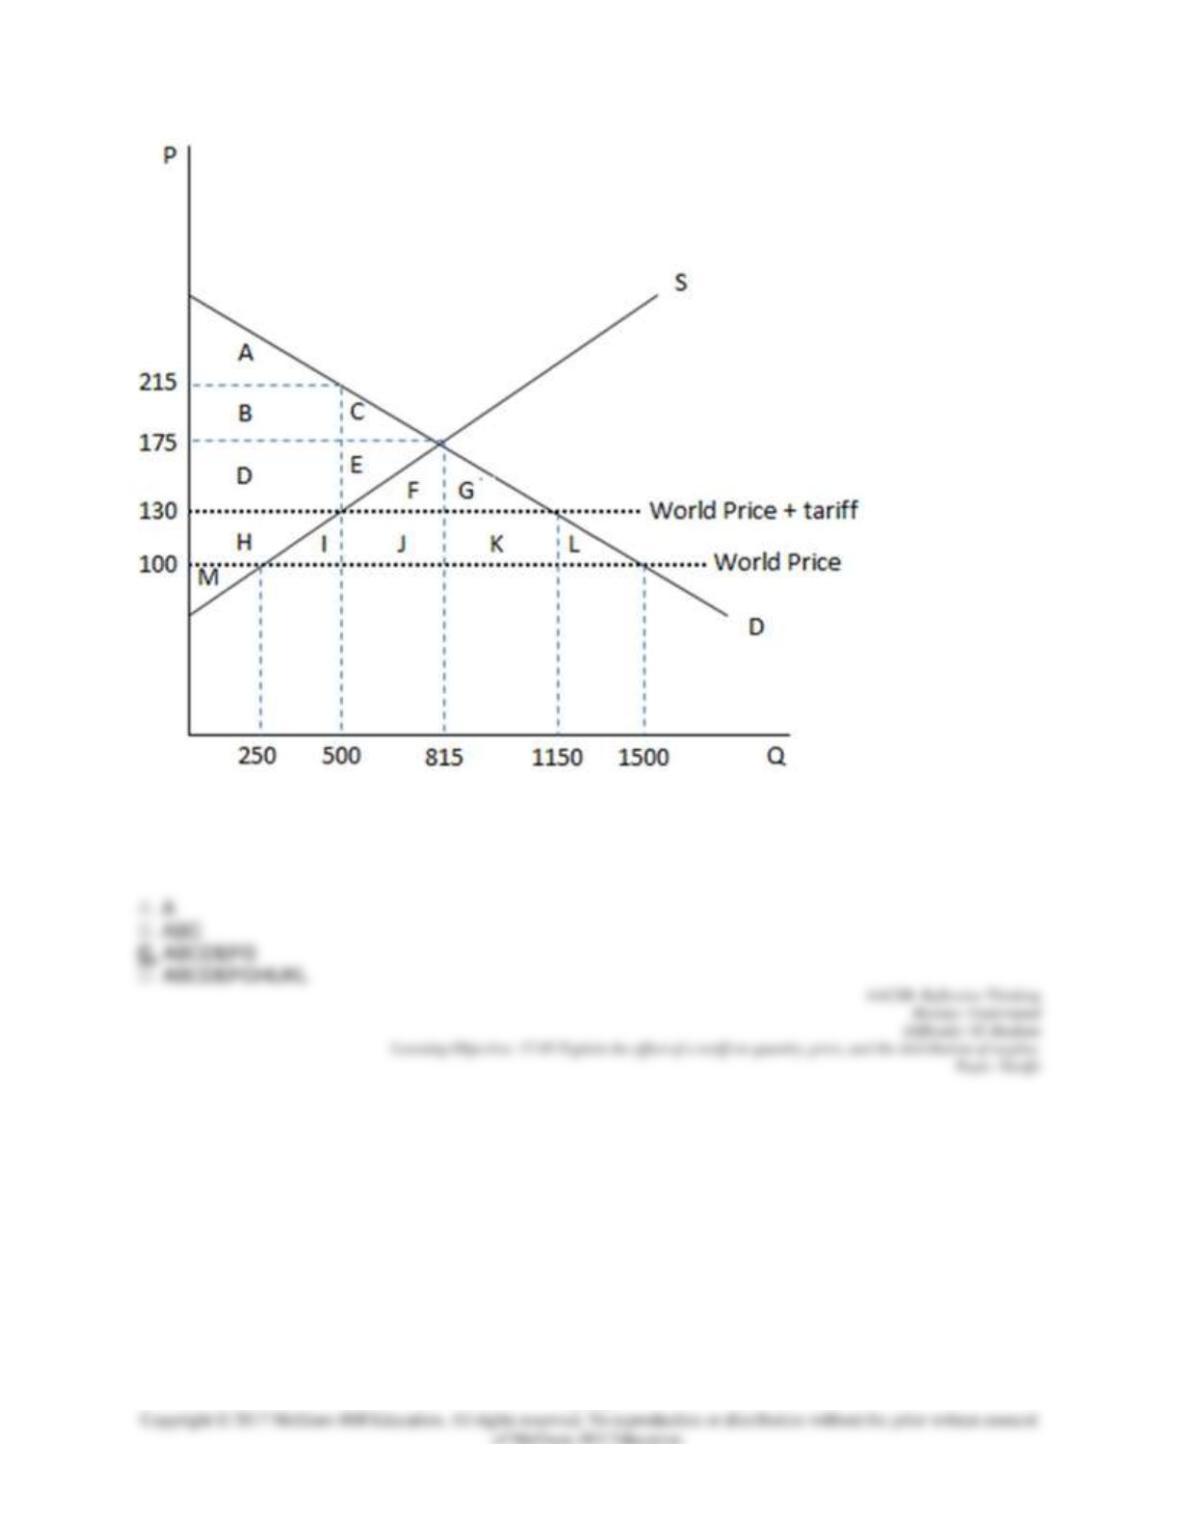
104. This graph demonstrates the domestic demand and supply for a good, as well as a tariff and the
world price for that good.
17–56
According to the graph shown, the amount of consumer surplus domestic consumers enjoy once a tariff
has been imposed is:
105. This graph demonstrates the domestic demand and supply for a good, as well as a tariff and the
world price for that good.
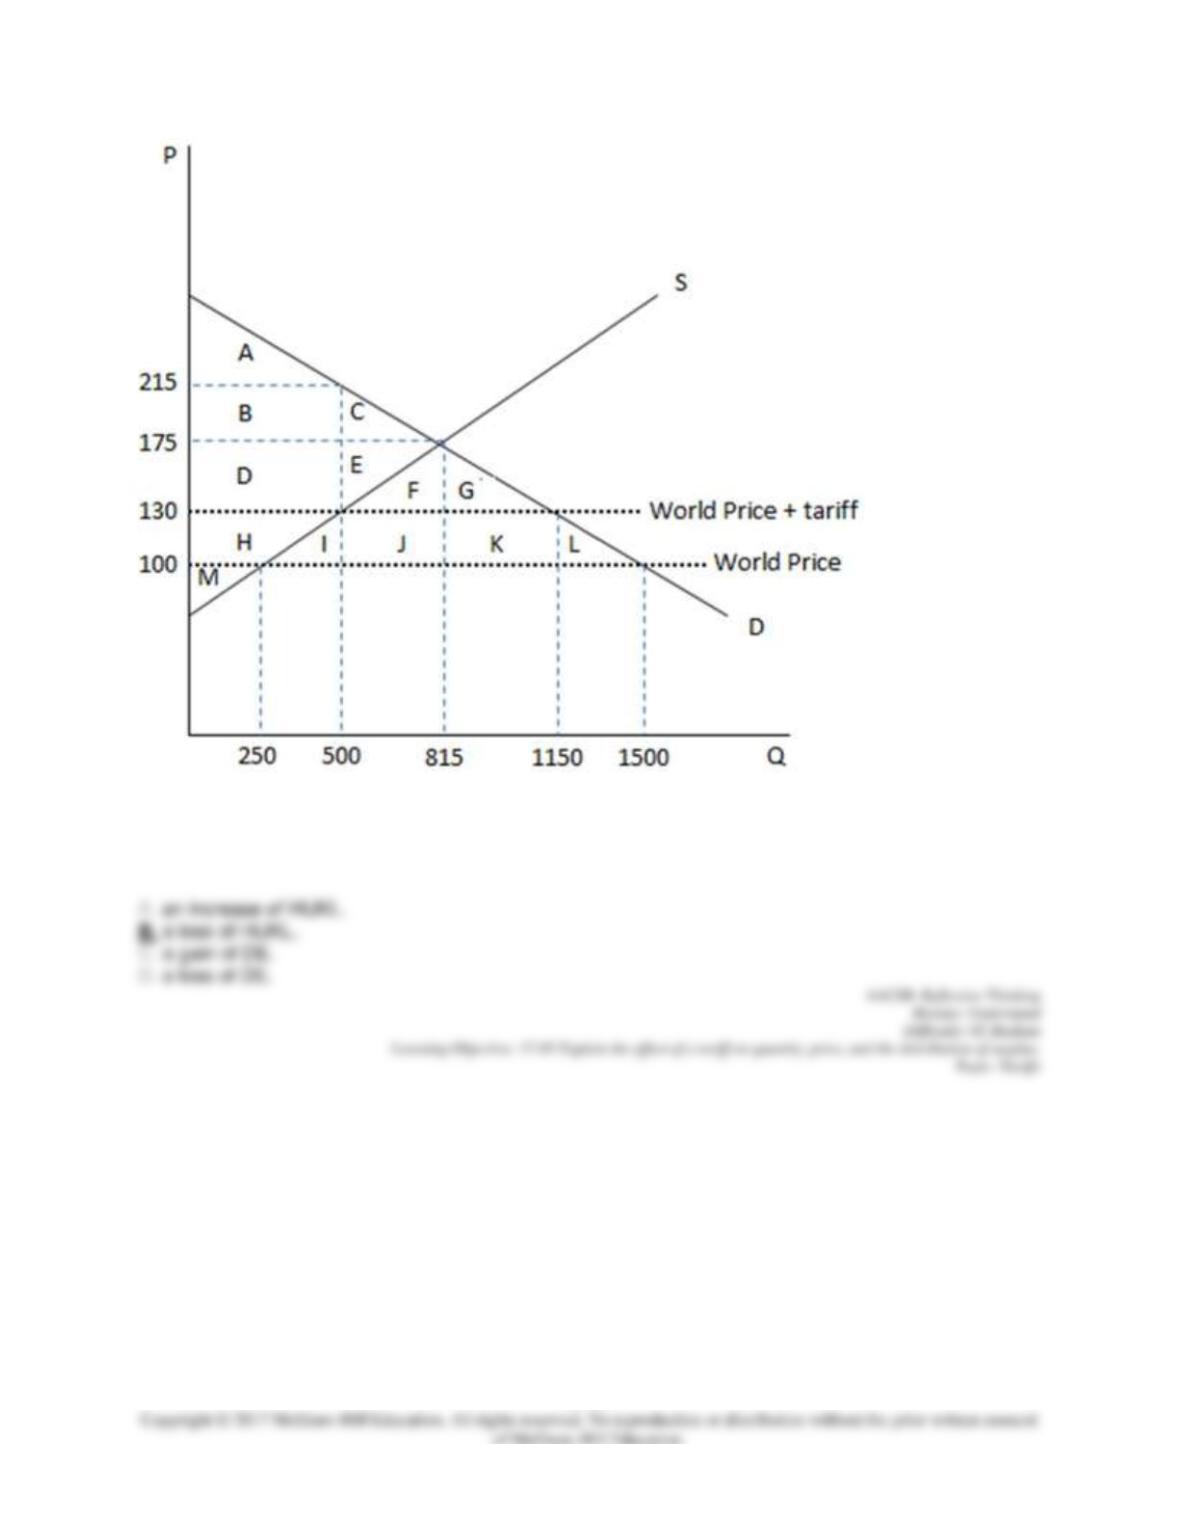
17–57
According to the graph shown, the change in consumer surplus brought about by the imposition of a tariff
to an economy previously open to free trade is:
106. This graph demonstrates the domestic demand and supply for a good, as well as a tariff and the
world price for that good.
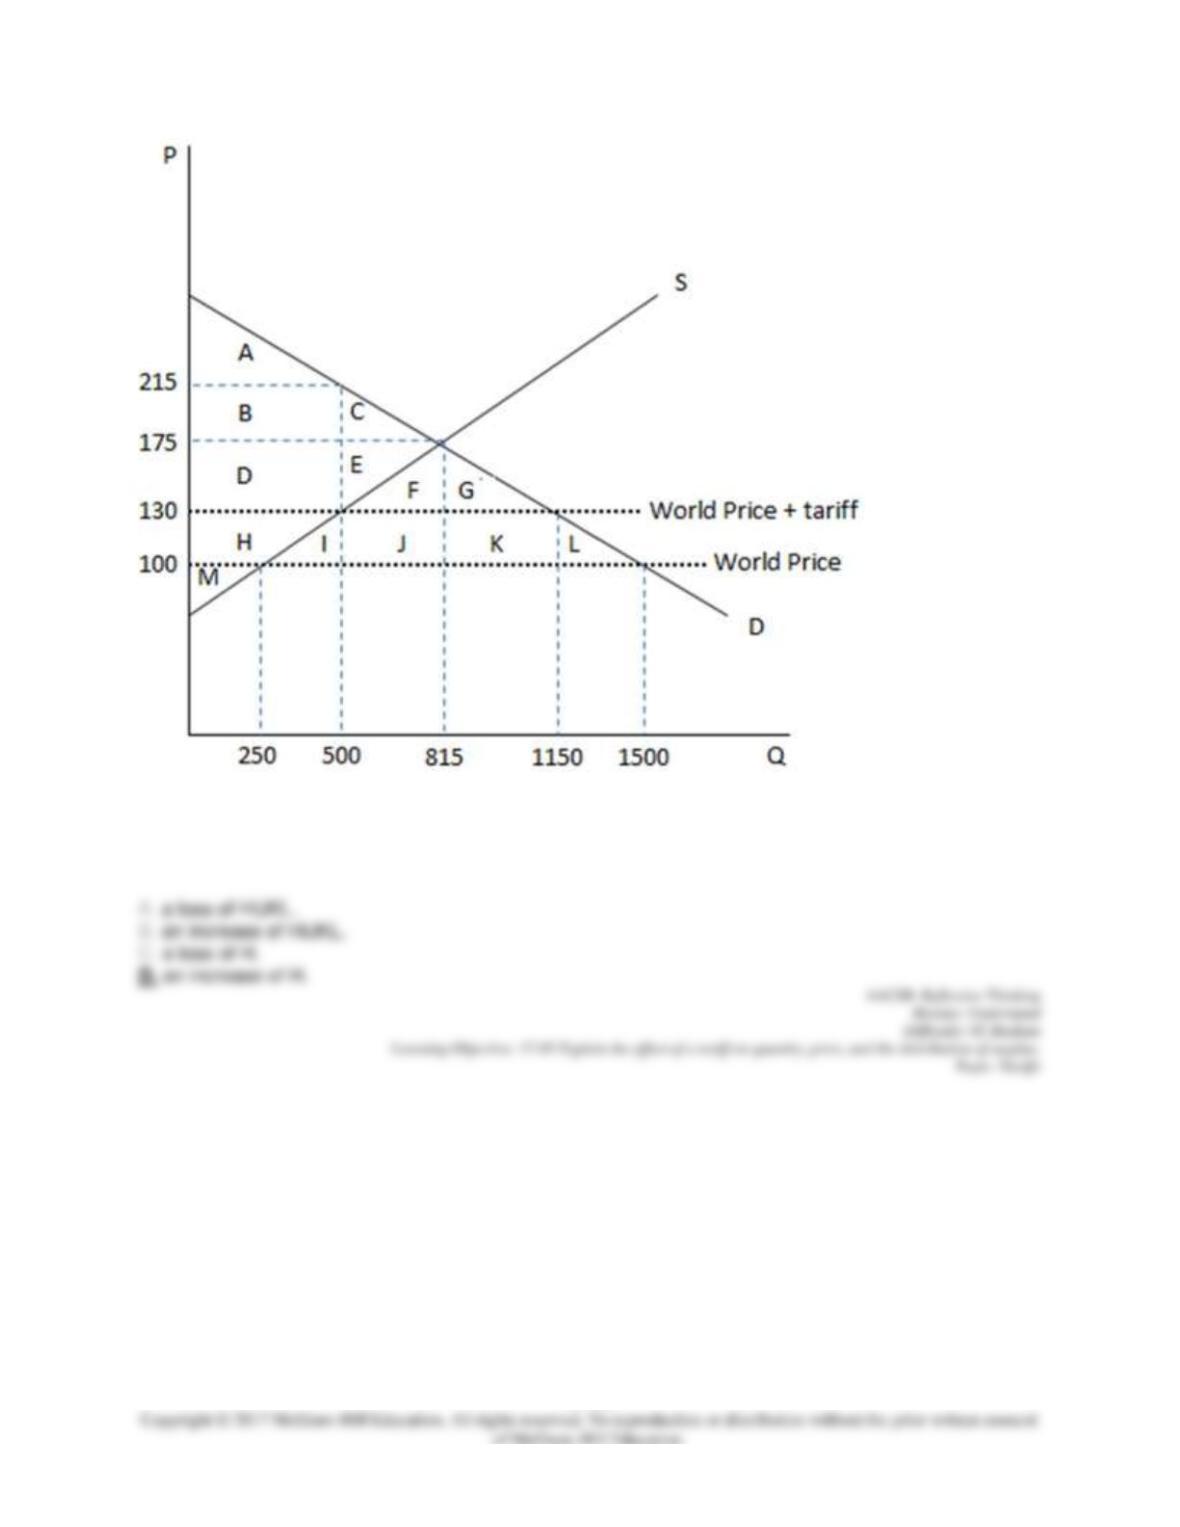
17–58
According to the graph shown, the change in producer surplus brought about by the introduction of a tariff
is:
107. This graph demonstrates the domestic demand and supply for a good, as well as a tariff and the
world price for that good.
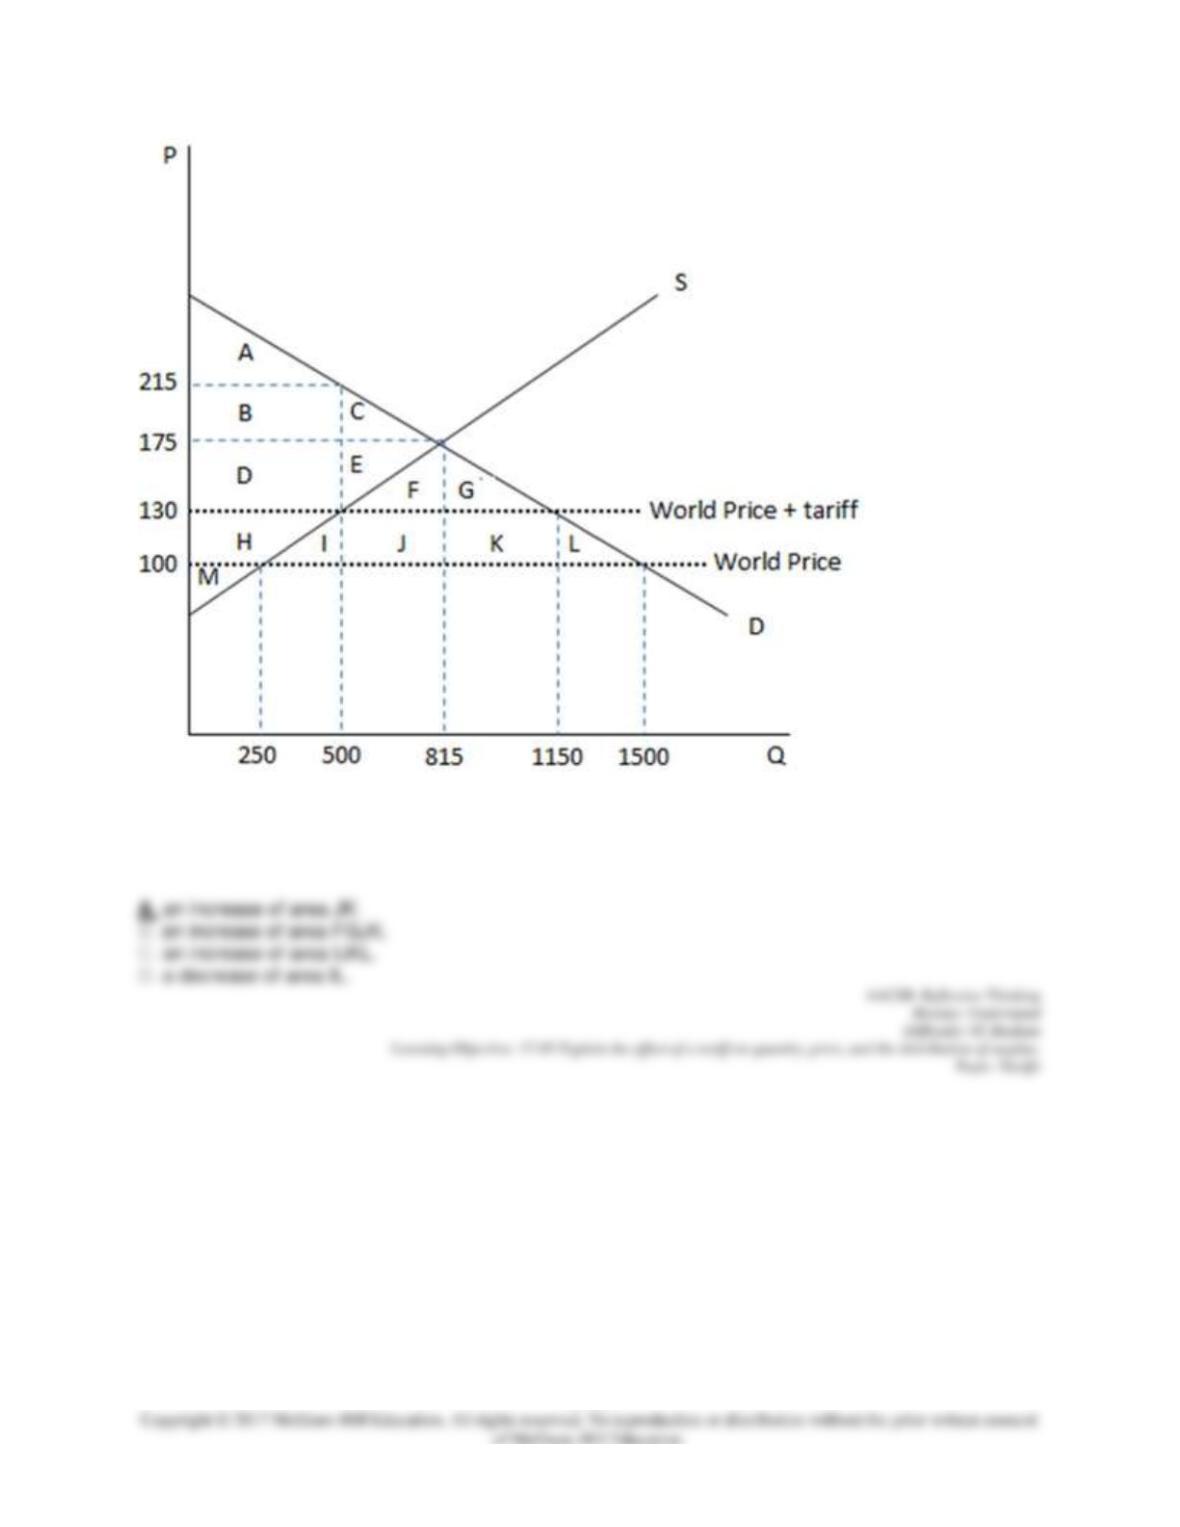
17–59
According to the graph shown, the change to government revenue brought about by the introduction of a
tariff to an economy once operating under free trade is:
108. This graph demonstrates the domestic demand and supply for a good, as well as a tariff and the
world price for that good.
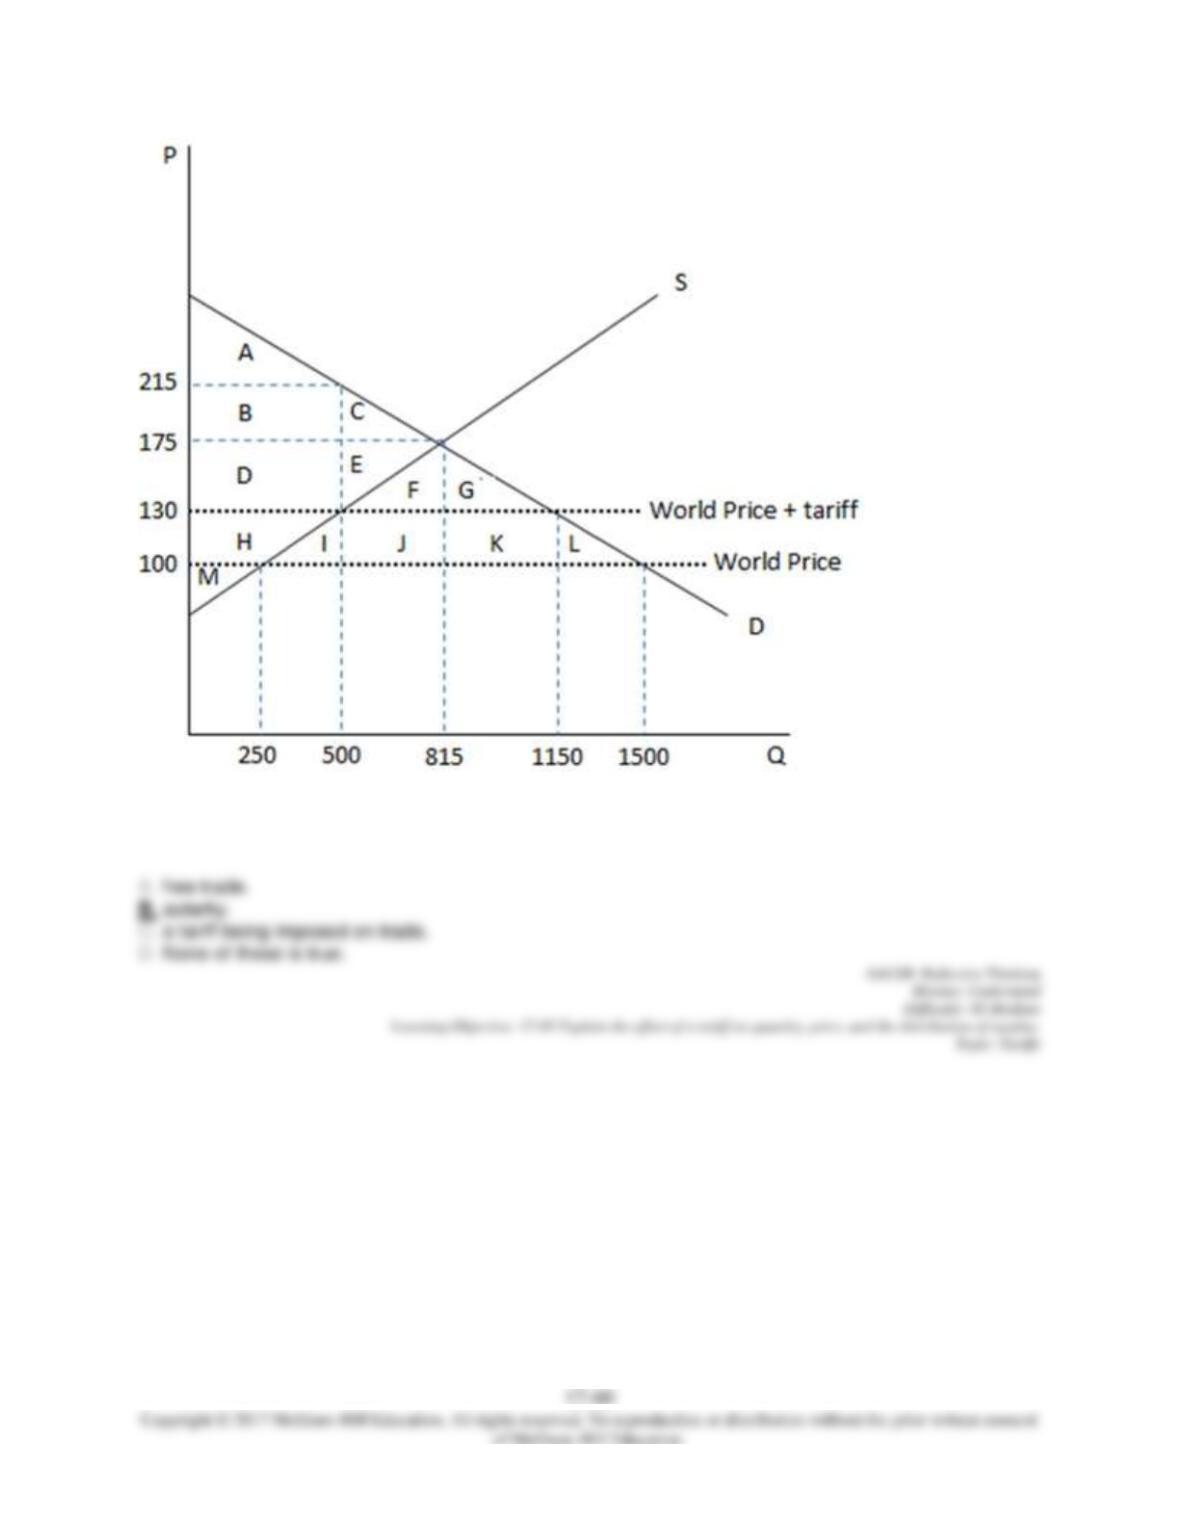
According to the graph shown, the area ABC represents consumer surplus in an economy with:
109. This graph demonstrates the domestic demand and supply for a good, as well as a tariff and the
world price for that good.