17–21
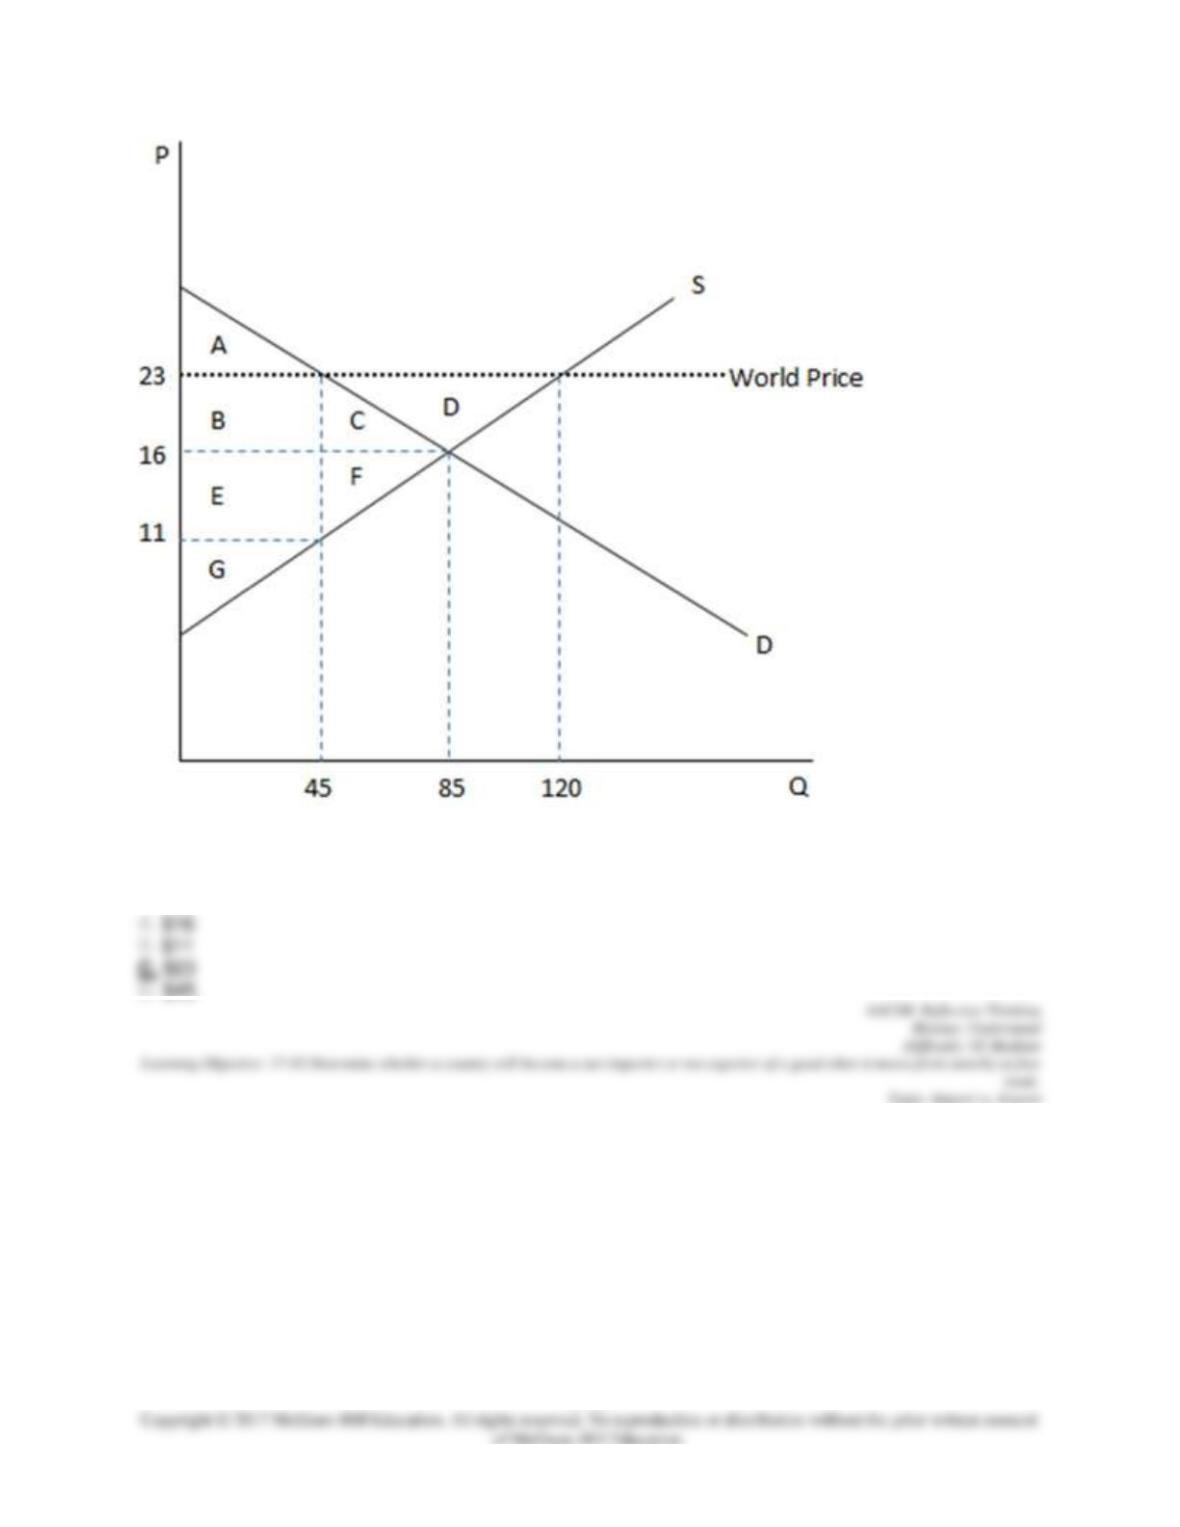
According to the graph shown, what is the world price?
56. This graph demonstrates the domestic demand and supply for a good, as well as the world price for
that good.
17–22
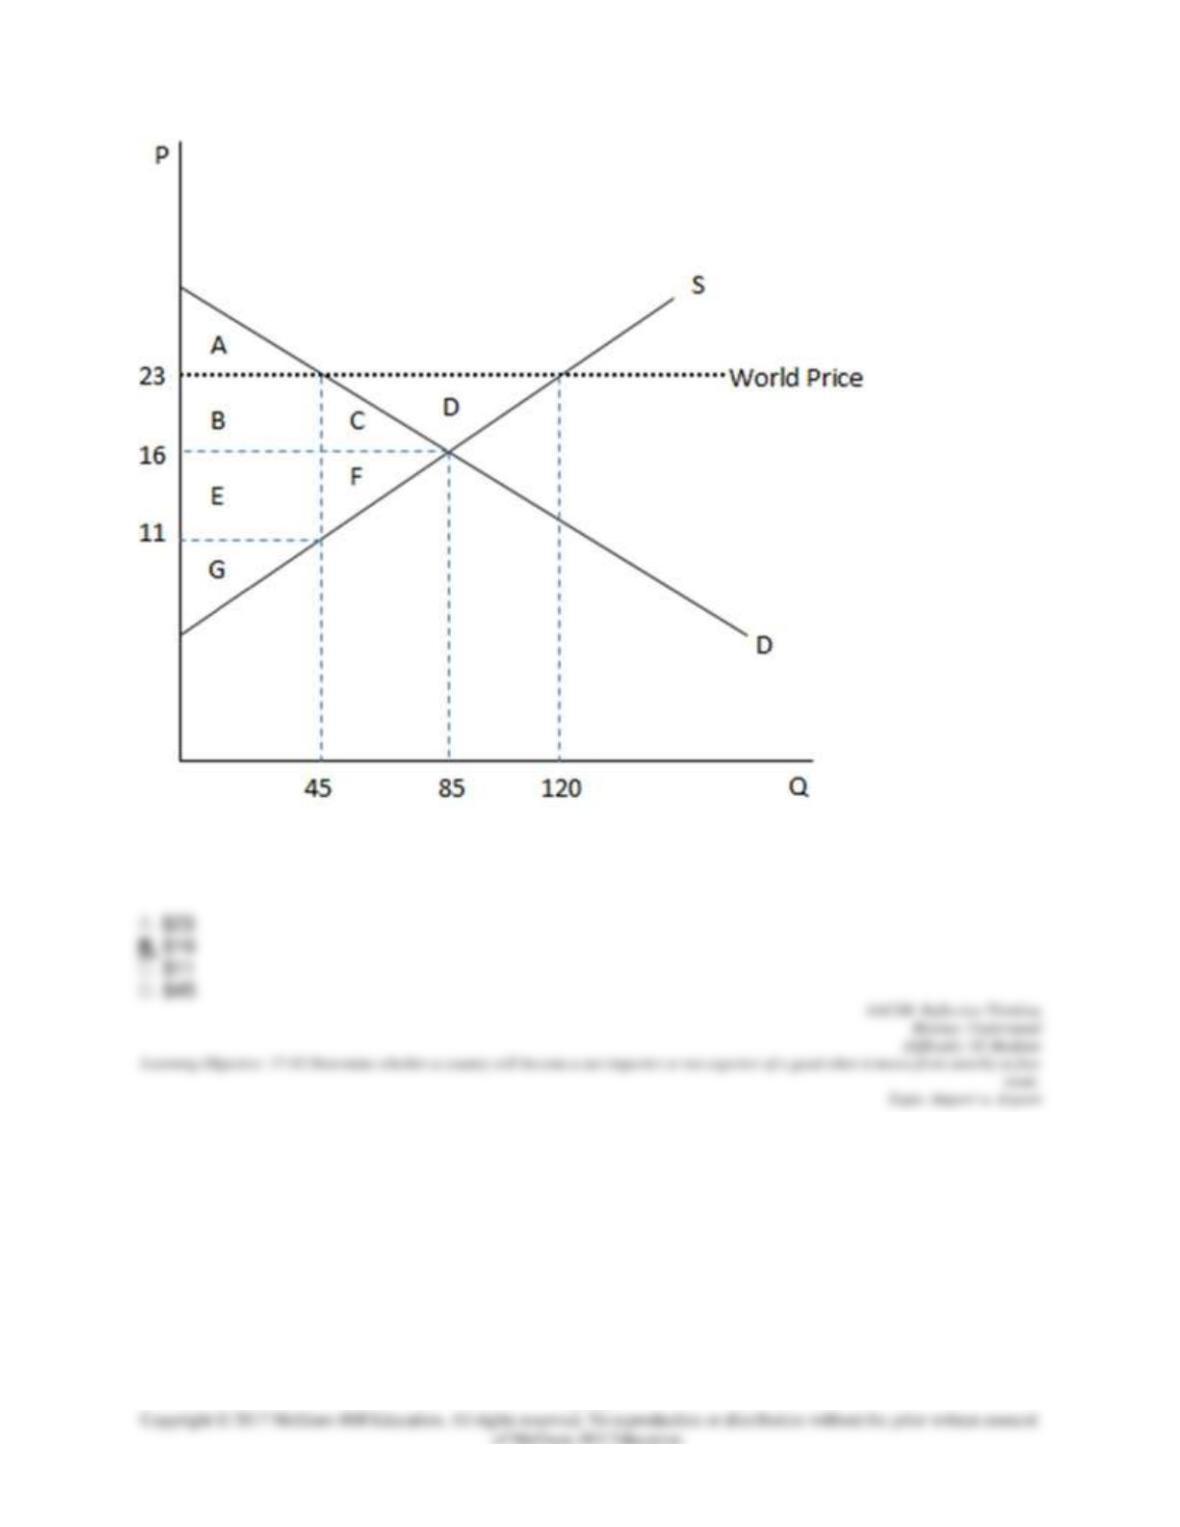
According to the graph shown, if this were depicting an autarky economy, the equilibrium price would be:
57. This graph demonstrates the domestic demand and supply for a good, as well as the world price for
that good.
17–23
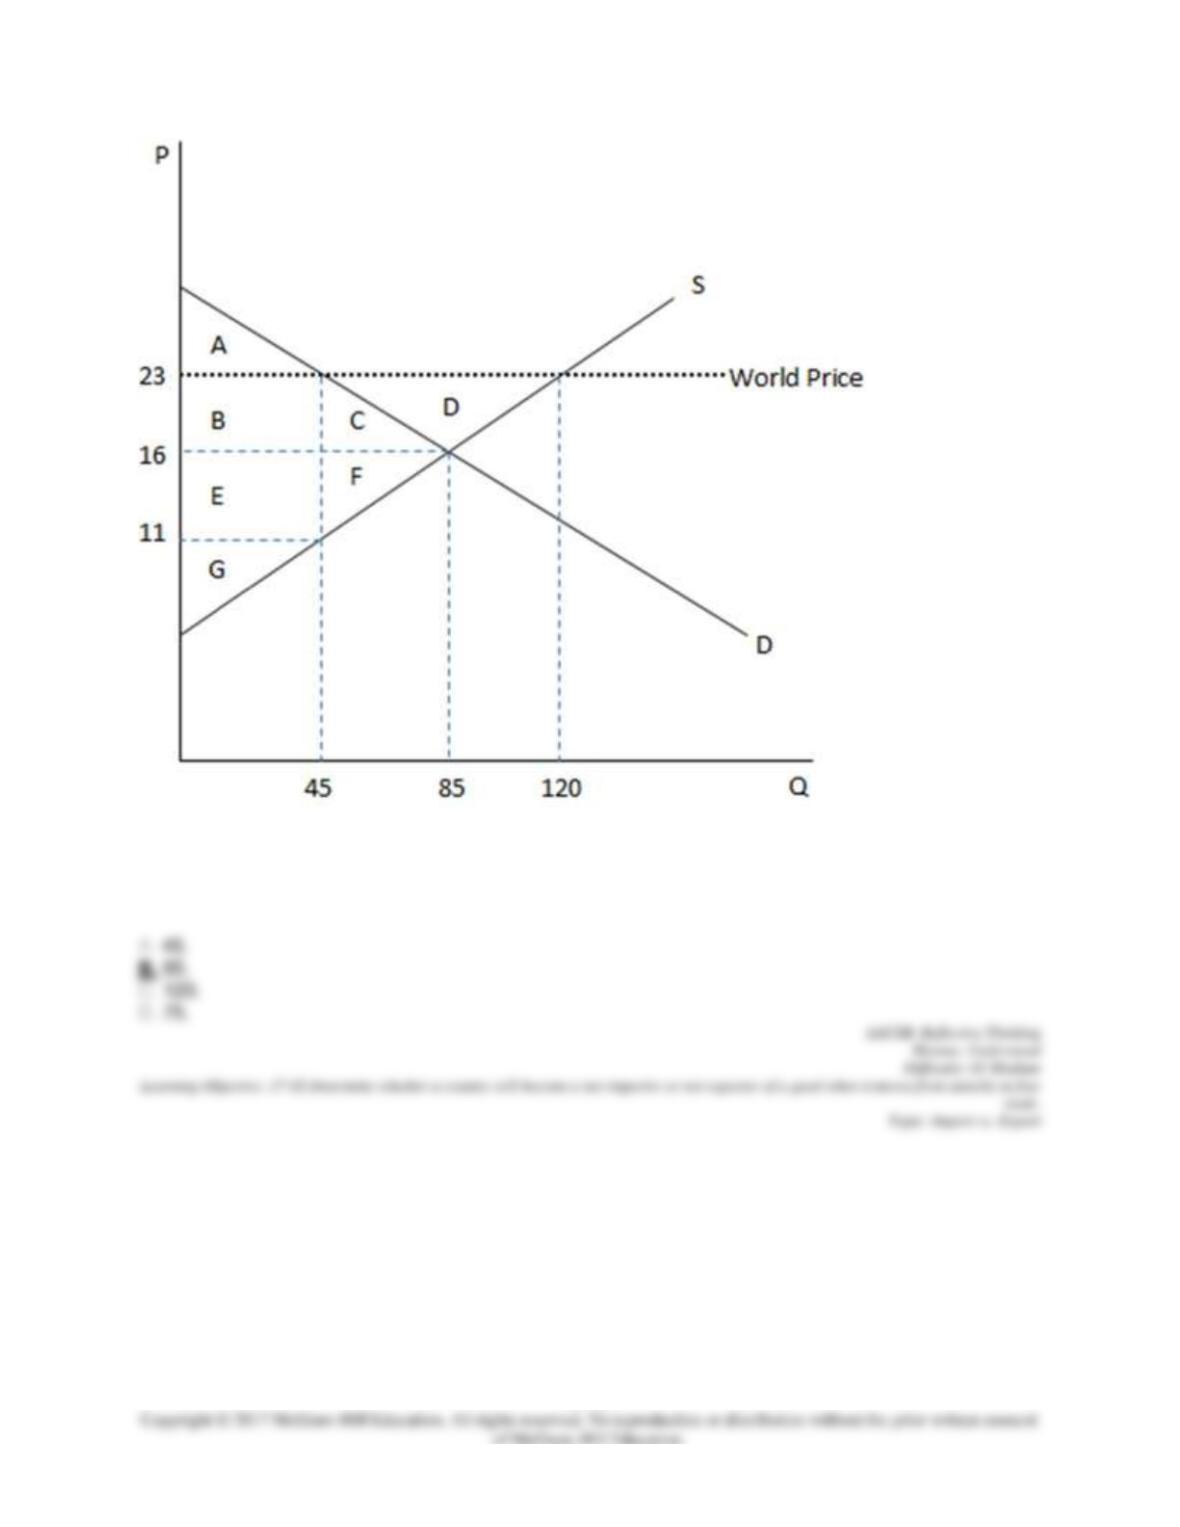
According to the graph shown, if this were depicting an autarky economy, the amount being sold
domestically is:
58. This graph demonstrates the domestic demand and supply for a good, as well as the world price for
that good.
17–24
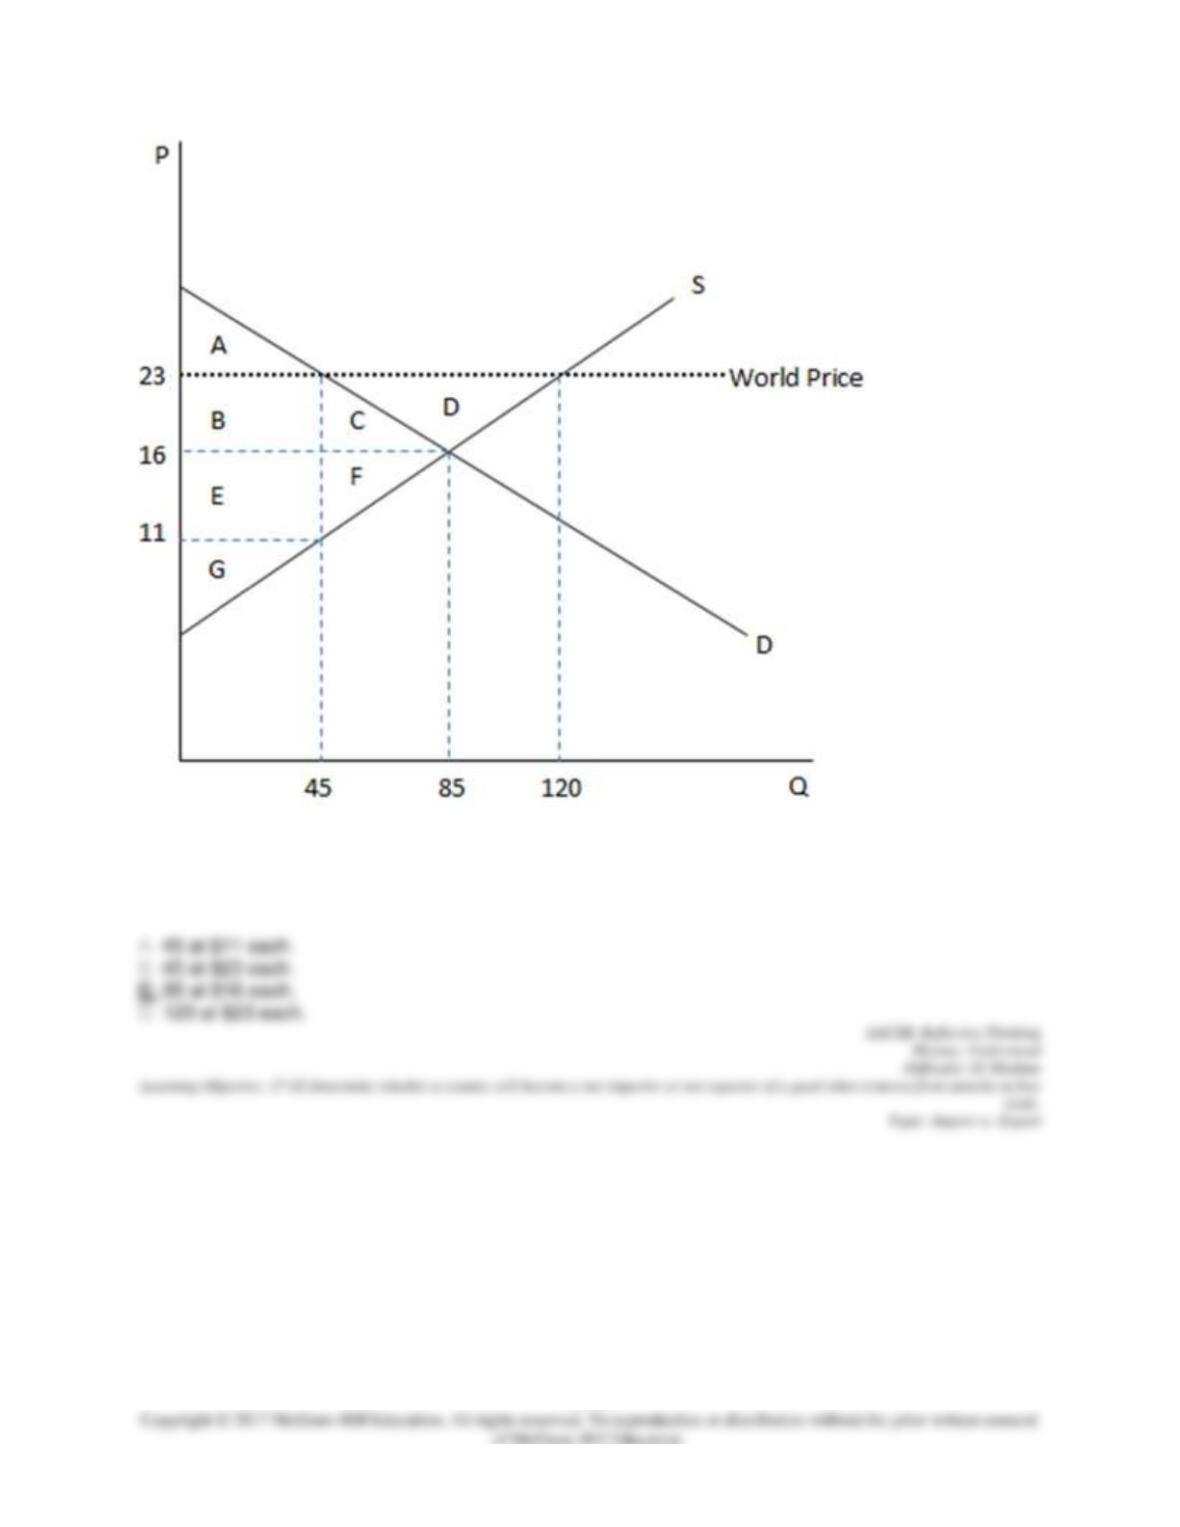
According to the graph shown, if this were depicting an autarky economy, the amount being bought
domestically is:
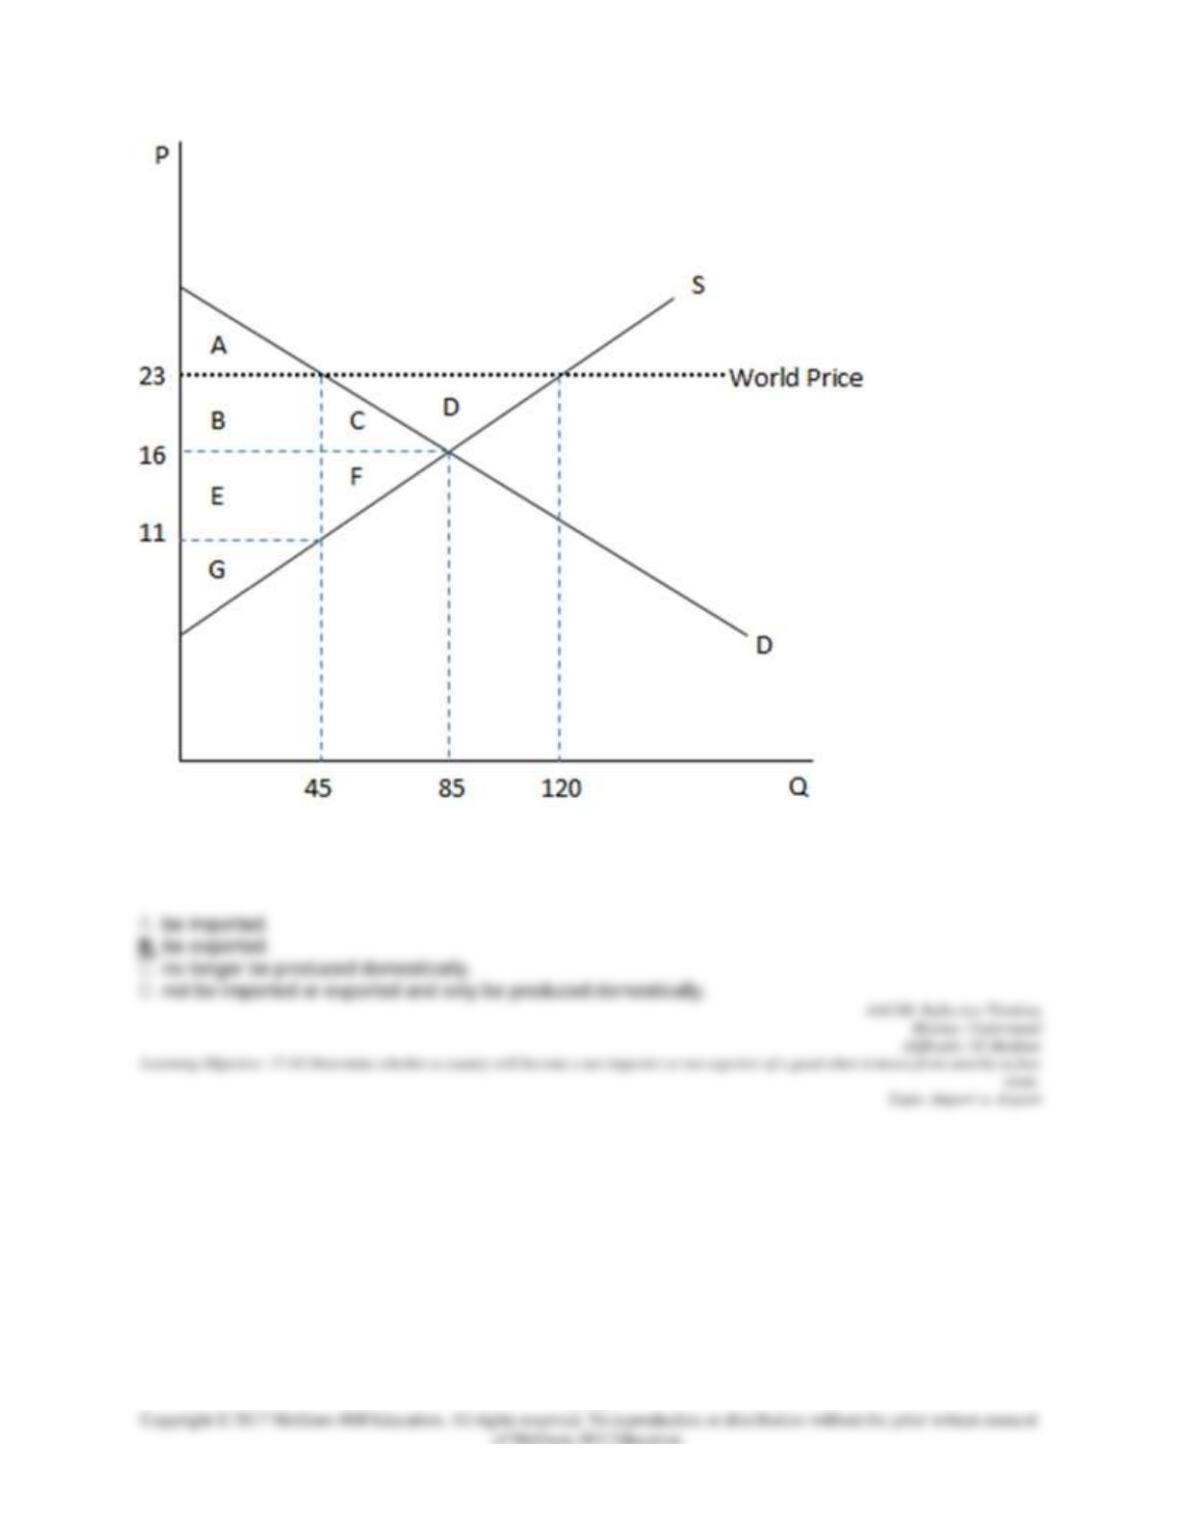
59. This graph demonstrates the domestic demand and supply for a good, as well as the world price for
that good.
17–25
According to the graph shown, if this economy was to engage in free trade, the good would:
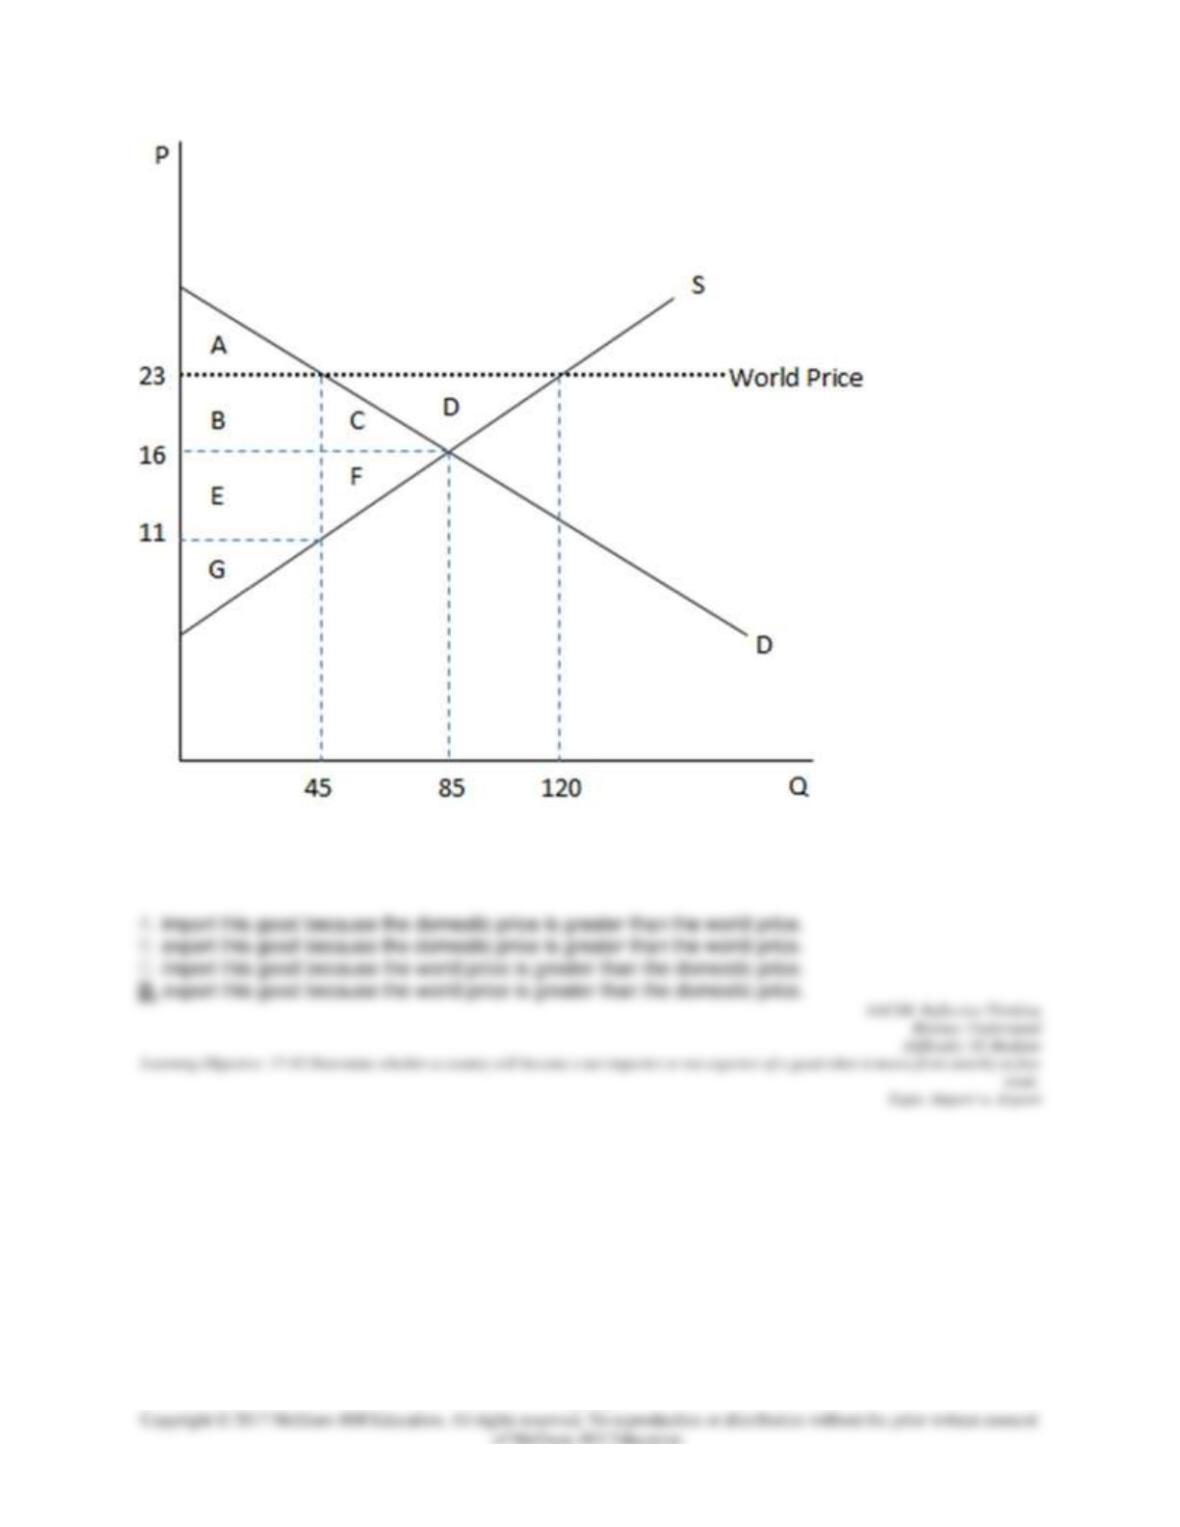
60. This graph demonstrates the domestic demand and supply for a good, as well as the world price for
that good.
17–26
According to the graph shown, if this economy were open to free trade, it would:
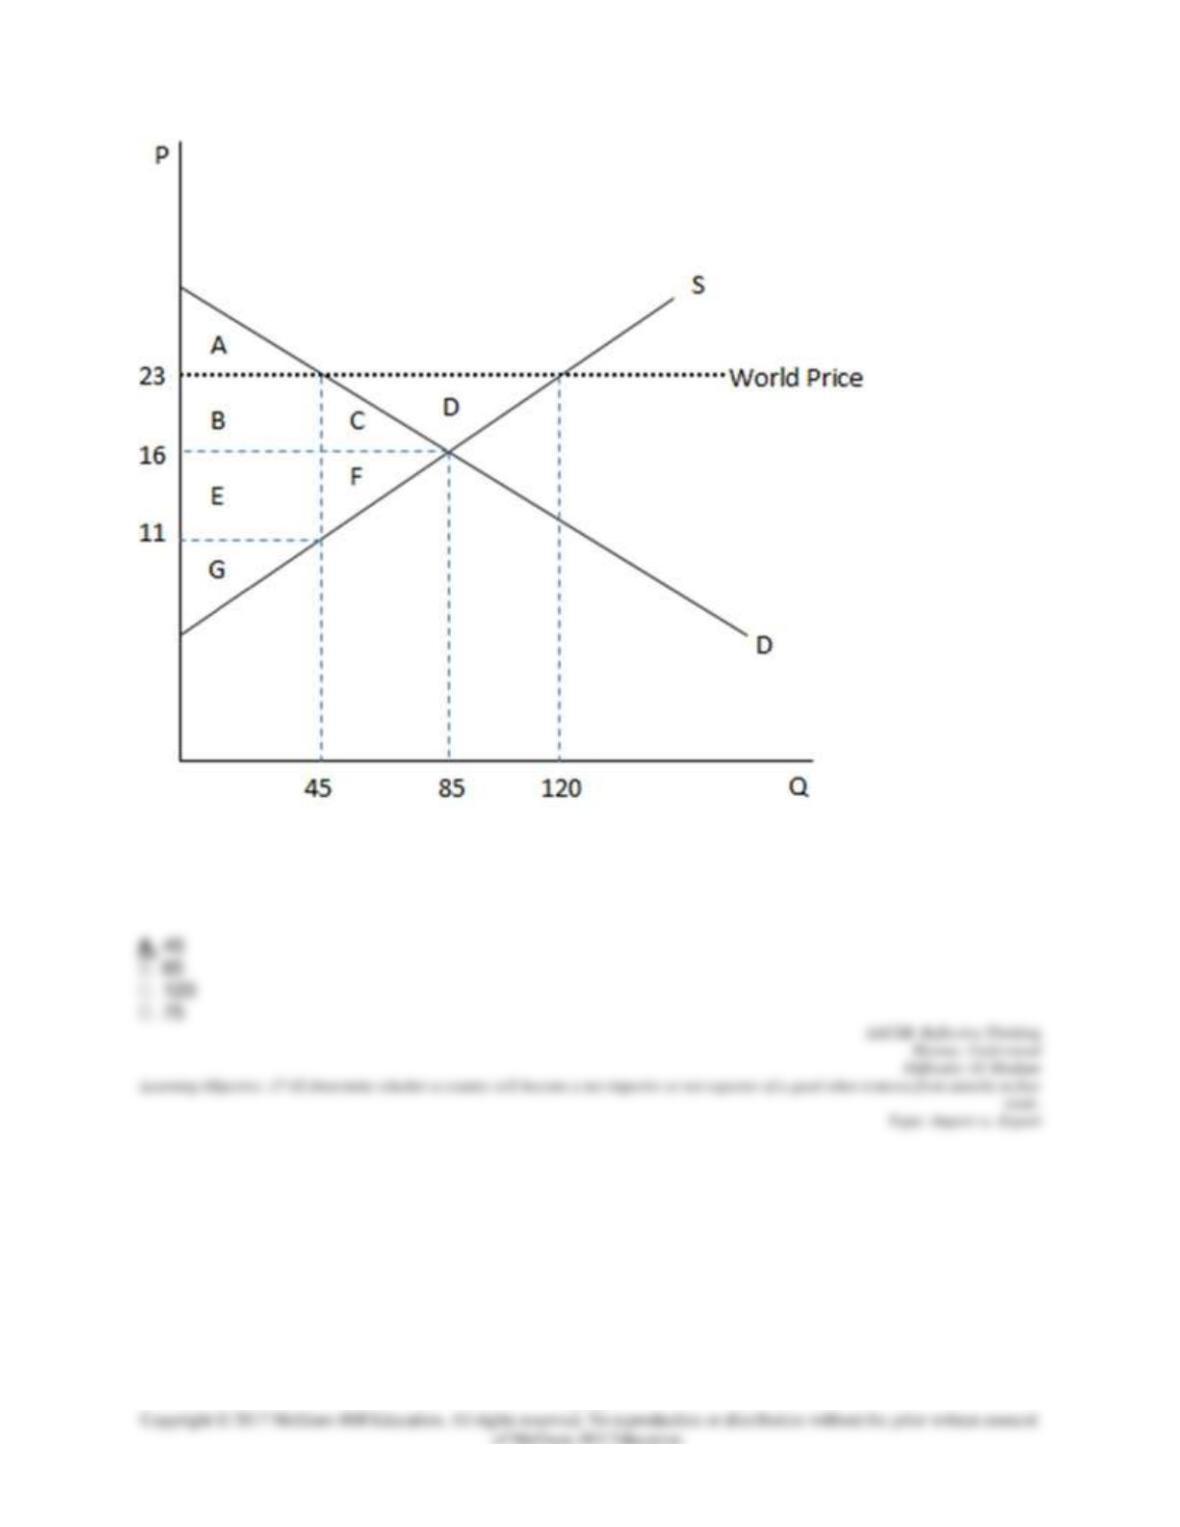
61. This graph demonstrates the domestic demand and supply for a good, as well as the world price for
that good.
17–27
According to the graph shown, if this economy were open to free trade, domestic consumers would
consume how many units?
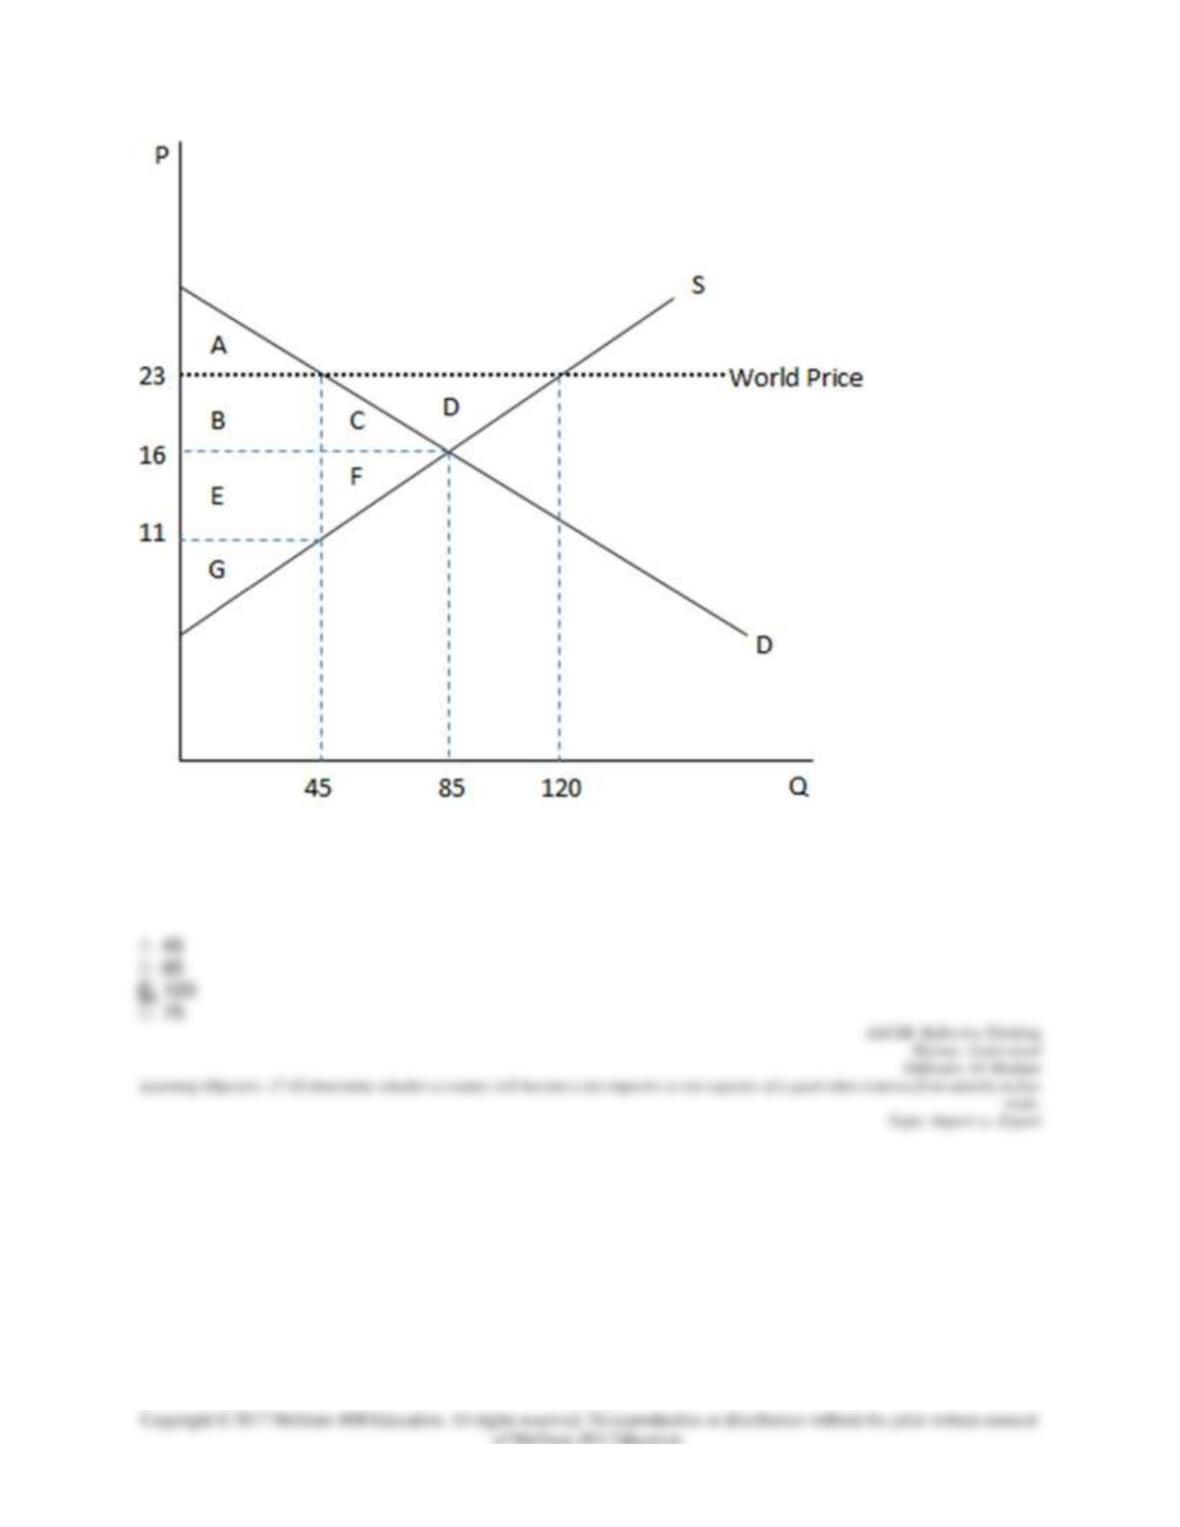
62. This graph demonstrates the domestic demand and supply for a good, as well as the world price for
that good.
17–28
According to the graph shown, if this economy were open to free trade, domestic producers would
produce how many units?
63. This graph demonstrates the domestic demand and supply for a good, as well as the world price for
that good.
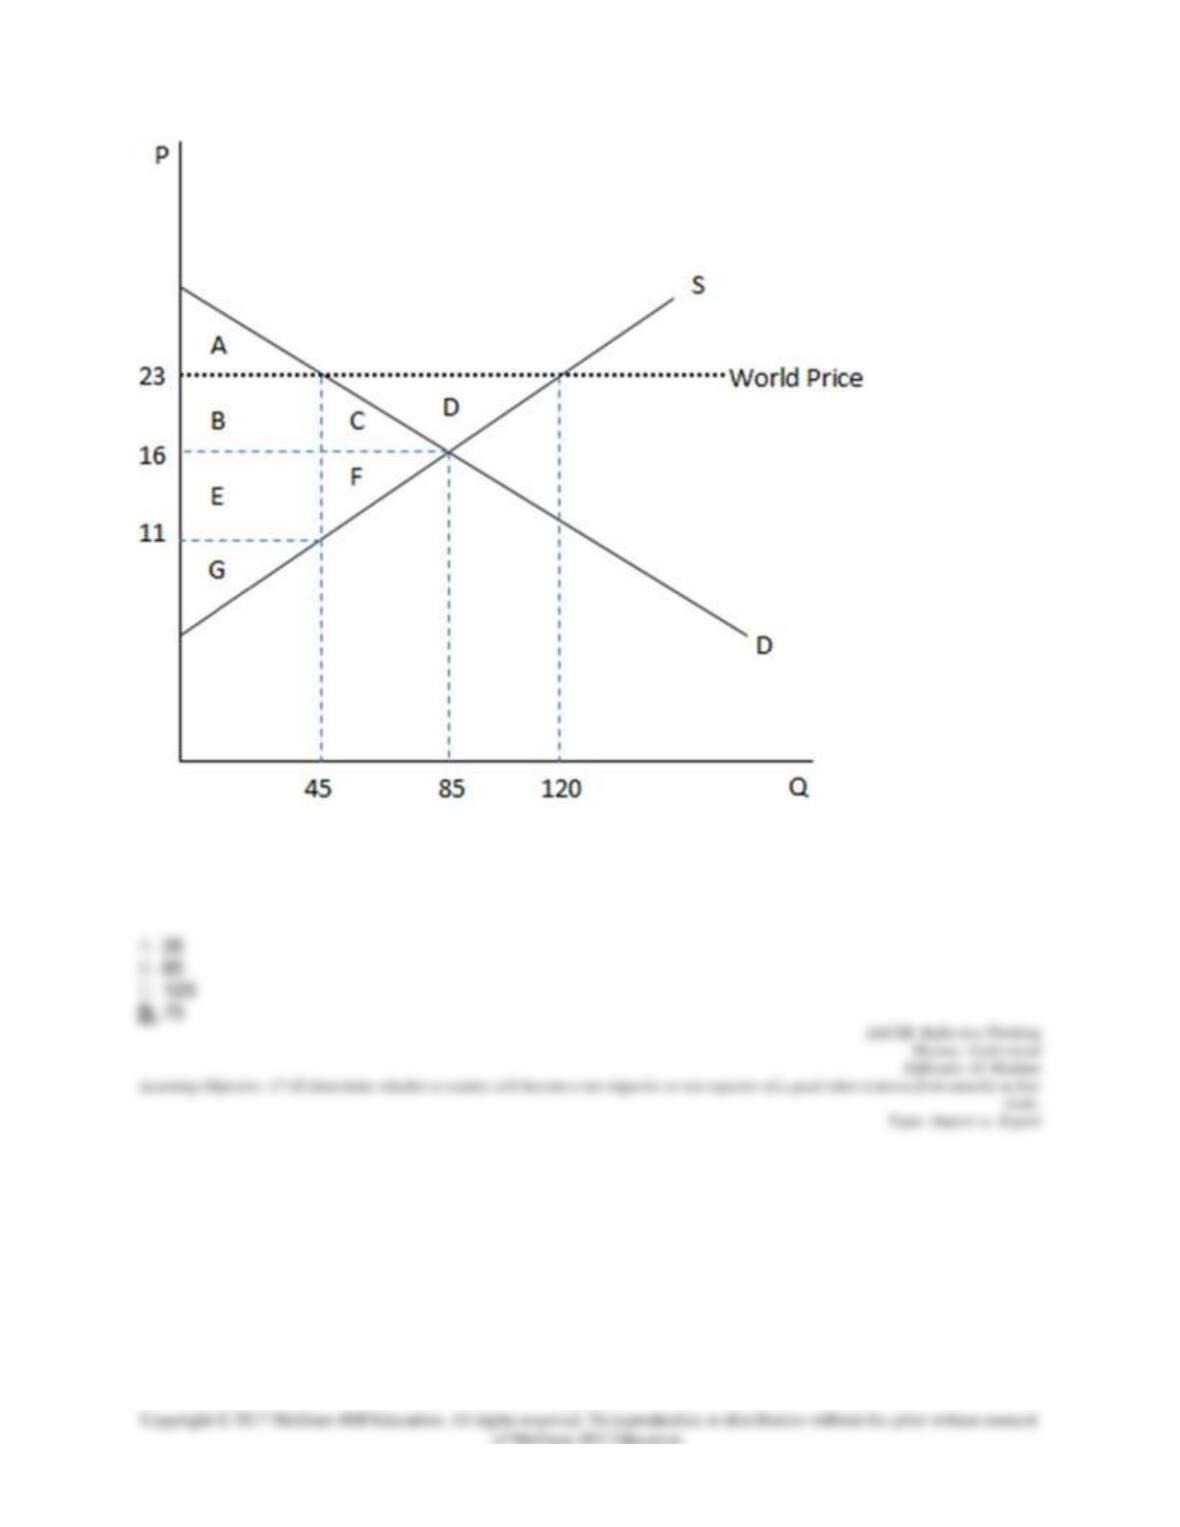
17–29
According to the graph shown, if this economy were open to free trade, how many units would be
exported?
64. This graph demonstrates the domestic demand and supply for a good, as well as the world price for
that good.
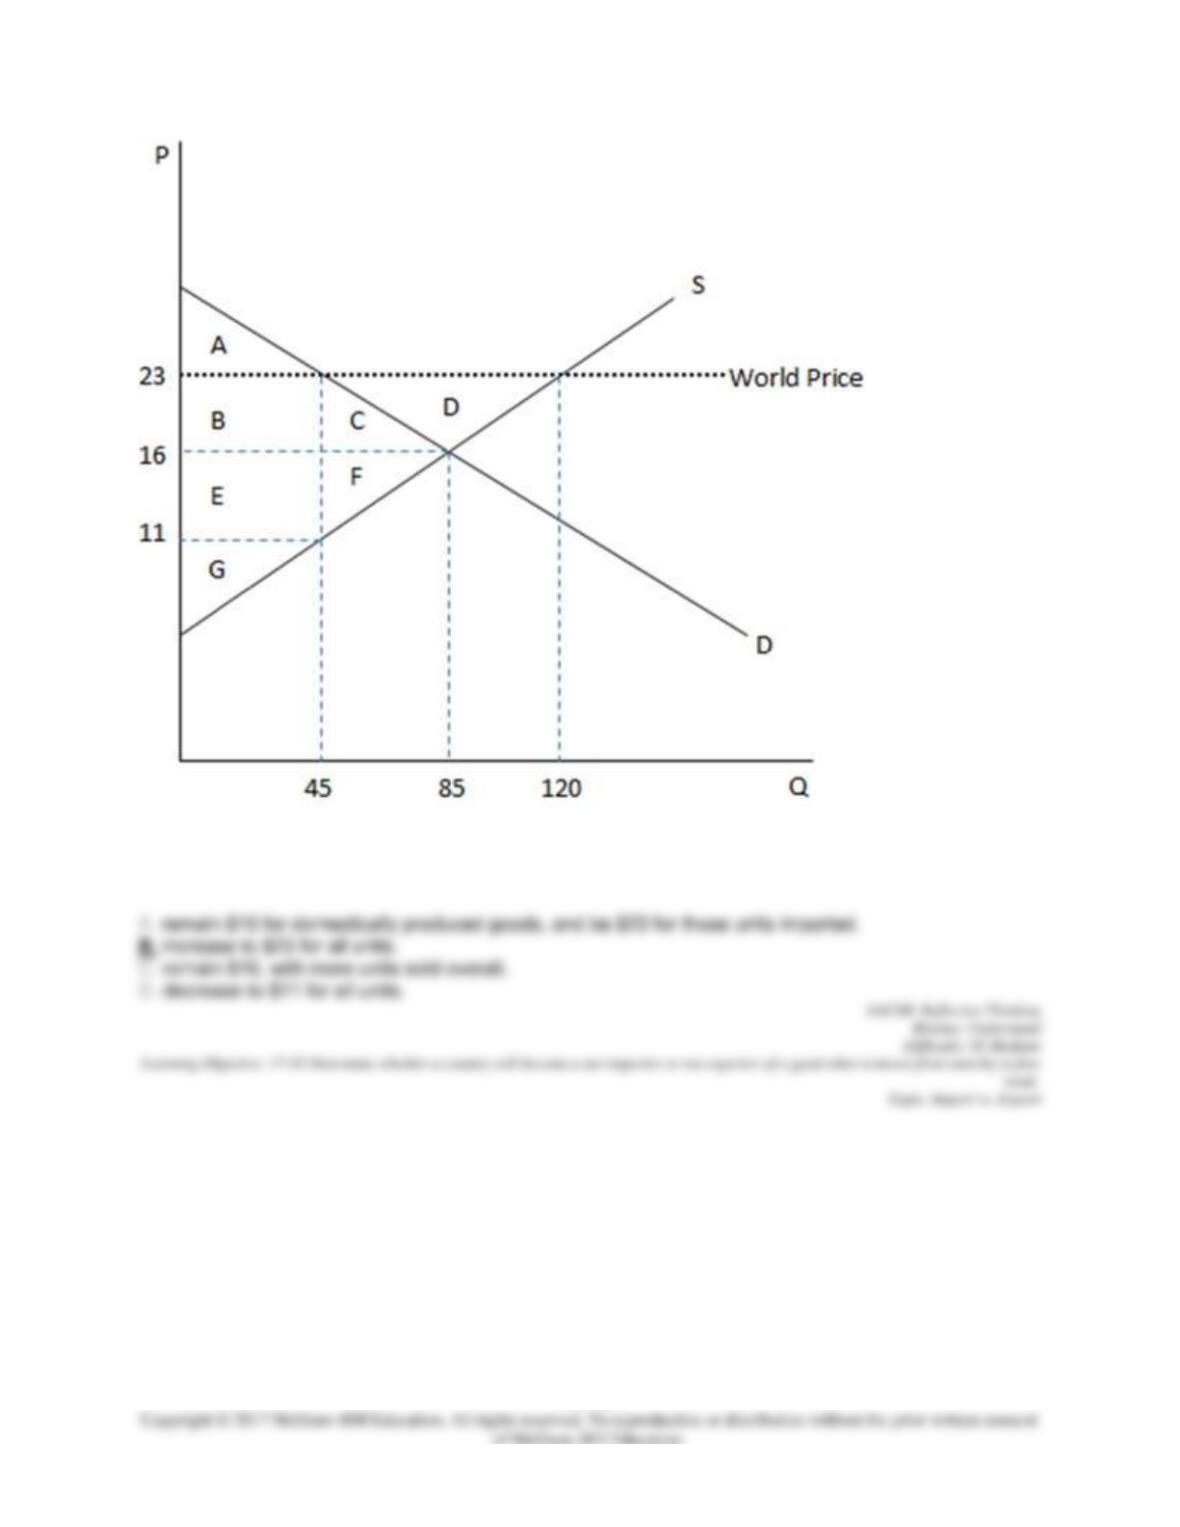
17–30
According to the graph shown, if this economy were to open to trade, domestic prices would:
65. This graph demonstrates the domestic demand and supply for a good, as well as the world price for
that good.
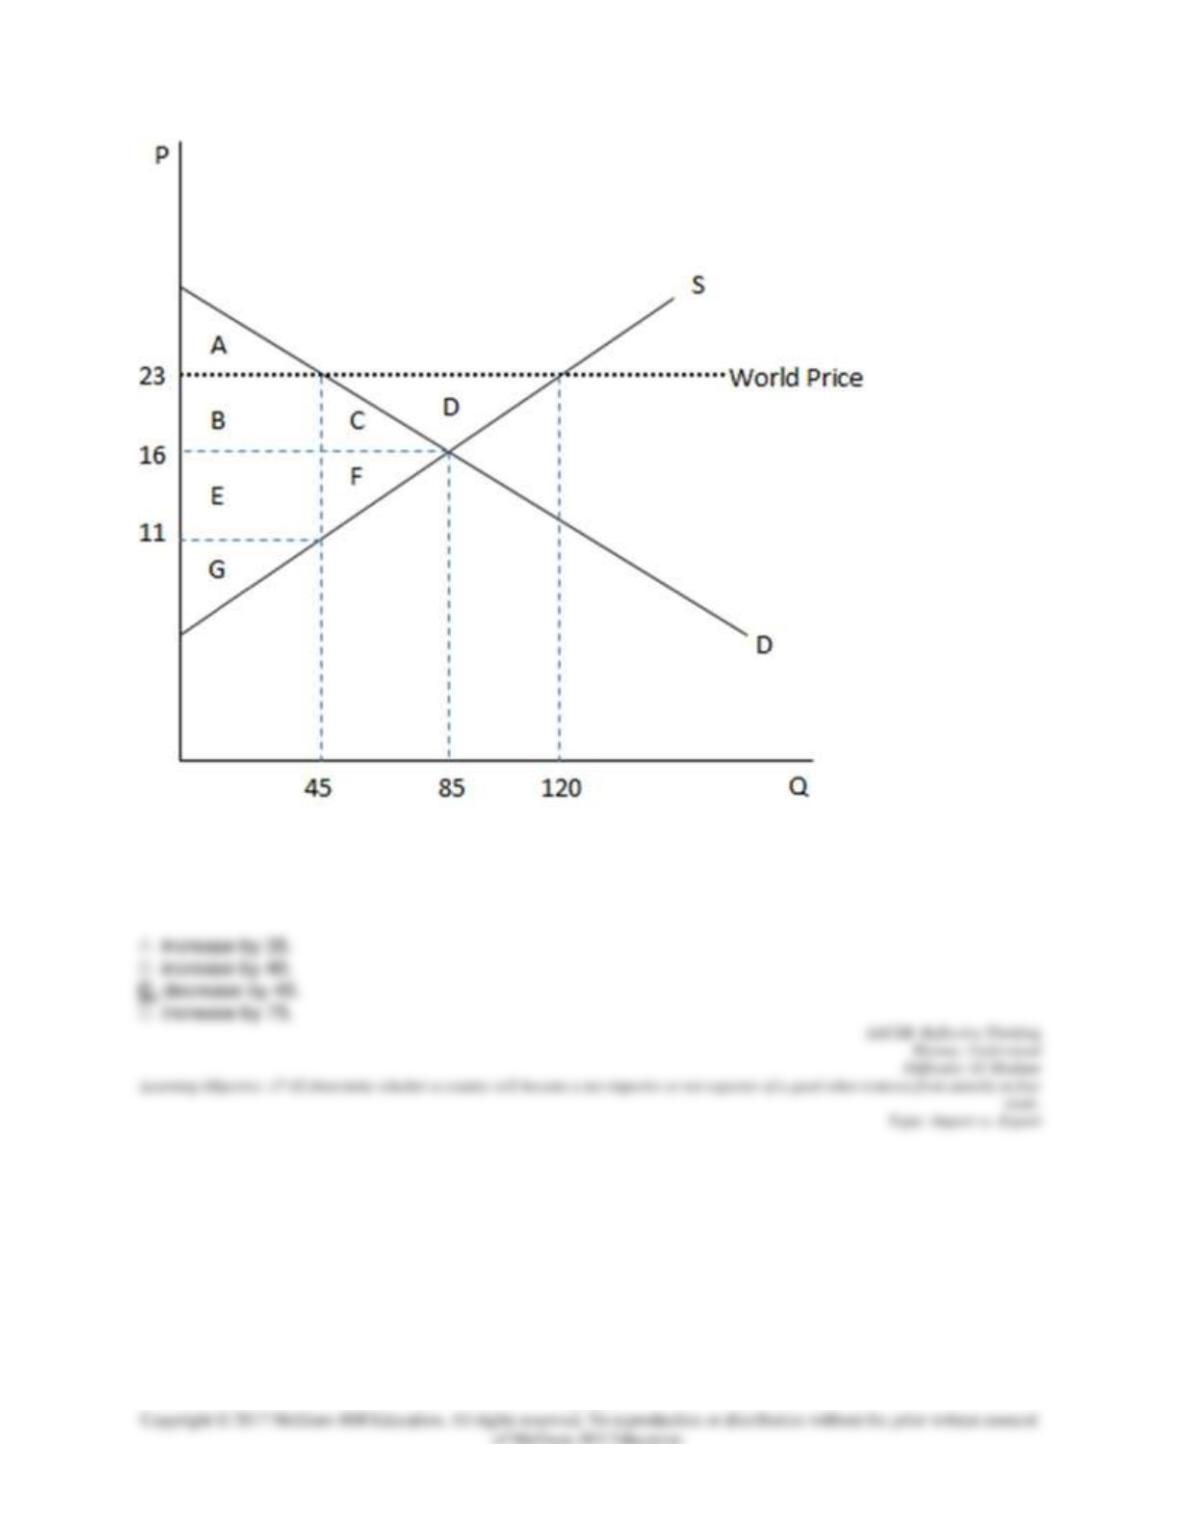
17–31
According to the graph shown, if this economy were to open to trade, the amount consumed domestically
would:
66. This graph demonstrates the domestic demand and supply for a good, as well as the world price for
that good.
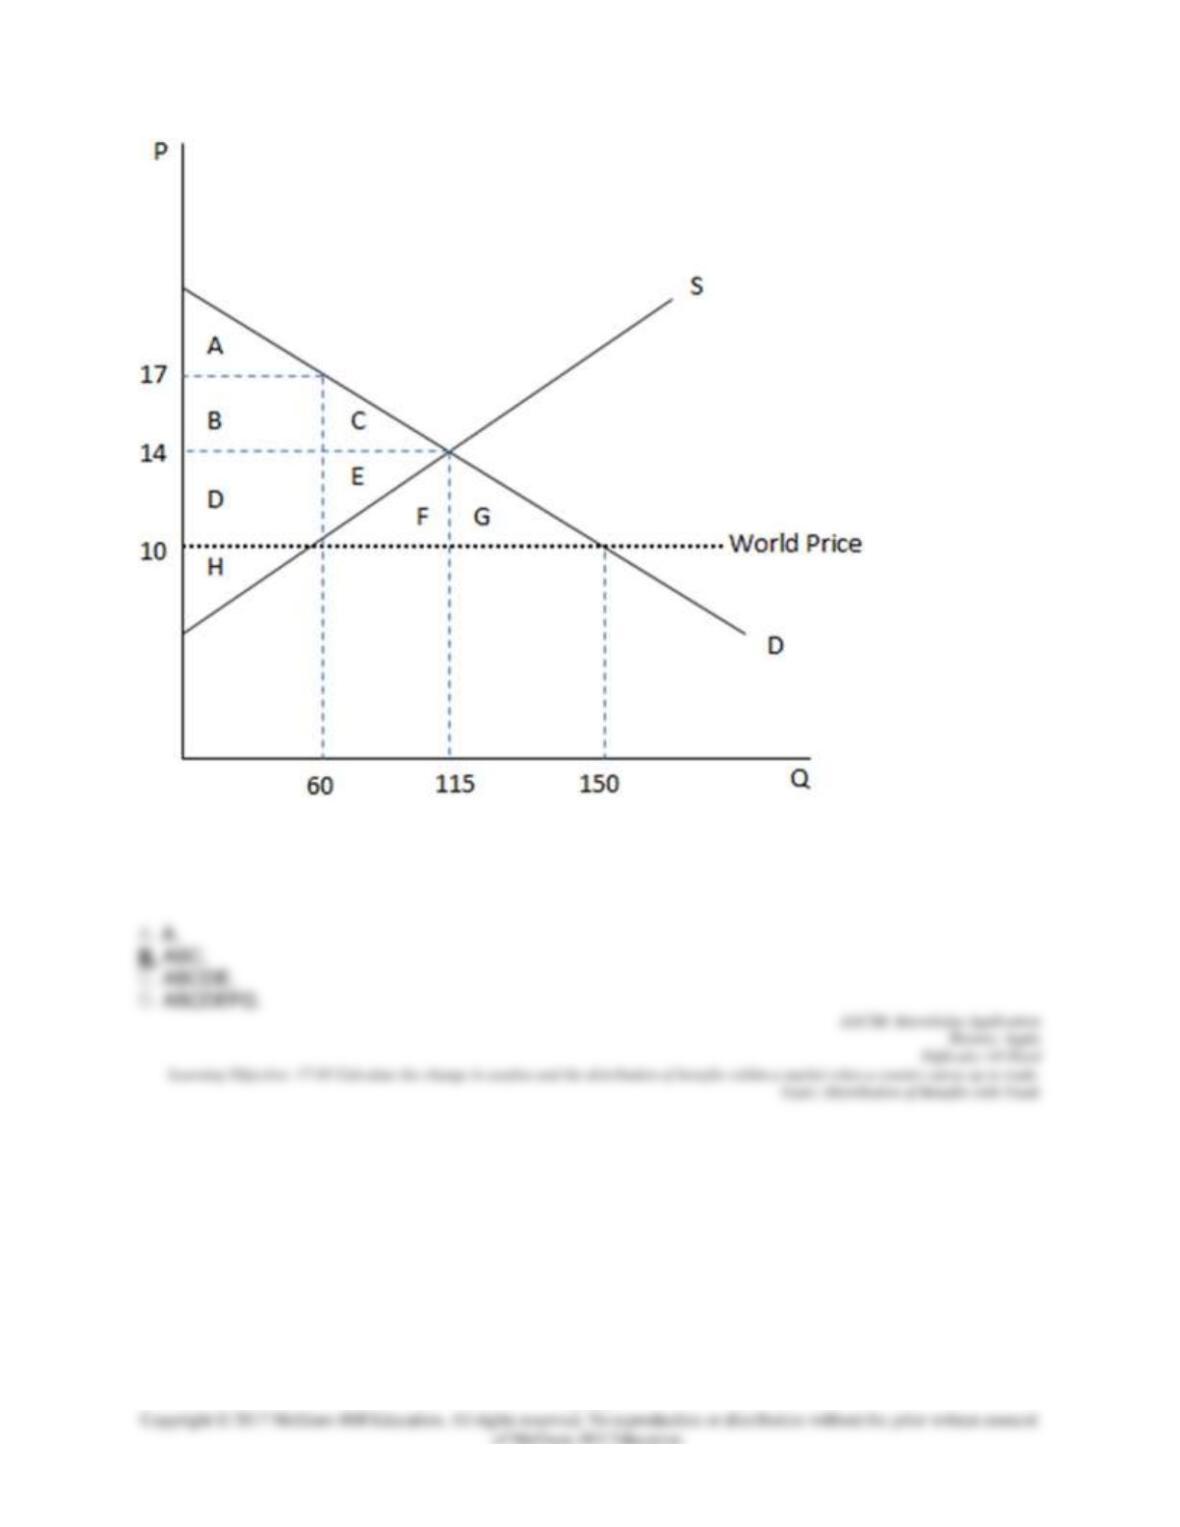
17–32
According to the graph shown, if this economy were an autarky, consumers would get area______ in
consumer surplus:
67. This graph demonstrates the domestic demand and supply for a good, as well as the world price for
that good.
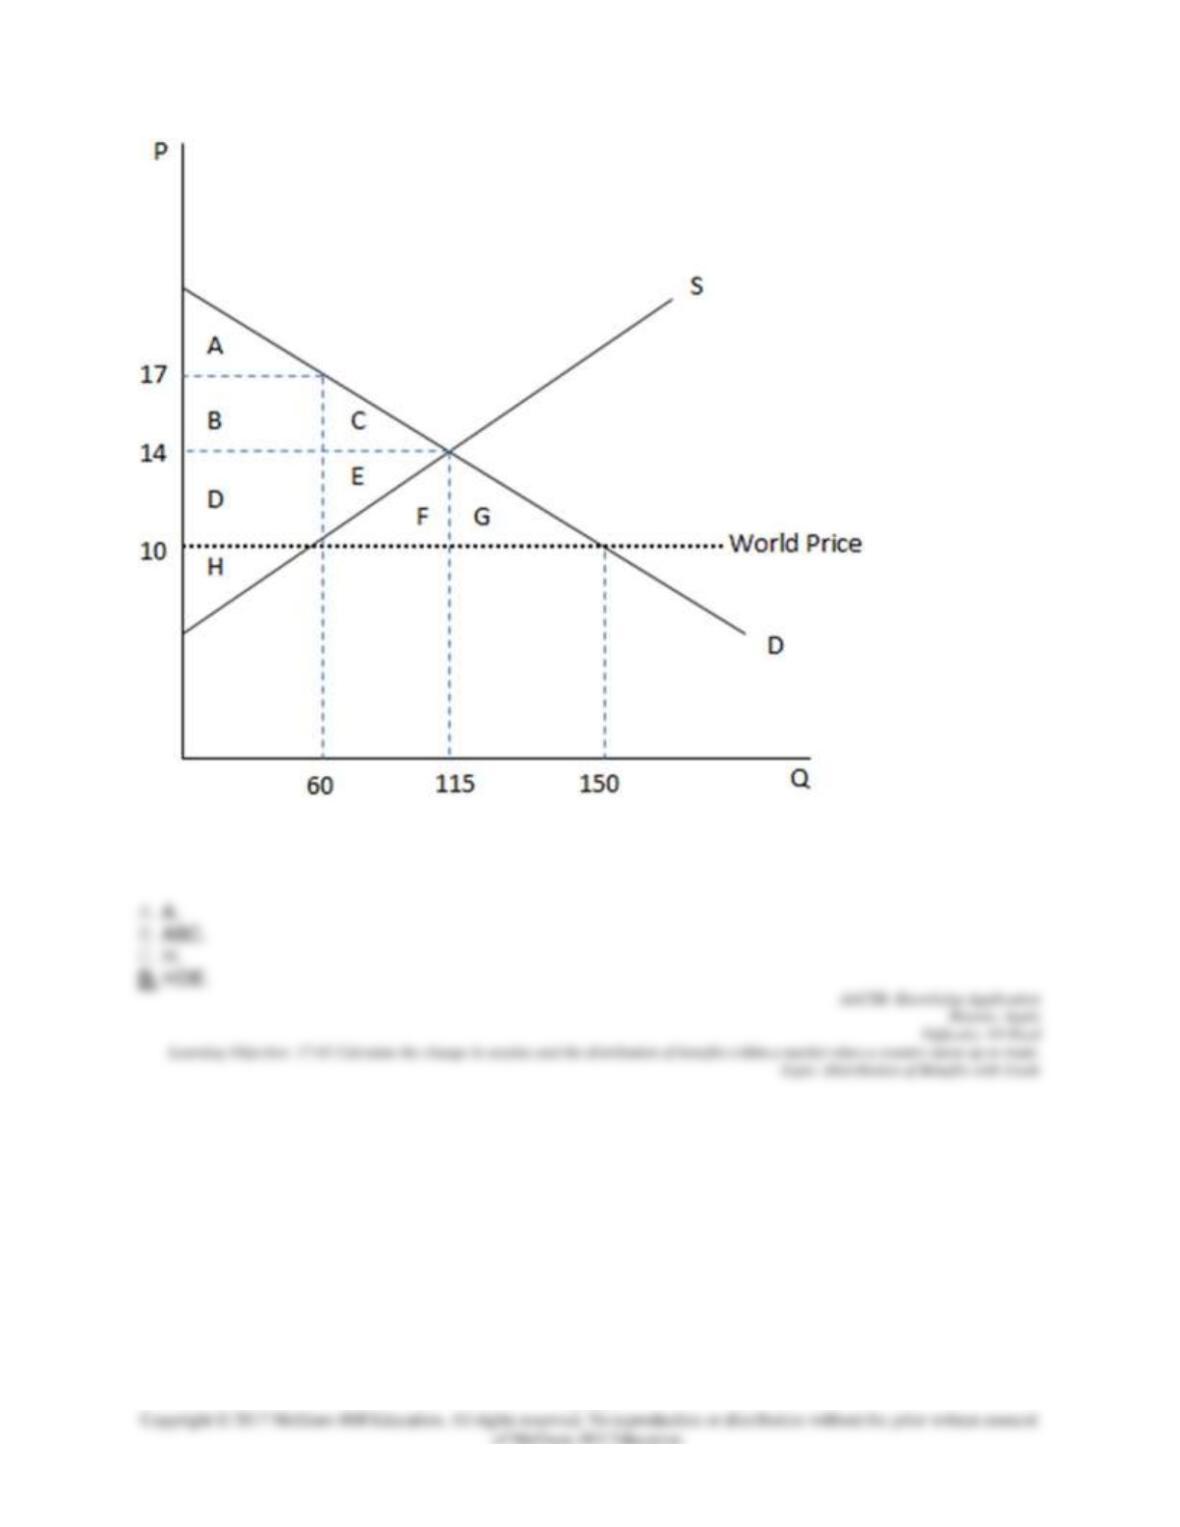
17–33
According to the graph shown, if this economy were an autarky, producers would enjoy area:
68. This graph demonstrates the domestic demand and supply for a good, as well as the world price for
that good.
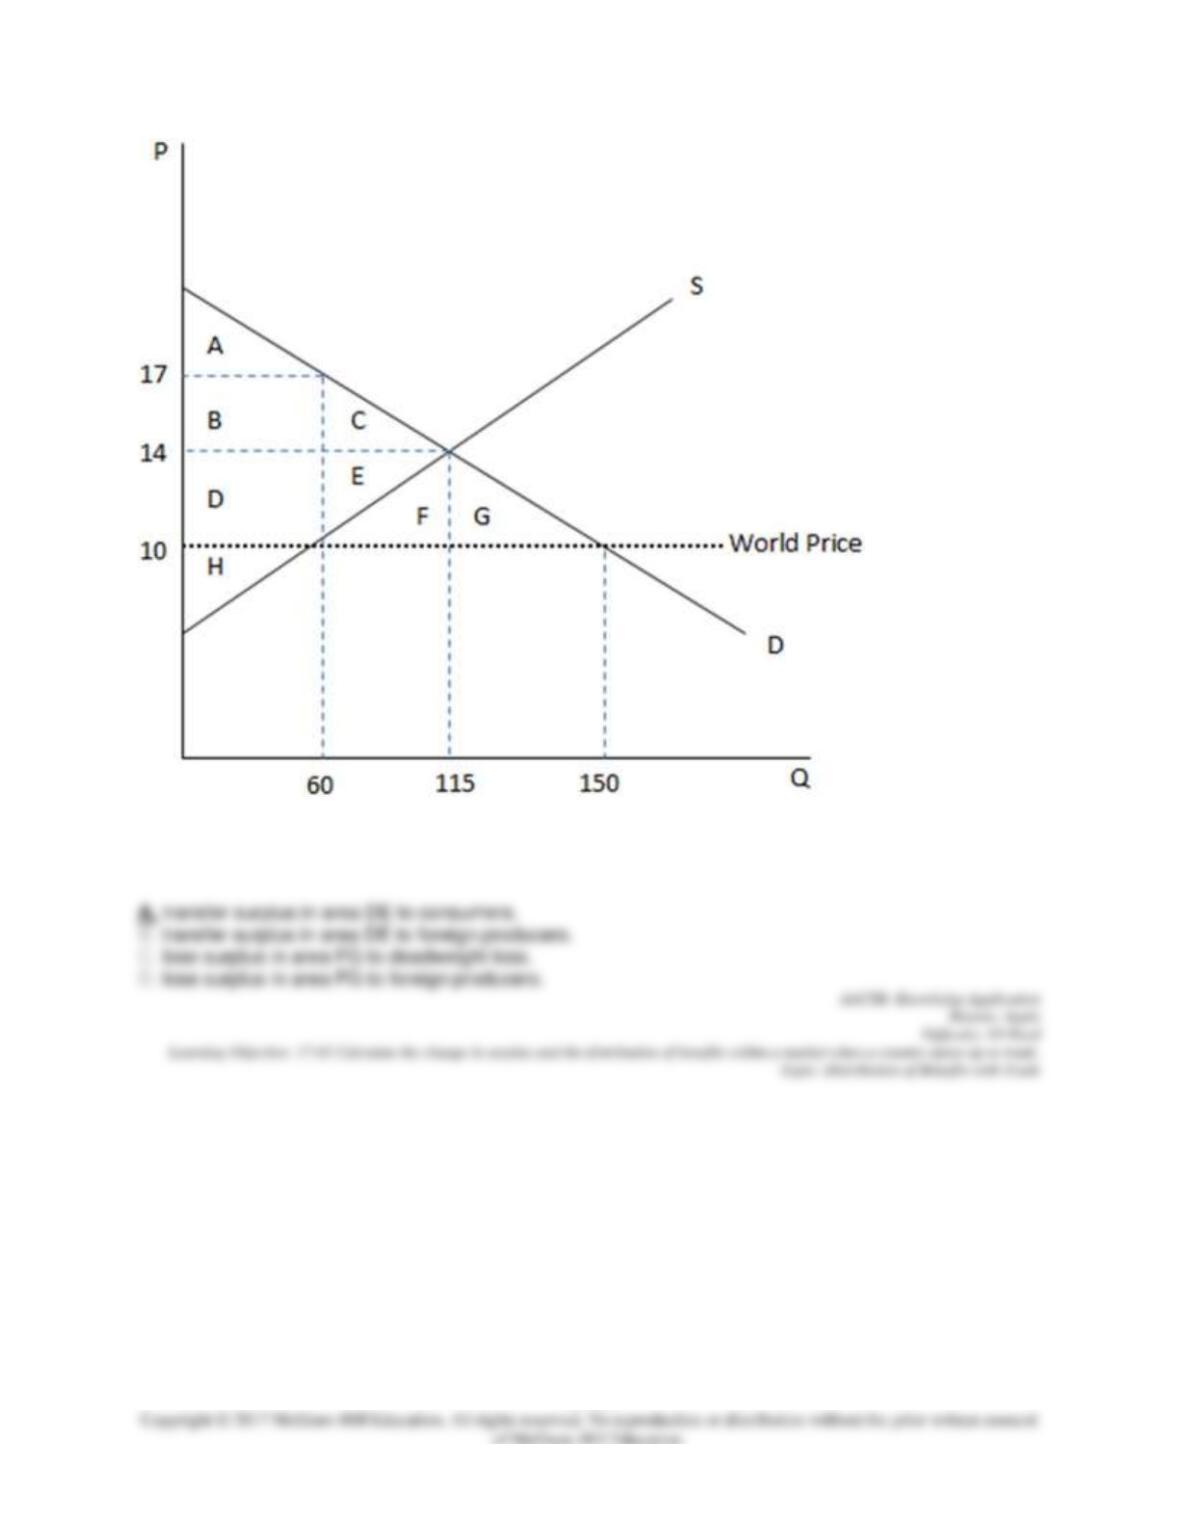
17–34
According to the graph shown, if this economy were to open to trade, domestic producers would:
69. This graph demonstrates the domestic demand and supply for a good, as well as the world price for
that good.
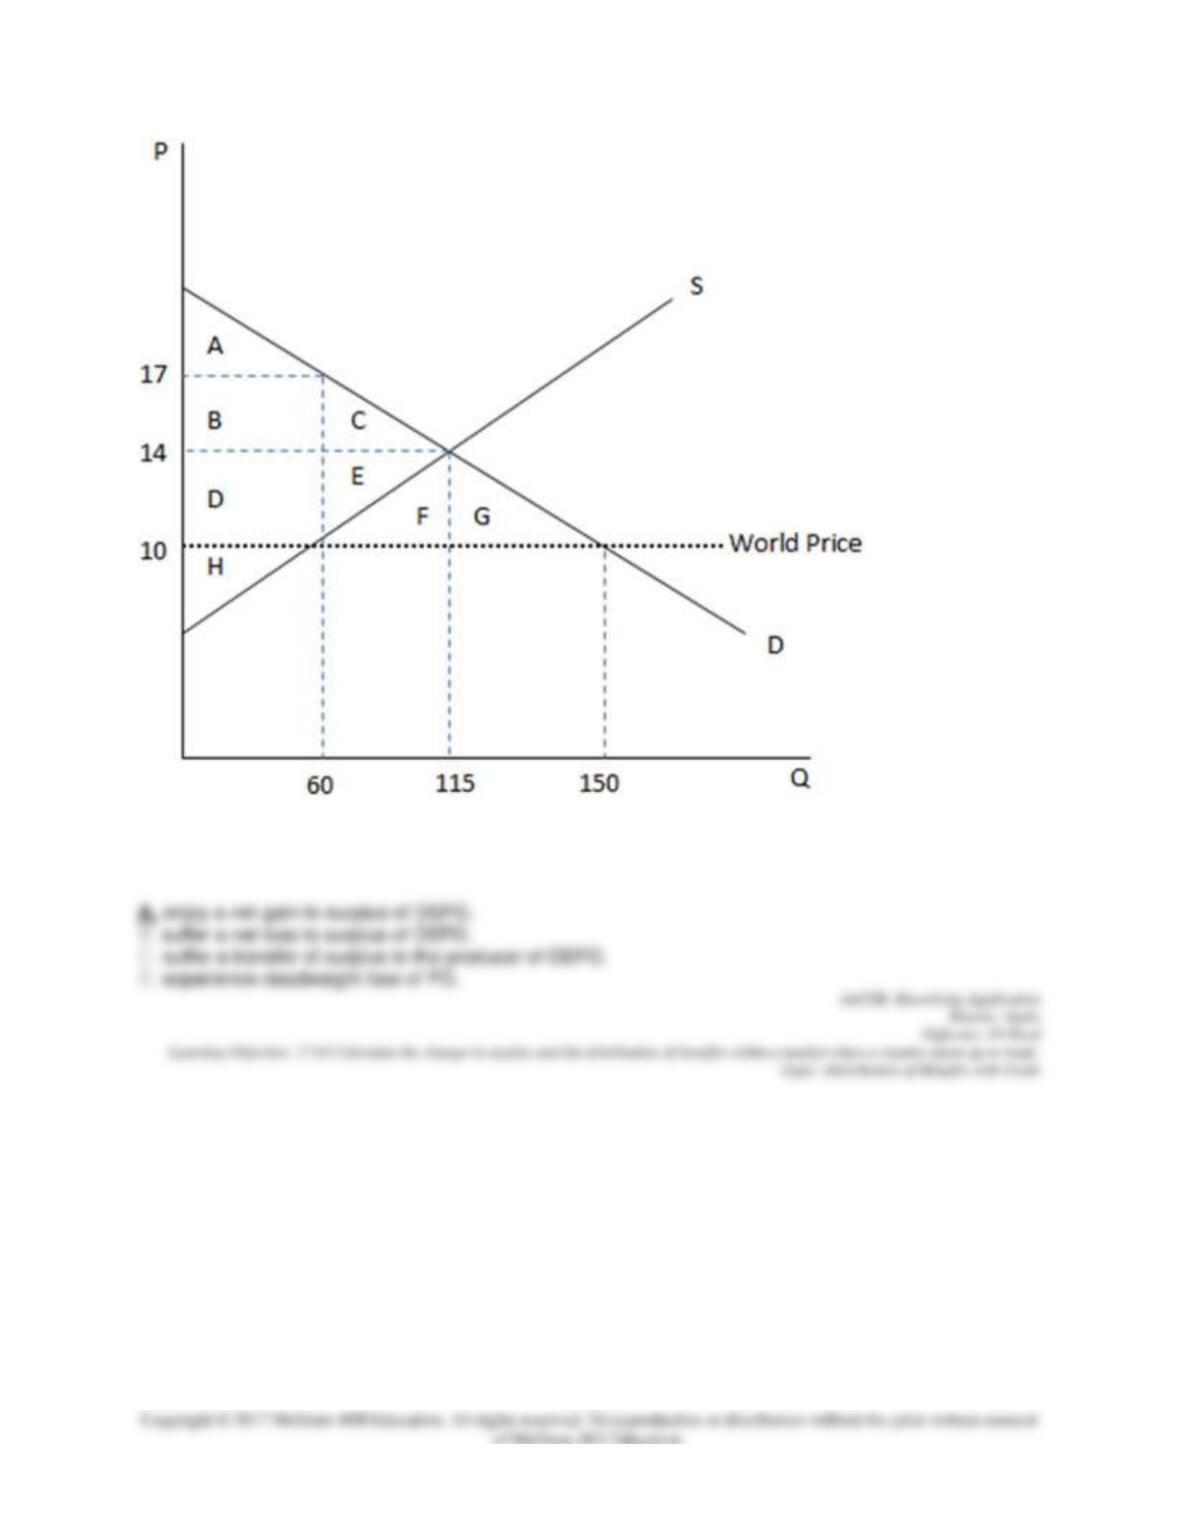
17–35
According to the graph shown, if this economy were to open to trade, consumers would:
70. This graph demonstrates the domestic demand and supply for a good, as well as the world price for
that good.
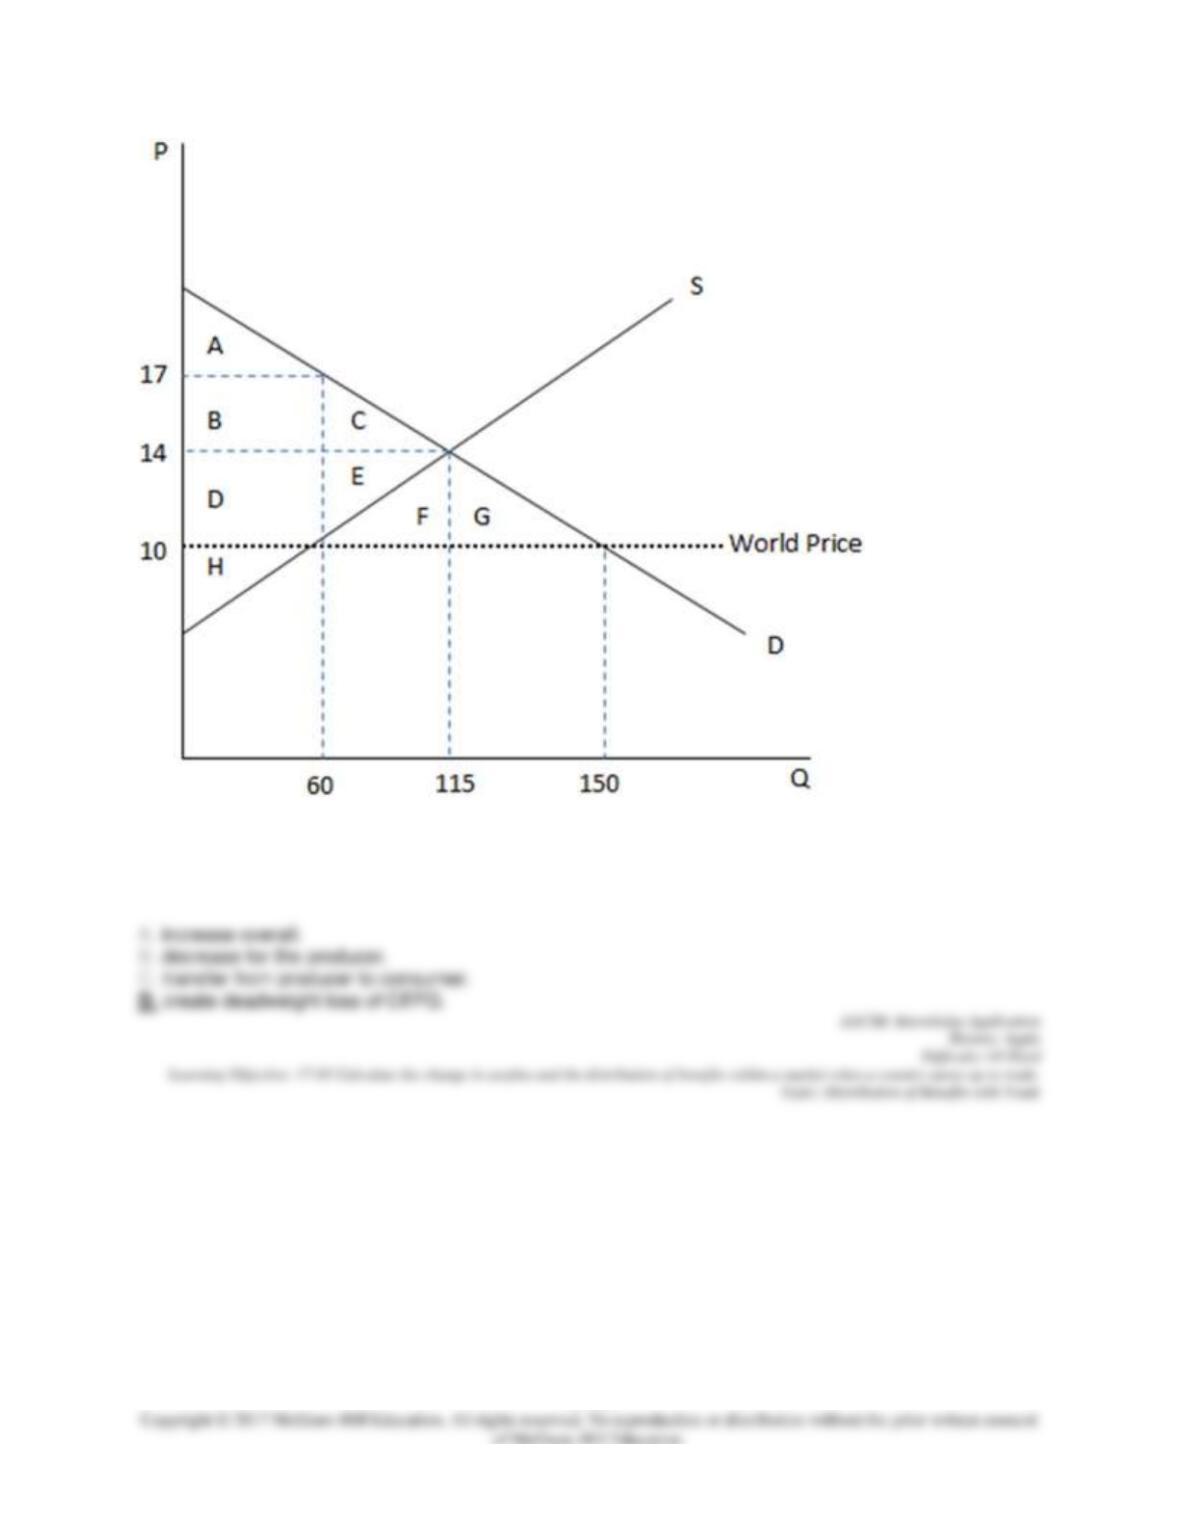
17–36
According to the graph shown, if this economy were to open to trade, surplus would do all of the following
except:
71. This graph demonstrates the domestic demand and supply for a good, as well as the world price for
that good.
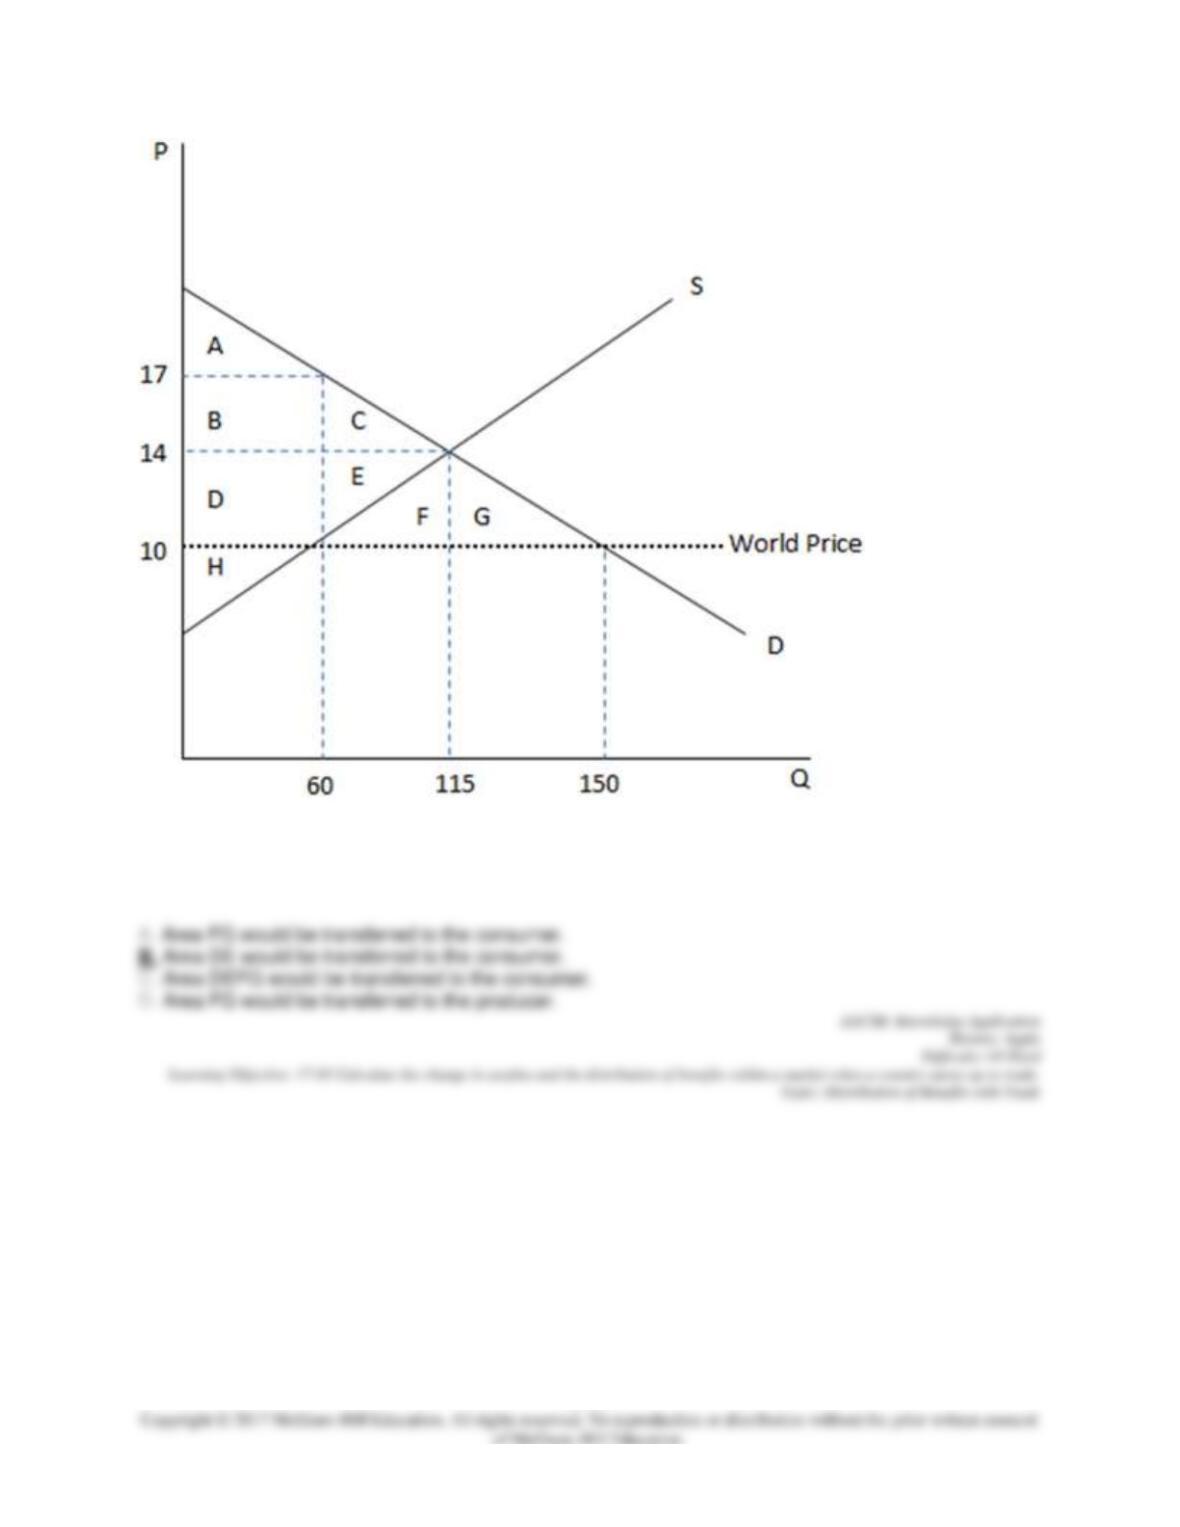
17–37
According to the graph shown, if this economy were to open to trade, which amount of surplus would be
transferred?
72. This graph demonstrates the domestic demand and supply for a good, as well as the world price for
that good.
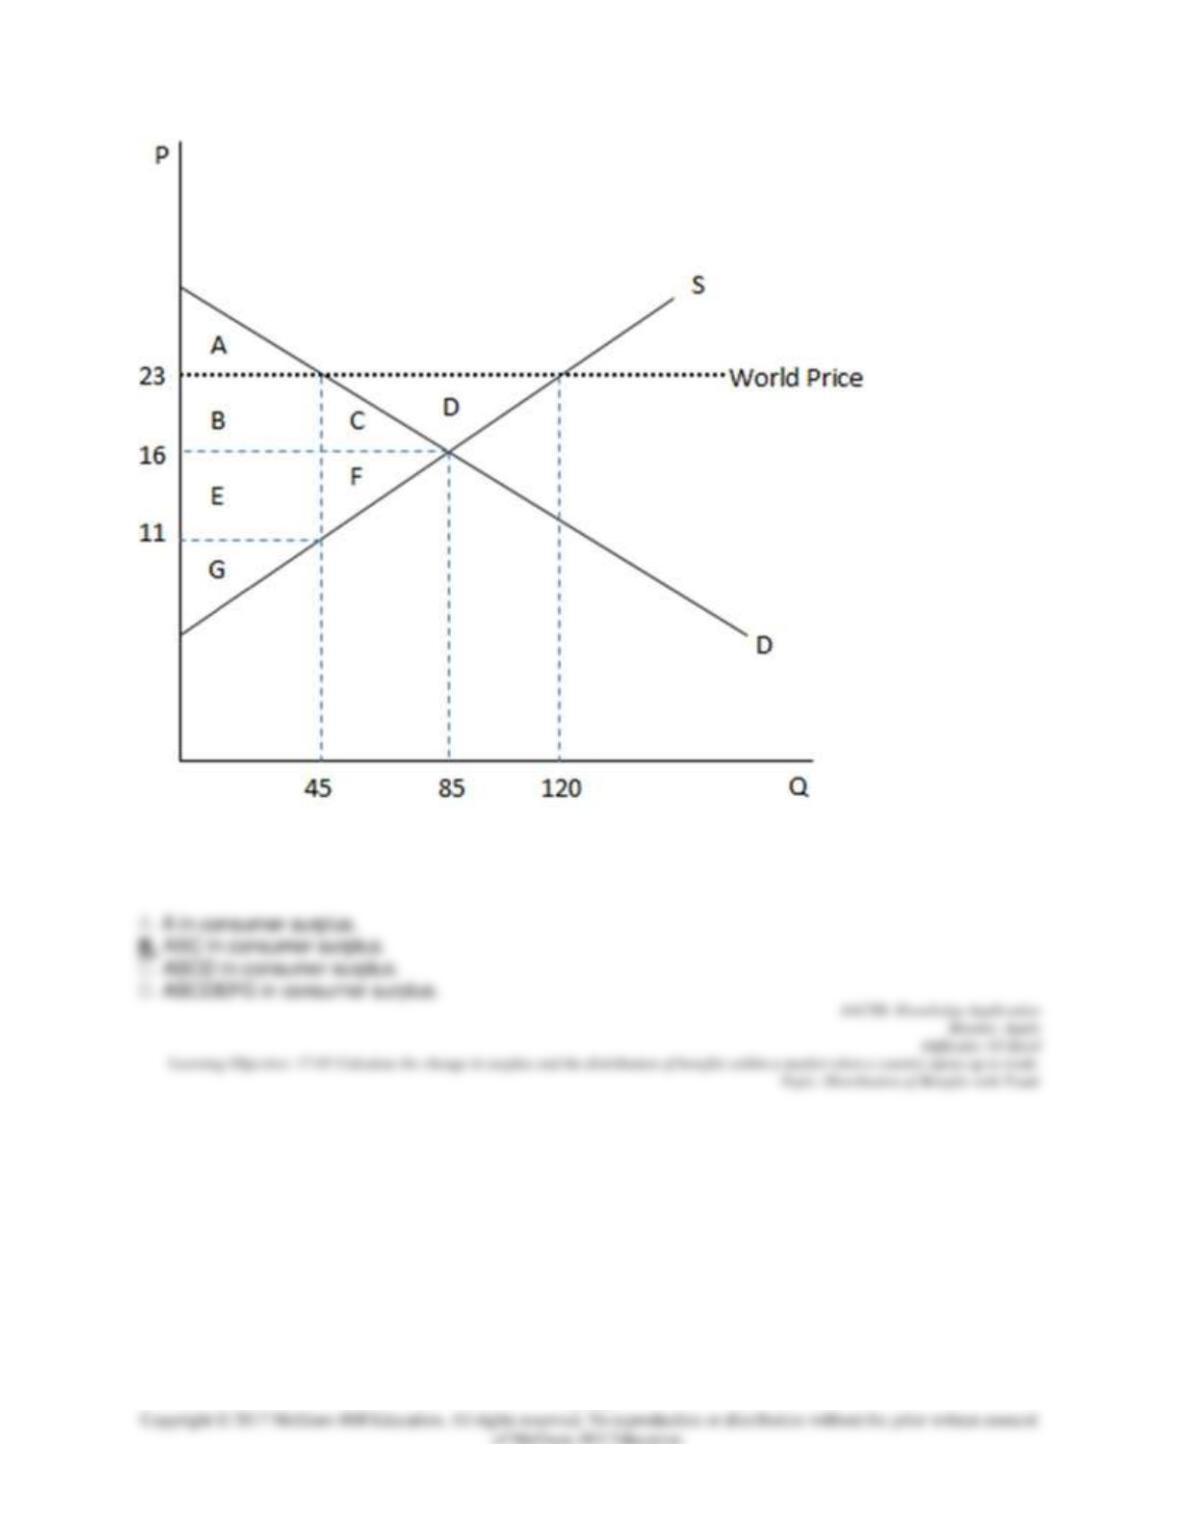
17–38
According to the graph shown, if this economy were an autarky, consumers would get area:
73. This graph demonstrates the domestic demand and supply for a good, as well as the world price for
that good.
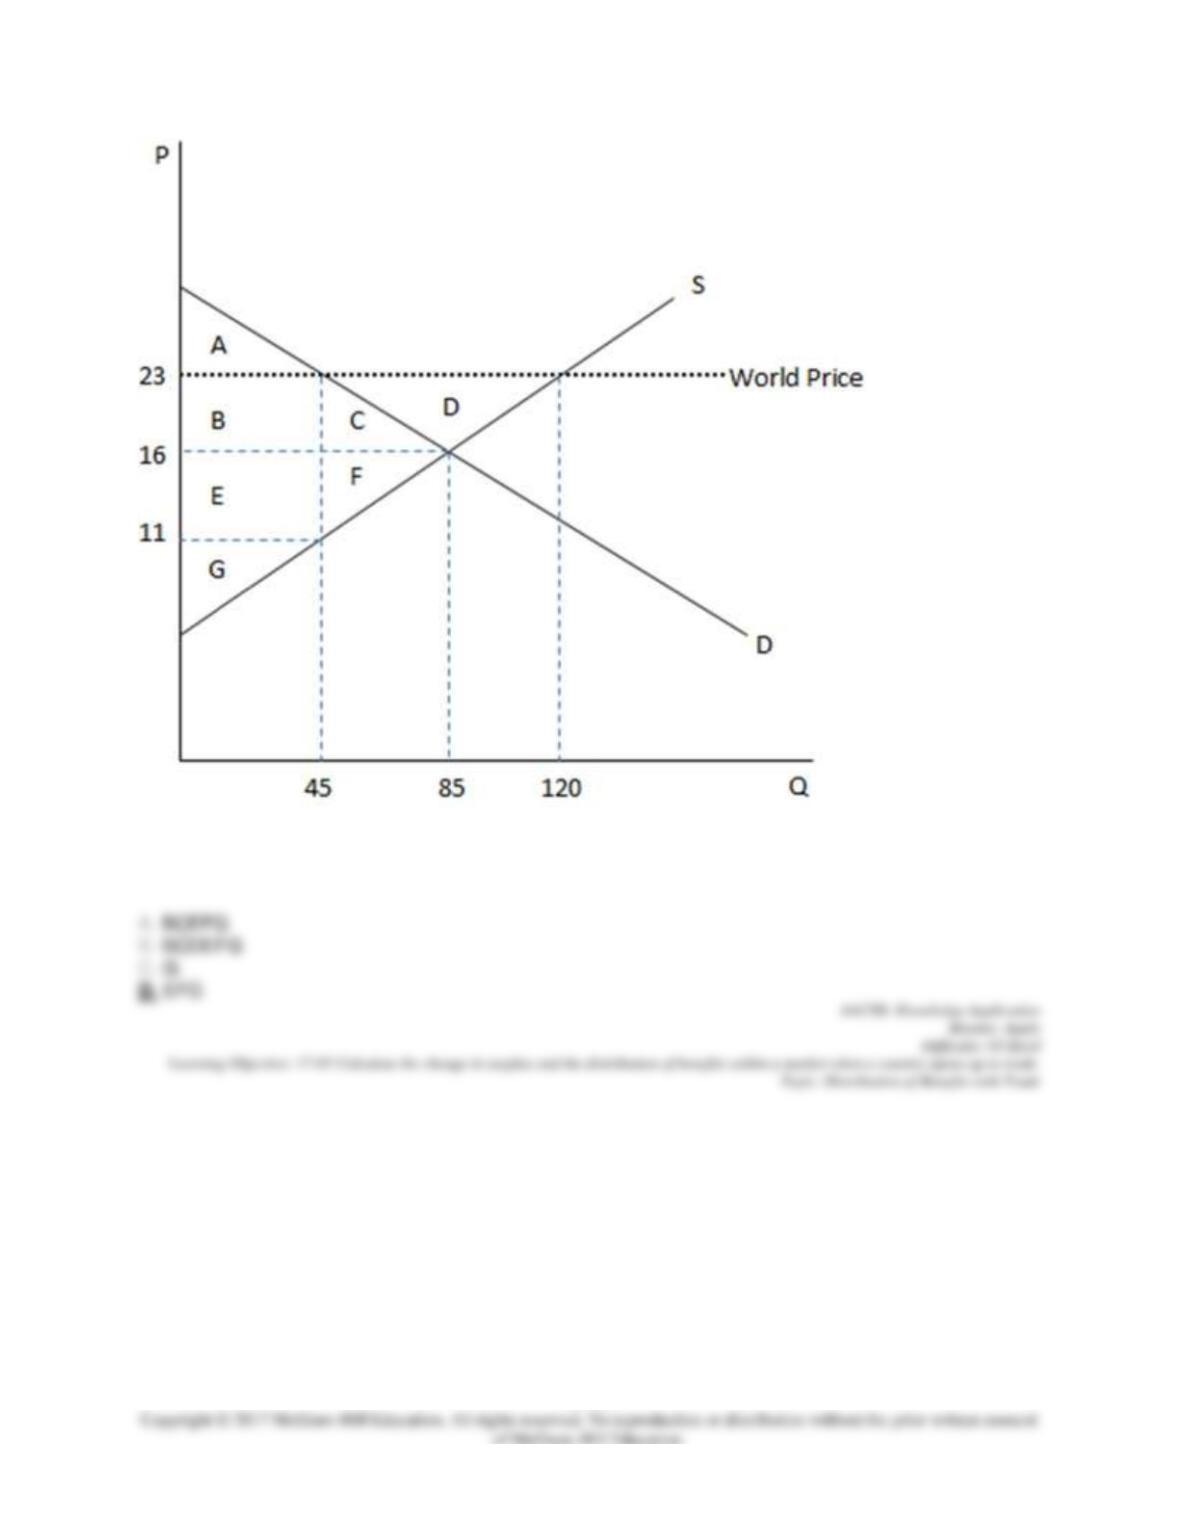
17–39
According to the graph shown, if this economy were an autarky, producers would enjoy area:
74. This graph demonstrates the domestic demand and supply for a good, as well as the world price for
that good.
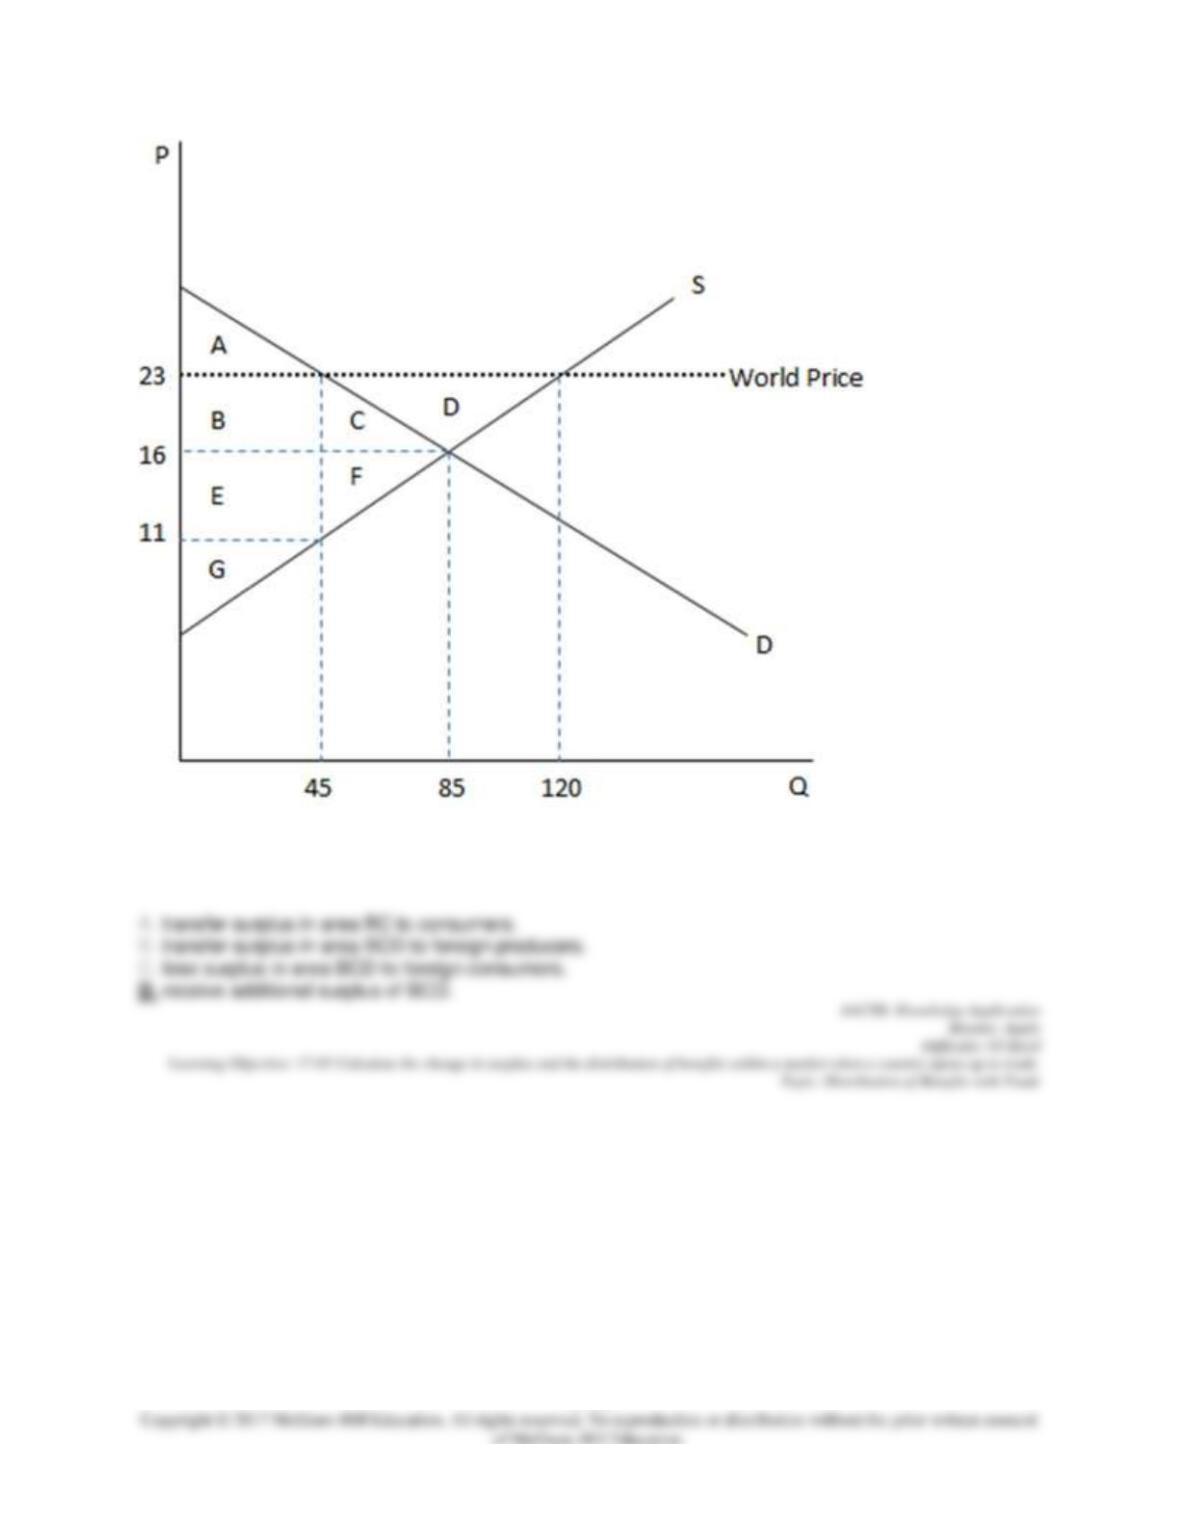
17–40
According to the graph shown, if this economy were to open to trade, domestic producers would:
75. This graph demonstrates the domestic demand and supply for a good, as well as the world price for
that good.