Chapter 16 – Public Finance: Expenditures and Taxes
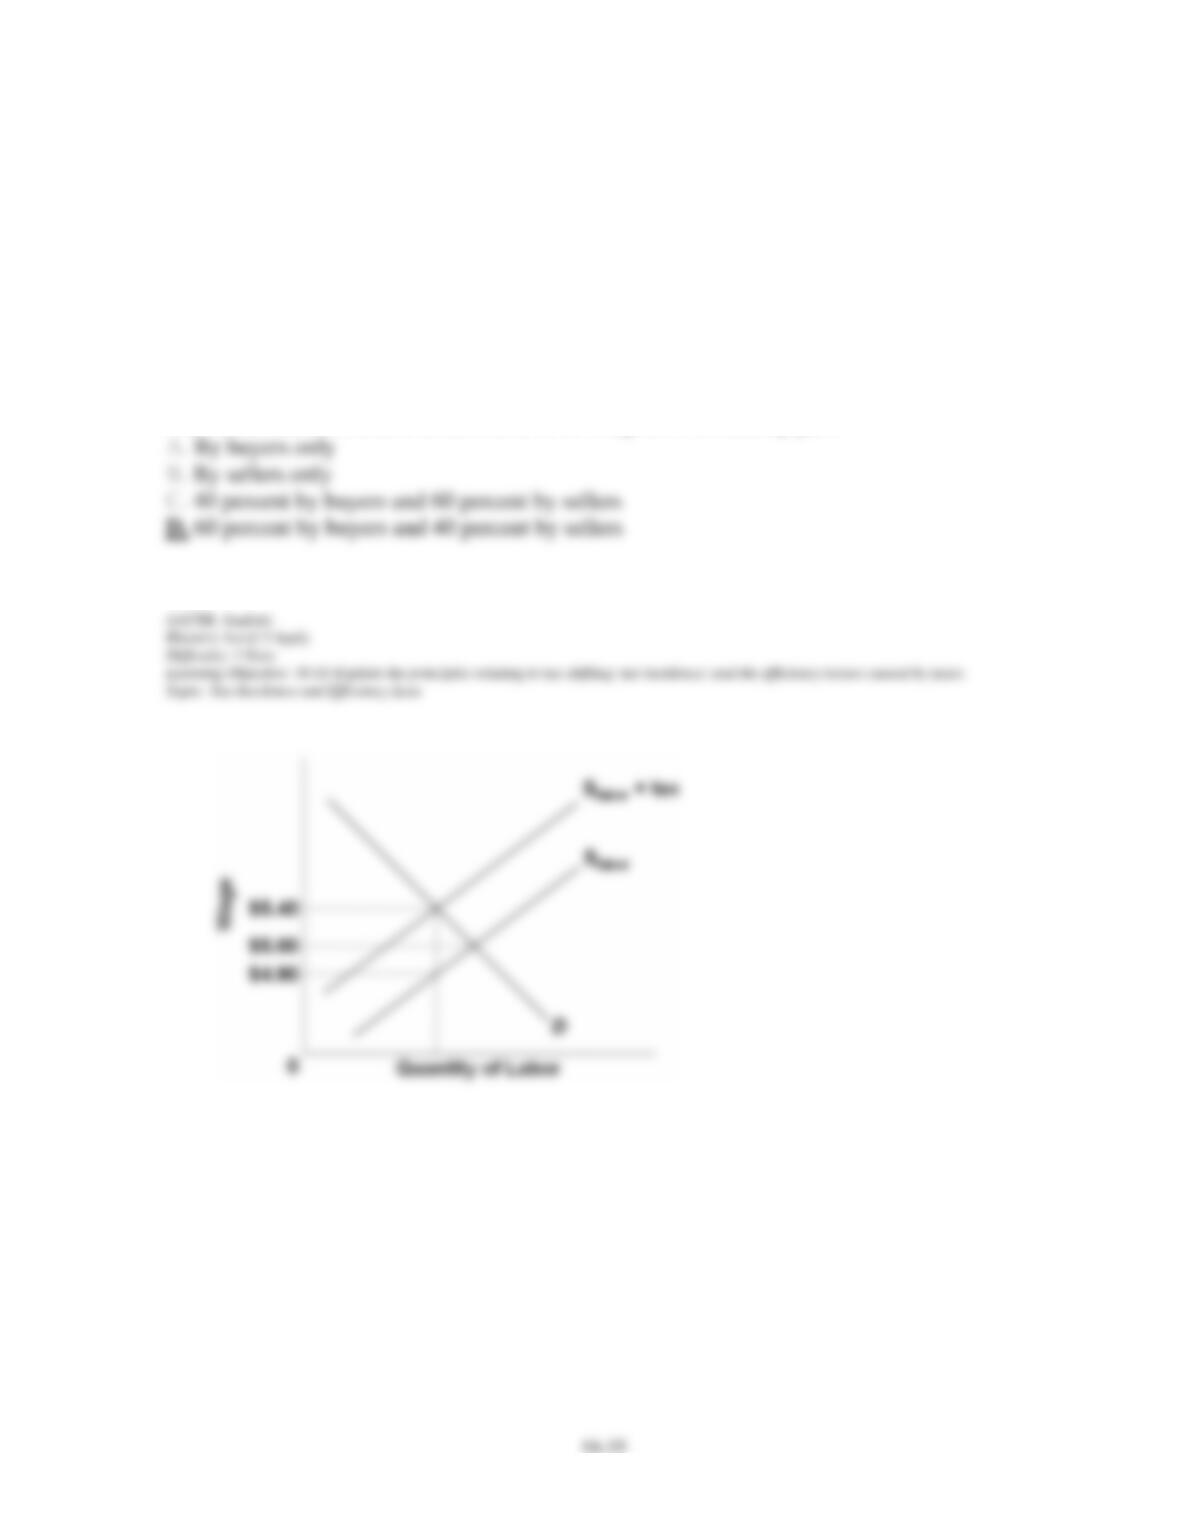
91. In the diagram above:
S0 = supply curve for bourbon (seller’s supply)
D = demand curve for bourbon
St= supply for bourbon plus excise tax on bourbon
(effective supply as seen by buyers)
tax = an excise tax on bourbon (of $20 per case)
The excise tax on bourbon as described in the diagram is ultimately paid:
Chapter 16 – Public Finance: Expenditures and Taxes
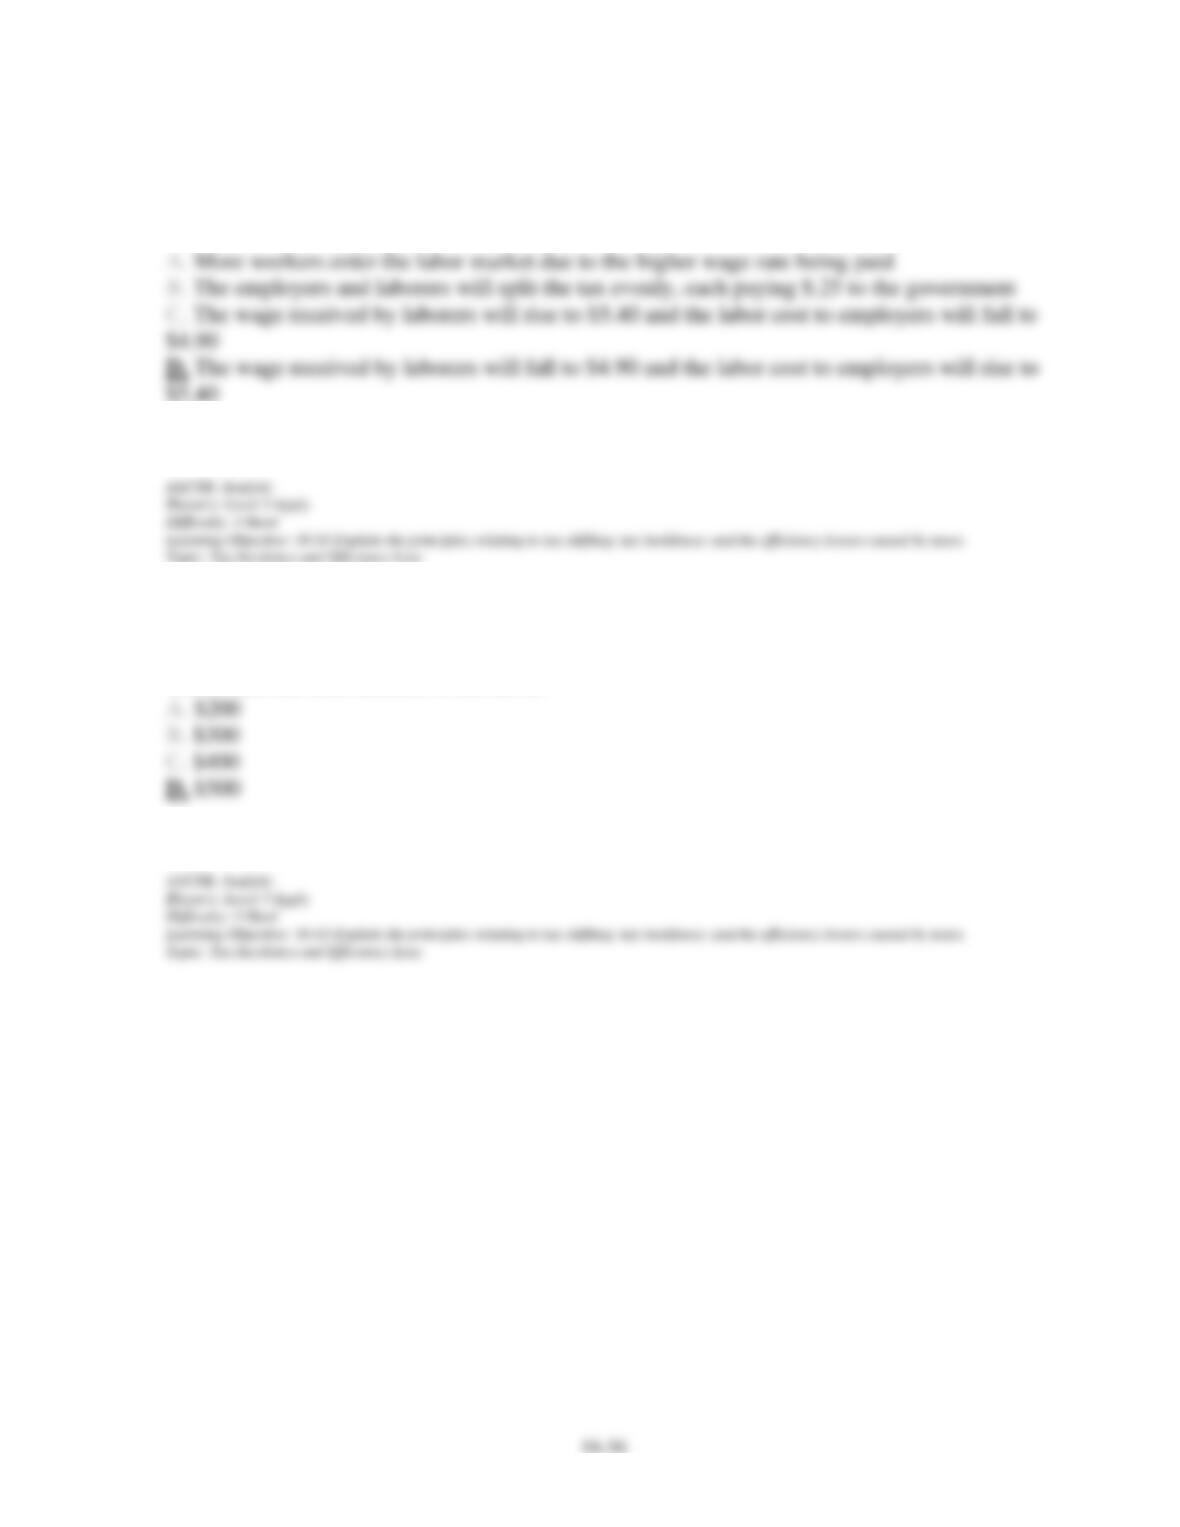
92. Refer to the above graph for the labor market. The government decides to impose a wage
tax as shown on the graph. The result is that:
93. Refer to the above graph for the labor market. The government decides to impose a wage
tax as shown on the graph. If the number of workers hired after the imposition of the tax is
1,000, then the total amount of the tax is:
Chapter 16 – Public Finance: Expenditures and Taxes
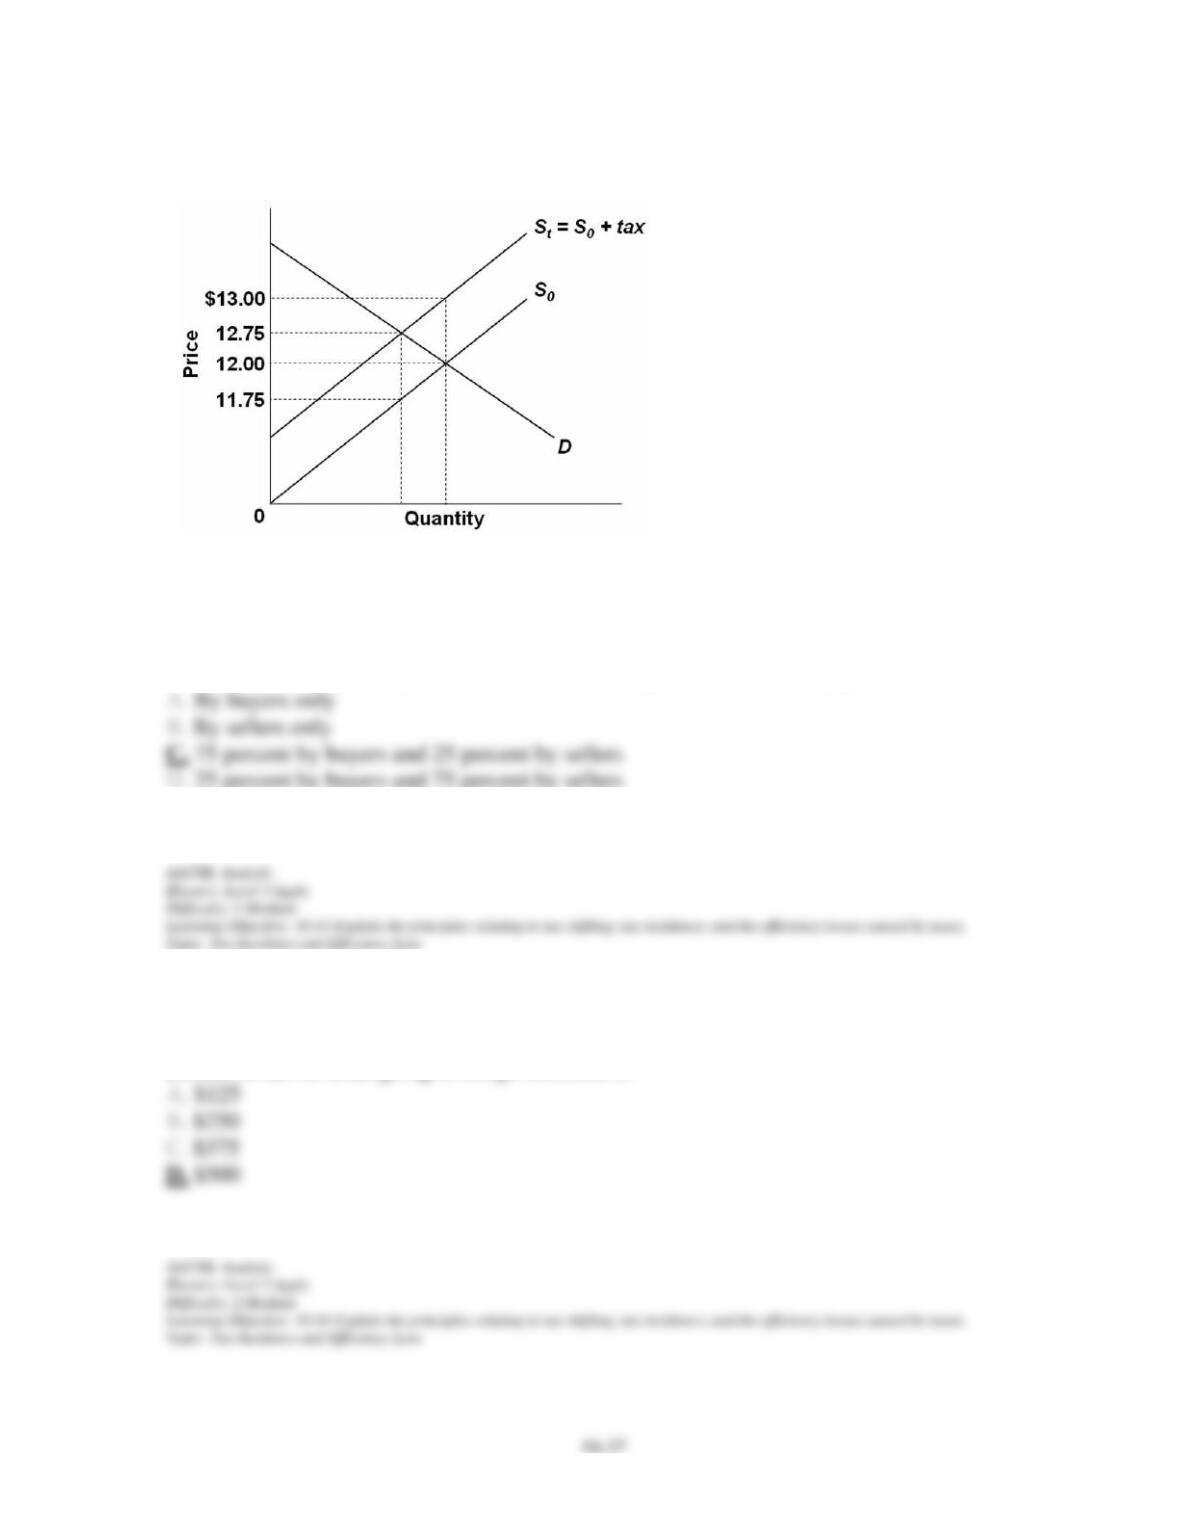
94. Refer to the above graph. It shows the supply curve for a product before tax (S0) and after
an excise tax is imposed (S1). The excise tax on the product is ultimately paid:
95. Refer to the above graph. It shows the supply curve for a product before tax (S0) and after
an excise tax is imposed (S1). If 500 units of the product are sold after the tax is imposed, the
Chapter 16 – Public Finance: Expenditures and Taxes
96. Refer to the above graph. It shows the supply curve for a product before tax (S0) and after
an excise tax is imposed (S1). If 500 units of the product are sold after the tax is imposed, the
amount of the tax borne by the consumer is:
Chapter 16 – Public Finance: Expenditures and Taxes
16–39
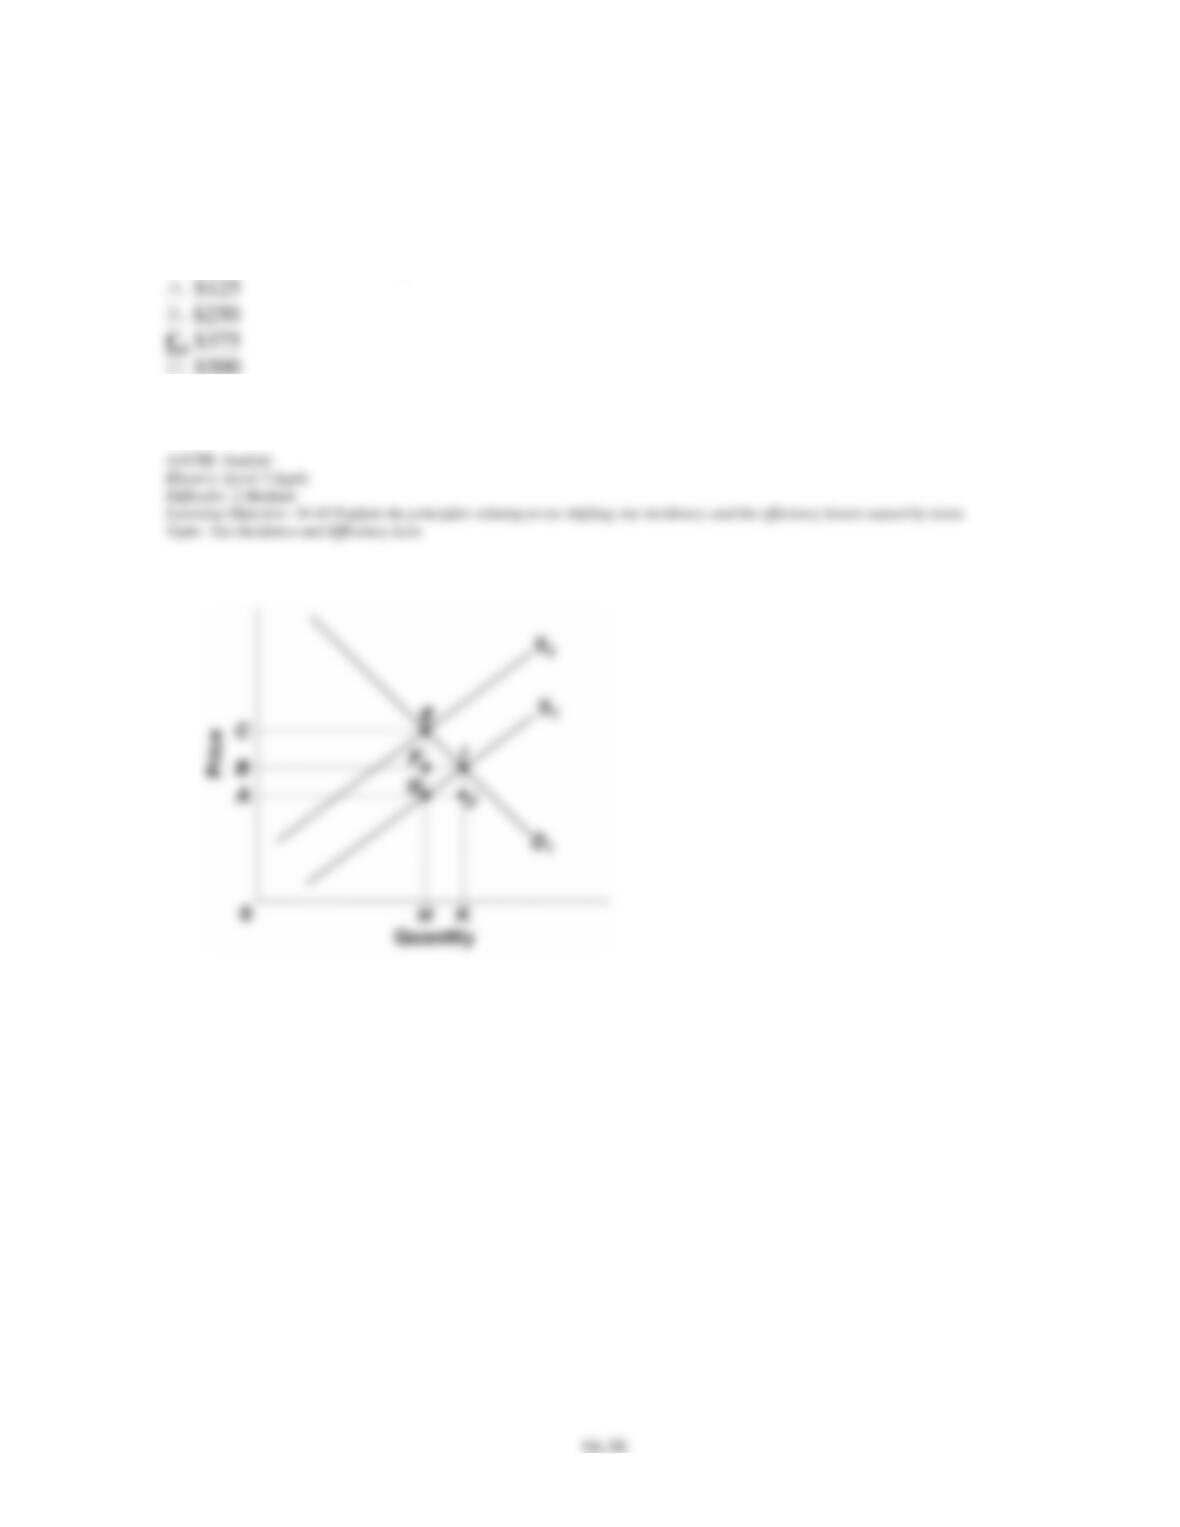
97. The graph above represents the market for a product where D1 and S1 show the initial
supply and demand curves, and supply shifts to S2 due to a sales tax. The government’s tax
revenue is represented by area:
98. The graph above represents the market for a product where D1 and S1 show the initial
supply and demand curves, and supply shifts to S2 due to a sales tax. The deadweight loss due
to the tax is represented by area:
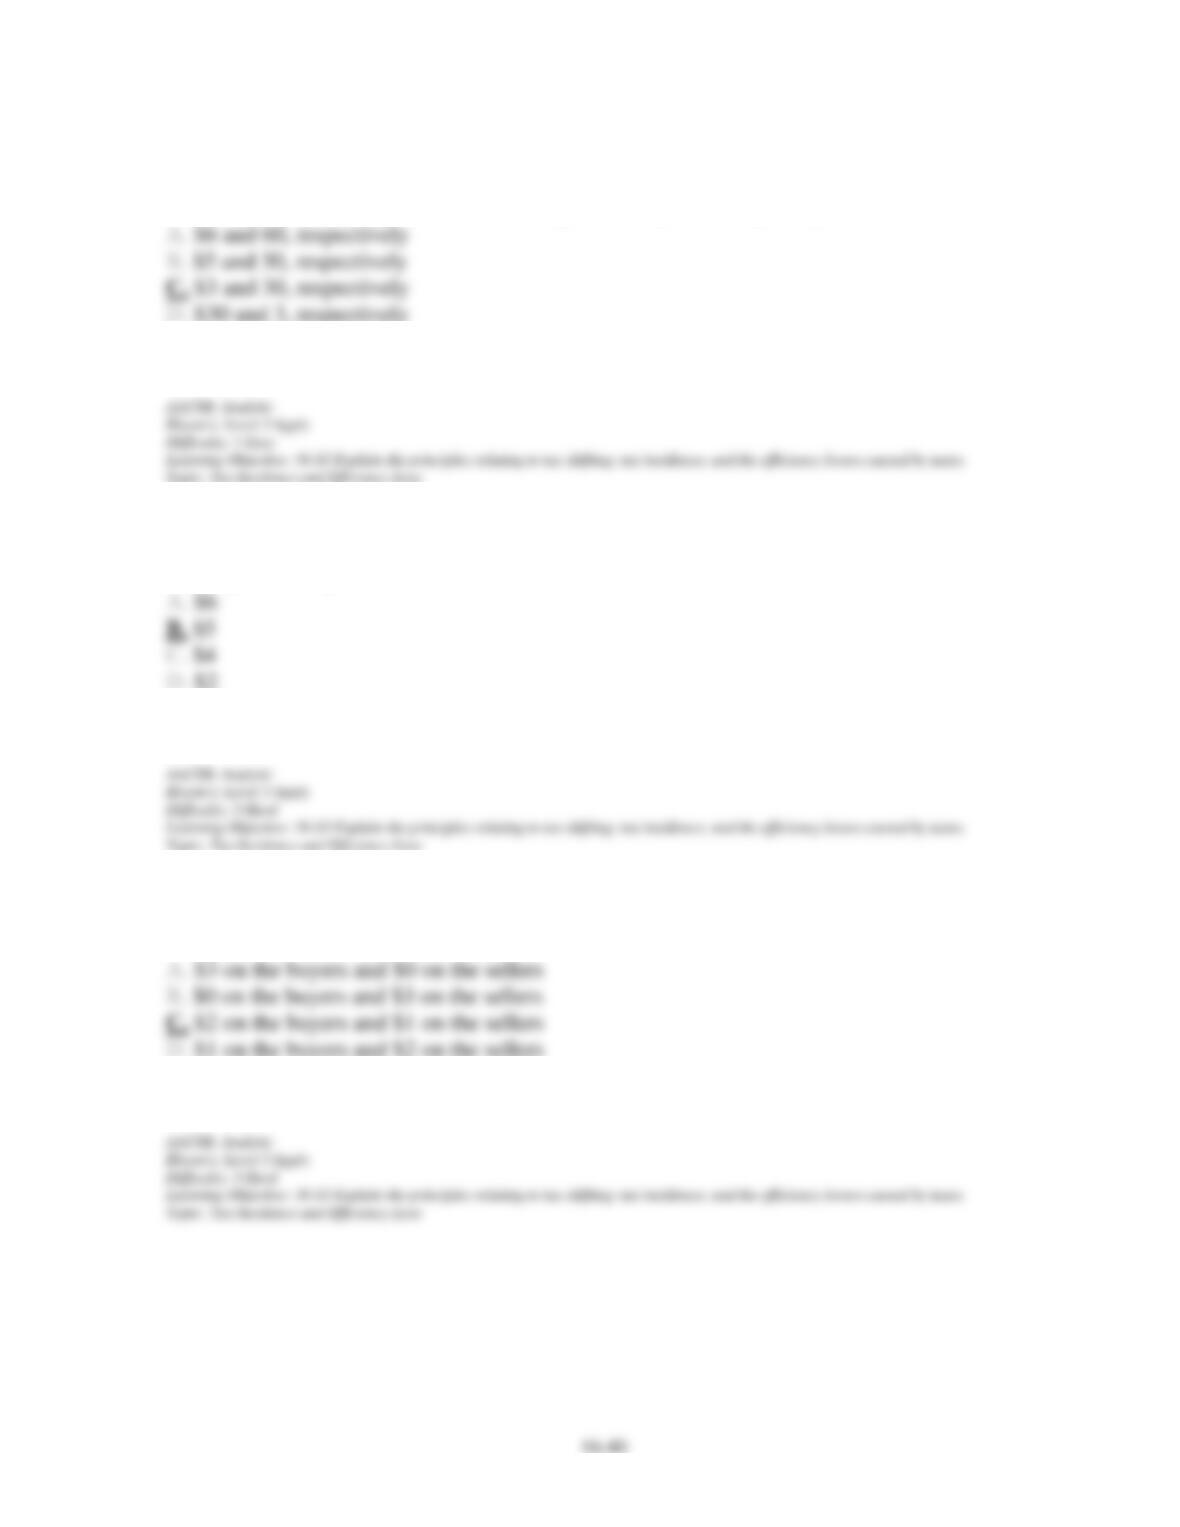
The following table give data for the market for a product.
Chapter 16 – Public Finance: Expenditures and Taxes
99. Refer to the table above. What is the equilibrium price and quantity in this market?
100. Refer to the table above. If an excise tax of $3 per unit is imposed on this product, the
new equilibrium price with tax will be:
101. Refer to the table above. If an excise tax of $3 per unit is imposed on this product, the
incidence of the tax will be:
Chapter 16 – Public Finance: Expenditures and Taxes
102. Refer to the table above. If an excise tax of $3 per unit is imposed on this product, the tax
revenue for the government will be:
103. The tax which would be most difficult to shift to others would be the:
104. The actual incidence of payroll taxes, in the consensus view, is:
Chapter 16 – Public Finance: Expenditures and Taxes
105. The Federal tax system is:
106. The Federal payroll (Social Security) tax:
107. If the taxes by state and local governments were combined with the Federal tax system,
the overall tax structure in the U.S. would best be characterized as:
Chapter 16 – Public Finance: Expenditures and Taxes
108. Which statement best describes the overall tax and transfer systems of the United
States?
109. Economists Chamberlain and Prante of the Tax Foundation note that if the U.S.
population in 2004 were grouped into quintiles by income:
Chapter 16 – Public Finance: Expenditures and Taxes
110. The U.S. tax and transfer study done by economists Chamberlain and Prante of the Tax
Foundation note that households in the top income quintile received about:
111. Which is necessarily true if the government were to replace a progressive income tax
system with a proportional one?
112. Transfer payments exhaust or absorb resources whereas government purchases do not.
Chapter 16 – Public Finance: Expenditures and Taxes
113. The largest category of Federal government expenditures is national defense.
114. Payroll taxes account for more than one-third of Federal tax revenues.
115. The largest source of tax revenue for state governments is the property tax.
116. Few states use state-run lotteries to increase their revenues and pay for expenditures.
Chapter 16 – Public Finance: Expenditures and Taxes
117. If an income tax is progressive, the average tax rate will increase as incomes increase.
118. The levying of licensing fees for automobiles is an example of taxation based on the
ability–to-pay principle.
119. The Social security tax is regressive because it applies only on income below a “cap”
income level.
120. The probable incidence of the tax on business property is on consumers.
Chapter 16 – Public Finance: Expenditures and Taxes
121. In general for an excise tax on a product, given supply, the more elastic is the demand for
the product, the larger will be the portion of the tax shouldered by the buyers.
122. When an excise tax or sales tax is imposed on a product, the sellers are always able to
shift the burden of the tax on to the buyers.
123. The overall tax structure of the United States is proportional or slightly regressive.
124. The state and local tax structure is largely progressive.
Chapter 16 – Public Finance: Expenditures and Taxes
125. In the U.S., the progressive income-tax system substantially redistributes income.
126. In the U.S., the taxes mostly come from the rich and government spend mostly for
programs benefiting the rich.