Chapter 16 – Public Finance: Expenditures and Taxes
99. Assume the supply curve for product X is perfectly elastic and that government imposes a
$2 per unit excise tax. We can conclude that the resulting:
100. If the demand for a product is perfectly inelastic and the supply curve is upsloping, a $1
excise tax per unit of output will:
Chapter 16 – Public Finance: Expenditures and Taxes
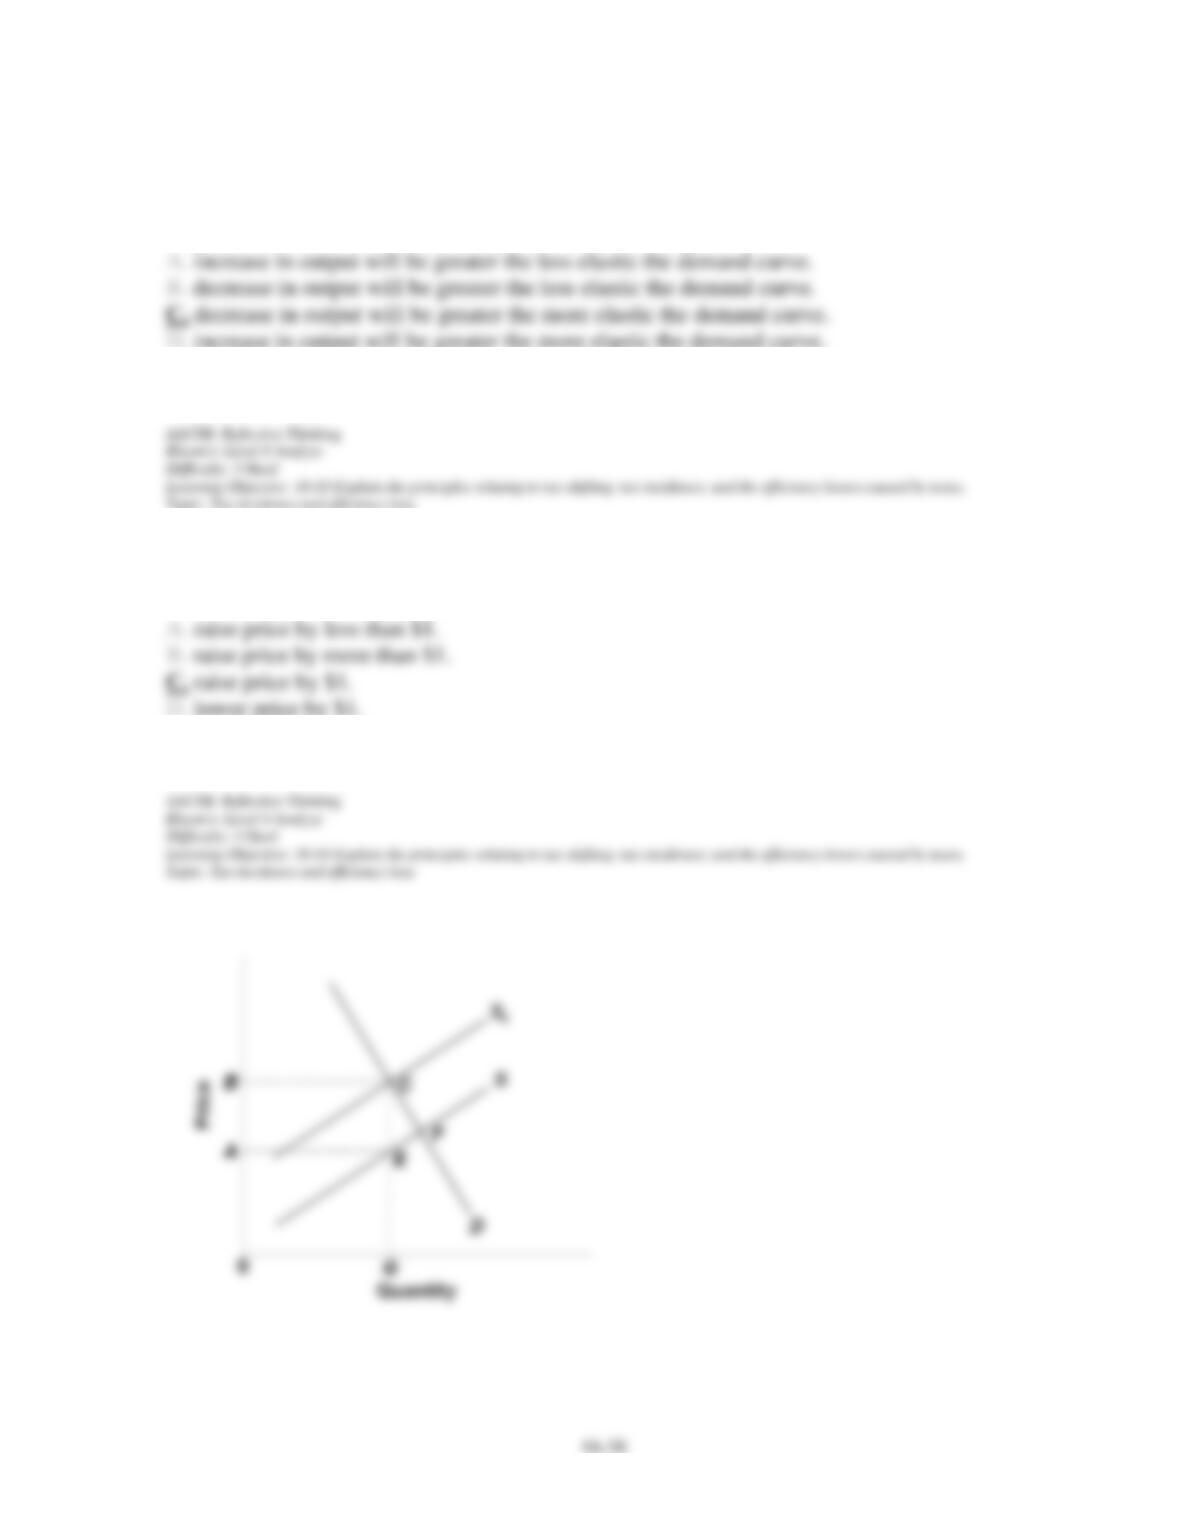
101. Refer to the above figure in which S is the before-tax supply curve and St is the supply
curve after an excise tax is imposed. The total tax collection from this excise tax will be area:
102. Refer to the above figure in which S is the before-tax supply curve and St is the supply
curve after an excise tax is imposed. The efficiency loss of this tax will be area:
103. Refer to the above figure in which S is the before-tax supply curve and St is the supply
curve after an excise tax is imposed. The burden of this tax is borne:
Chapter 16 – Public Finance: Expenditures and Taxes
104. The more inelastic is demand and supply the:
105. If the demand for a product is perfectly inelastic, the incidence of an excise tax will be:
106. The efficiency loss of a tax is the idea that:
Chapter 16 – Public Finance: Expenditures and Taxes
107. The greater the elasticity of supply of and demand for a good the:
108. The efficiency loss of a tax is:
Chapter 16 – Public Finance: Expenditures and Taxes
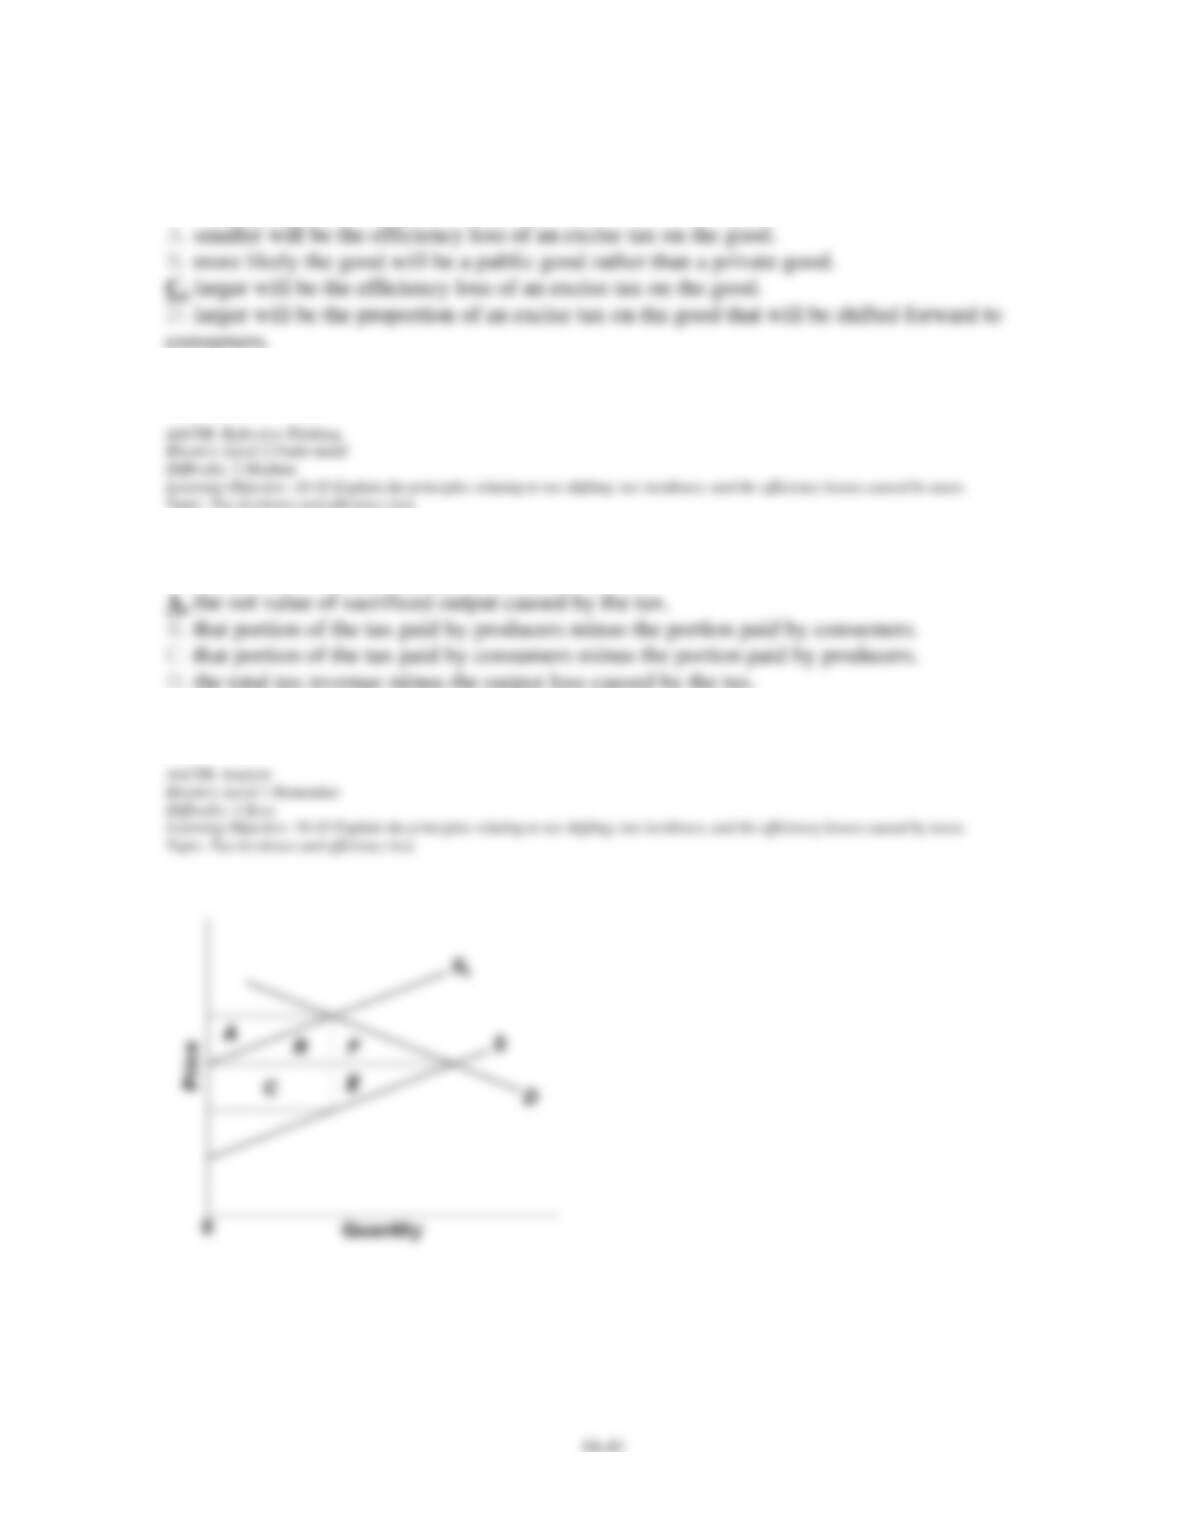
109. Refer to the above diagram in which S is the before-tax supply curve and St is the supply
curve after an excise tax is imposed. The total tax payment to government is shown by
area(s):
110. Refer to the above diagram in which S is the before-tax supply curve and St is the supply
curve after an excise tax is imposed. The total amount of the tax paid by consumers is shown
by area(s):
Chapter 16 – Public Finance: Expenditures and Taxes
16–43
111. Refer to the above diagram in which S is the before-tax supply curve and St is the supply
curve after an excise tax is imposed. The total amount of the tax paid by producers is shown
by area(s):
112. Refer to the above diagram in which S is the before-tax supply curve and St is the supply
curve after an excise tax is imposed. The efficiency loss of the tax is shown by area(s):
(Advanced analysis) Answer the question on the basis of the following information: The
equations for the demand and supply curves for a particular product are P = 10 – .4Q and P =
2 + .4Q, where P is price and Q is quantity expressed in units of 100. After an excise tax is
imposed on the product the supply equation is P = 3 + .4Q.
Chapter 16 – Public Finance: Expenditures and Taxes
113. Refer to the above information. The excise tax on each unit of the product:
114. Refer to the above information. The equilibrium quantity before the excise tax is
imposed is:
115. Refer to the above information. The equilibrium quantity after the excise tax is imposed
is:
Chapter 16 – Public Finance: Expenditures and Taxes
116. Refer to the above information. Government’s revenue from this tax is:
117. Refer to the above information. The efficiency loss of this tax is:
118. Sales and excise taxes are levied on retailers, but retailers add these taxes to the prices of
their products. This illustrates the:
Chapter 16 – Public Finance: Expenditures and Taxes
119. The property tax may be regressive even though wealthy people own much more taxable
property than do poor people. This possibility arises because:
120. Which of the following taxes is most likely to be shifted?
121. Which of the following taxes is least likely to be shifted?
Chapter 16 – Public Finance: Expenditures and Taxes
122. (Consider This) Which of the following claims is not made by defenders of lotteries?
123. (Consider This) Payout rates for state lotteries:
124. (Consider This) A value-added tax (VAT):
Chapter 16 – Public Finance: Expenditures and Taxes
125. (Consider This) Proponents of a value-added tax (VAT) claim that a VAT:
126. (Consider This) Which of the following claims is not made by opponents of a value-
added tax (VAT)?
127. (Last Word) In 2004, approximately what percent of household income was transferred
from the top two quintiles to the lowest three quintiles?
Chapter 16 – Public Finance: Expenditures and Taxes
128. (Last Word) For each dollar paid in taxes, approximately how much do households in the
top quintile receive back in the form of government expenditures?
129. (Last Word) Which of the following statements about taxes and government spending is
correct?
Chapter 16 – Public Finance: Expenditures and Taxes
130. “Tax Freedom Day” in the United typically occurs in mid-July.
131. Government assumes some responsibility for providing a minimum standard of living for
all citizens to compensate for the increase in income inequality caused by government tax
revenues and expenditures.
132. The largest source of local government’s revenue is the sales tax.
133. The basic source of state government’s revenue is the property tax.
Chapter 16 – Public Finance: Expenditures and Taxes
134. The major expenditure of local governments is for education.
135. A tax is progressive if the average tax rate rises as income increases.
136. If you pay a $2000 tax on $10,000 of taxable income and a $4000 tax on a taxable
income of $16,000, the tax is progressive.
137. The marginal tax rate is the tax rate that applies to additional income.
Chapter 16 – Public Finance: Expenditures and Taxes
138. About two-thirds of all Federal spending is for national defense.
139. A progressive tax takes relatively more from the rich than it does from the poor.
140. The benefits-received principle of taxation is used to support corporate and personal
income taxes.
141. Sales taxes are proportional in relation to income because the same tax rate applies
regardless of the size of a purchase.
Chapter 16 – Public Finance: Expenditures and Taxes
142. Sales taxes on consumer goods are regressive because poor people consume a larger
proportion of their incomes than do rich people.
143. A highly progressive tax takes relatively more from the rich than it does from the poor.
144. Given supply, the more inelastic the demand for a product, the larger the portion of an
excise tax that is shifted to consumers.
145. Given demand, the more inelastic the supply of a product, the larger the portion of an
excise tax that is borne by producers.
Chapter 16 – Public Finance: Expenditures and Taxes
146. The efficiency loss of a tax is the tax revenue collected by government minus the value
of the public goods financed through the tax.
147. The greater the elasticity of demand and supply, the greater is the efficiency loss of a
tax.
148. Economists agree that corporations always shift the corporate income tax to consumers
by raising product prices.
149. Although state and local taxes are highly progressive, Federal taxation is predominantly
regressive.