Chapter 16 – Public Finance: Expenditures and Taxes
58. A person whose income has increased from $10,000 to $20,000 finds that her Federal
marginal tax rate has increased from 18 percent to 22 percent. This is an example of a:
59. Which of the following taxes is most likely to be regressive?
Chapter 16 – Public Finance: Expenditures and Taxes
16–22
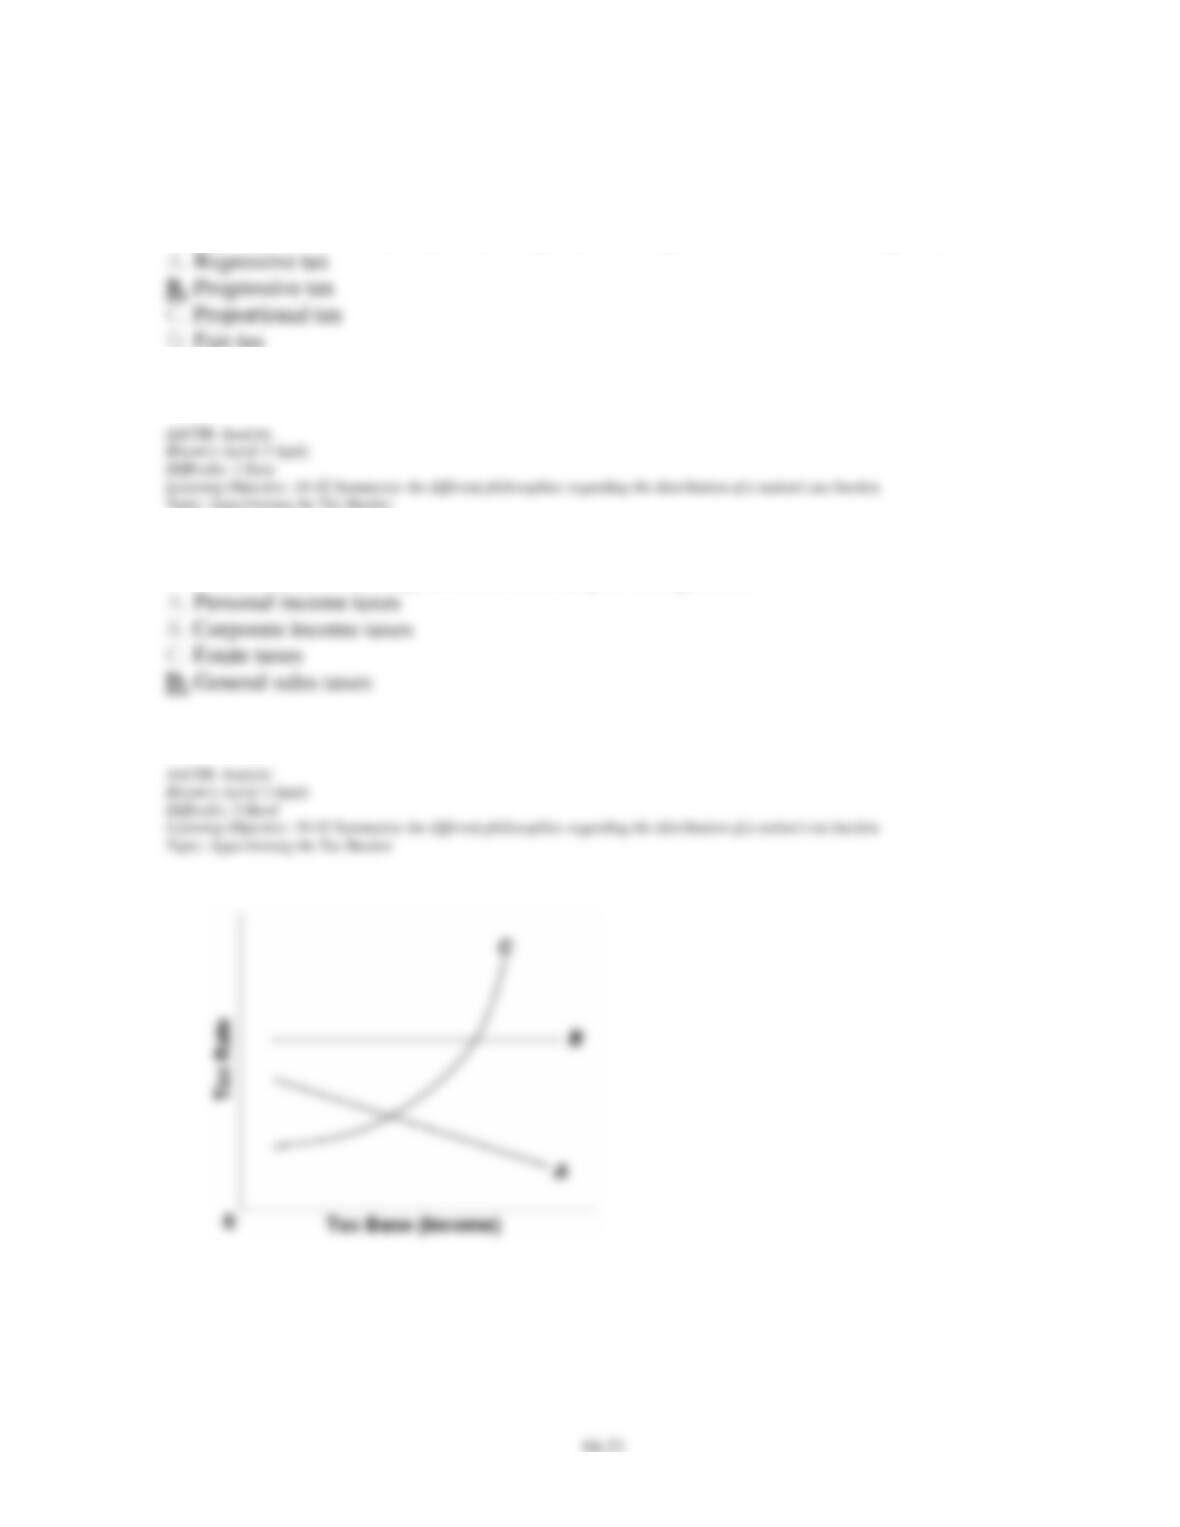
60. Refer to the above diagram. The relationship between the average tax rate and the tax base
in a proportional tax would be represented by:
61. Refer to the above diagram. A 3-percent general sales tax would have a structure that is
illustrated by:
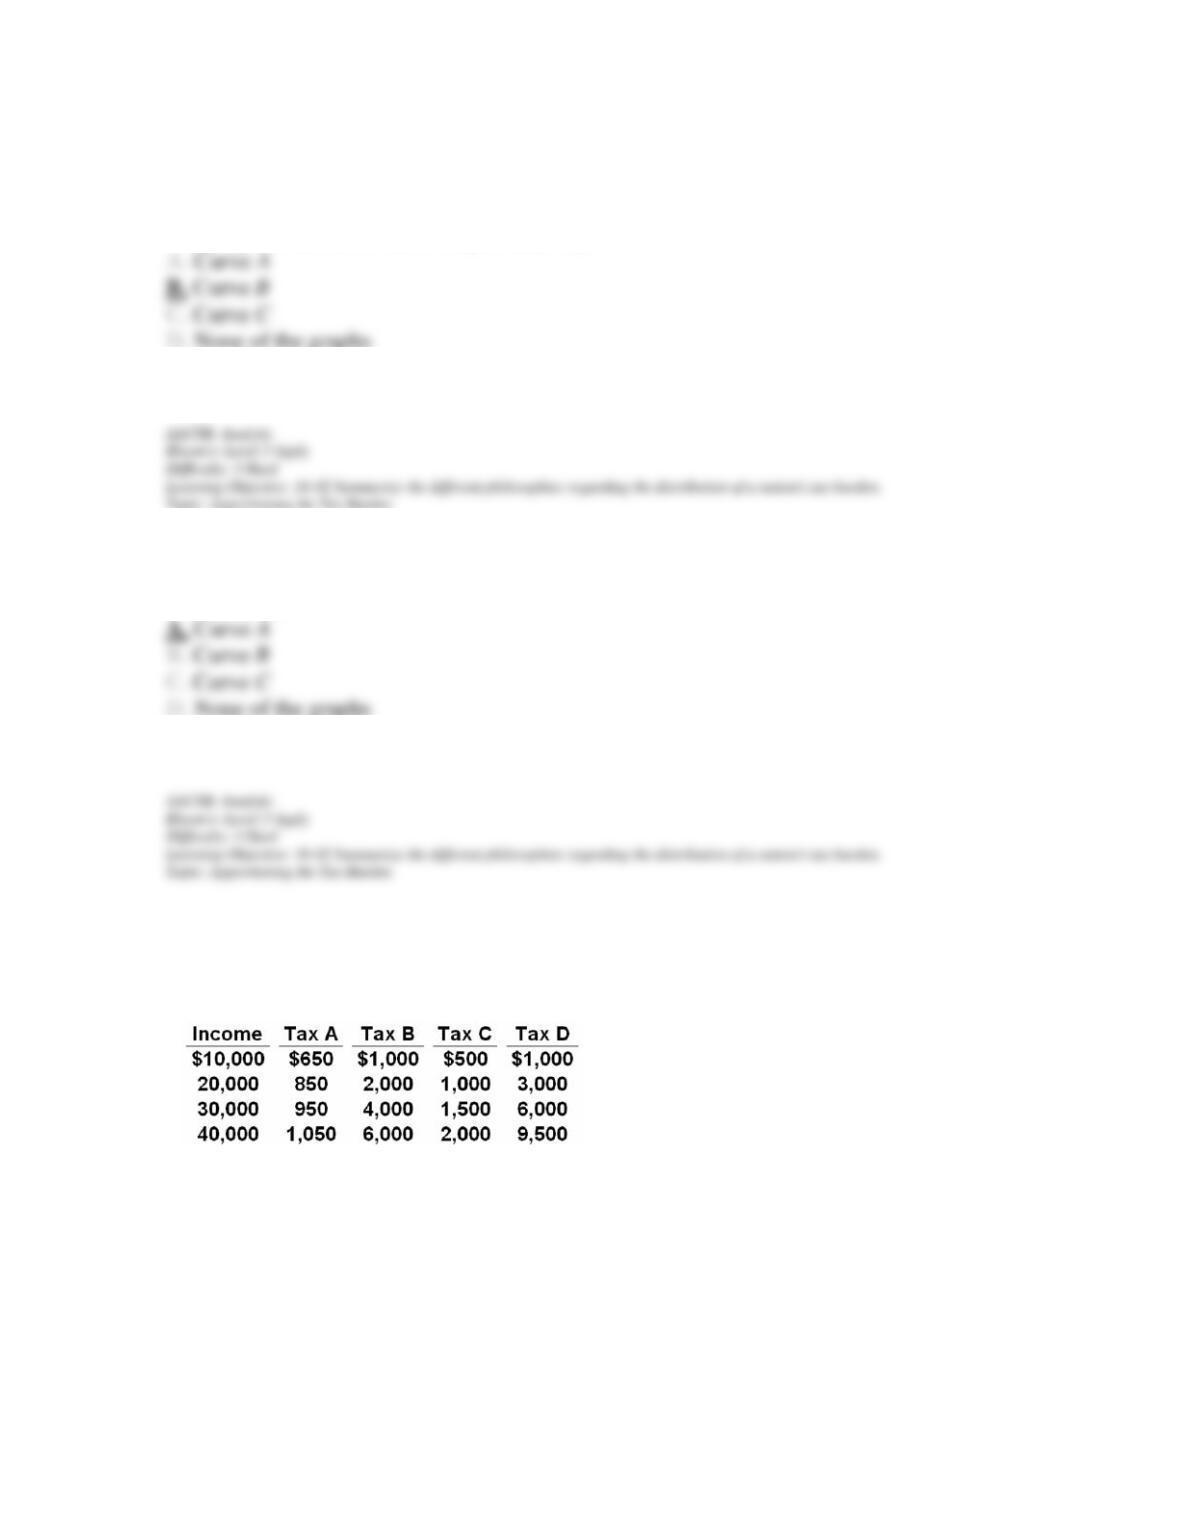
Answer the question on the basis of the following four tax schedules for the given base of
taxable income.
Chapter 16 – Public Finance: Expenditures and Taxes
62. Which of the above tax schedules is a progressive tax schedule throughout?
63. Which of the above tax schedules is a proportional tax schedule throughout?
64. Which of the above tax schedules is a regressive tax schedule throughout?
Chapter 16 – Public Finance: Expenditures and Taxes
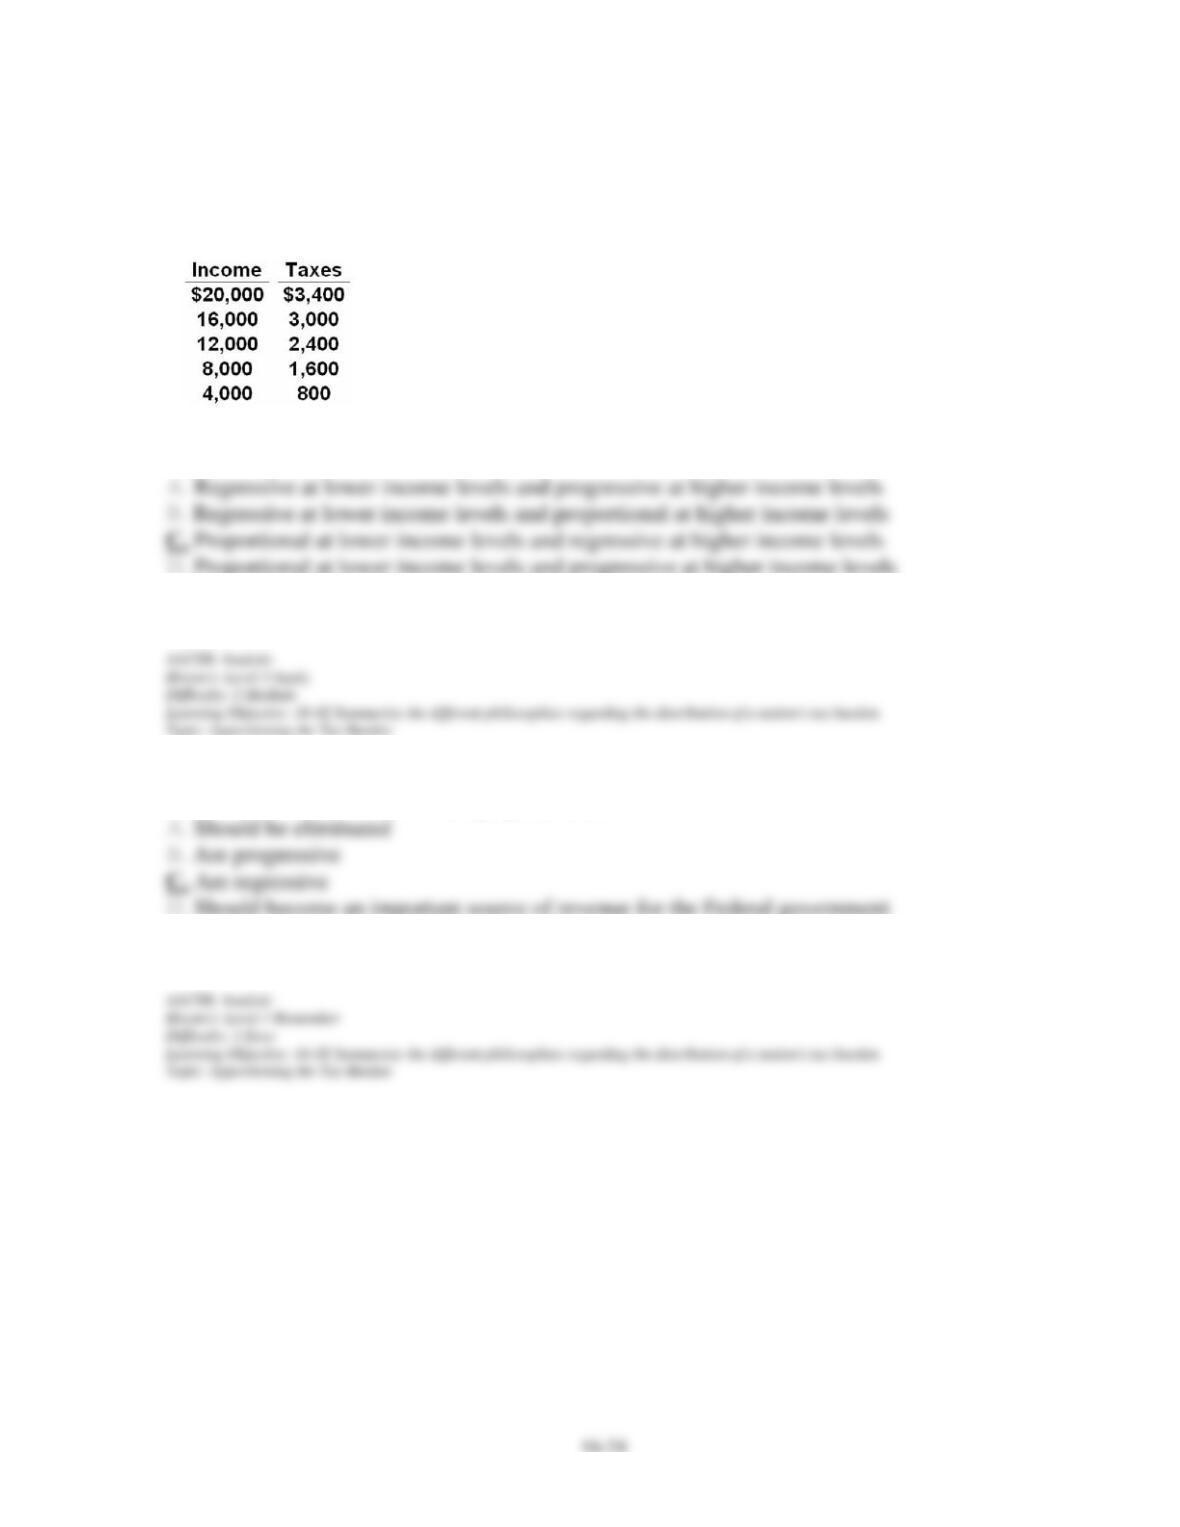
65. Consider the following data which describe the relationship between income and a tax:
The tax may be best described as:
66. Most economists believe that property taxes:
Chapter 16 – Public Finance: Expenditures and Taxes
67. The Federal personal income tax:
68. The Social Security tax is regressive because:
69. The incidence of taxation refers to:
Chapter 16 – Public Finance: Expenditures and Taxes
70. If the tax on gasoline is increased, gas stations are most likely to pass most of this increase
to the consumer if the demand is:
71. Other things being equal, the burden of a sales tax on a product will be borne entirely by
the producer if:
72. The burden of a specific sales tax falls entirely on the consumer when the:
Chapter 16 – Public Finance: Expenditures and Taxes
73. The supply curve for a product has infinite elasticity. An excise tax is levied on the
product. The likely effect will be to:
74. Suppose that a $0.75-tax is placed on gasoline. Under what circumstances will gasoline
sellers end up shouldering the full burden of the tax?
75. In general, the buyers will tend to pay a bigger share of a tax on a good when:
Chapter 16 – Public Finance: Expenditures and Taxes
76. The supply of meat is more elastic in the long run than in the short run. Ceteris paribus, as
time goes by, the burden of a tax on cattle will be increasingly passed on to the:
77. Which generalization is incorrect?
Chapter 16 – Public Finance: Expenditures and Taxes
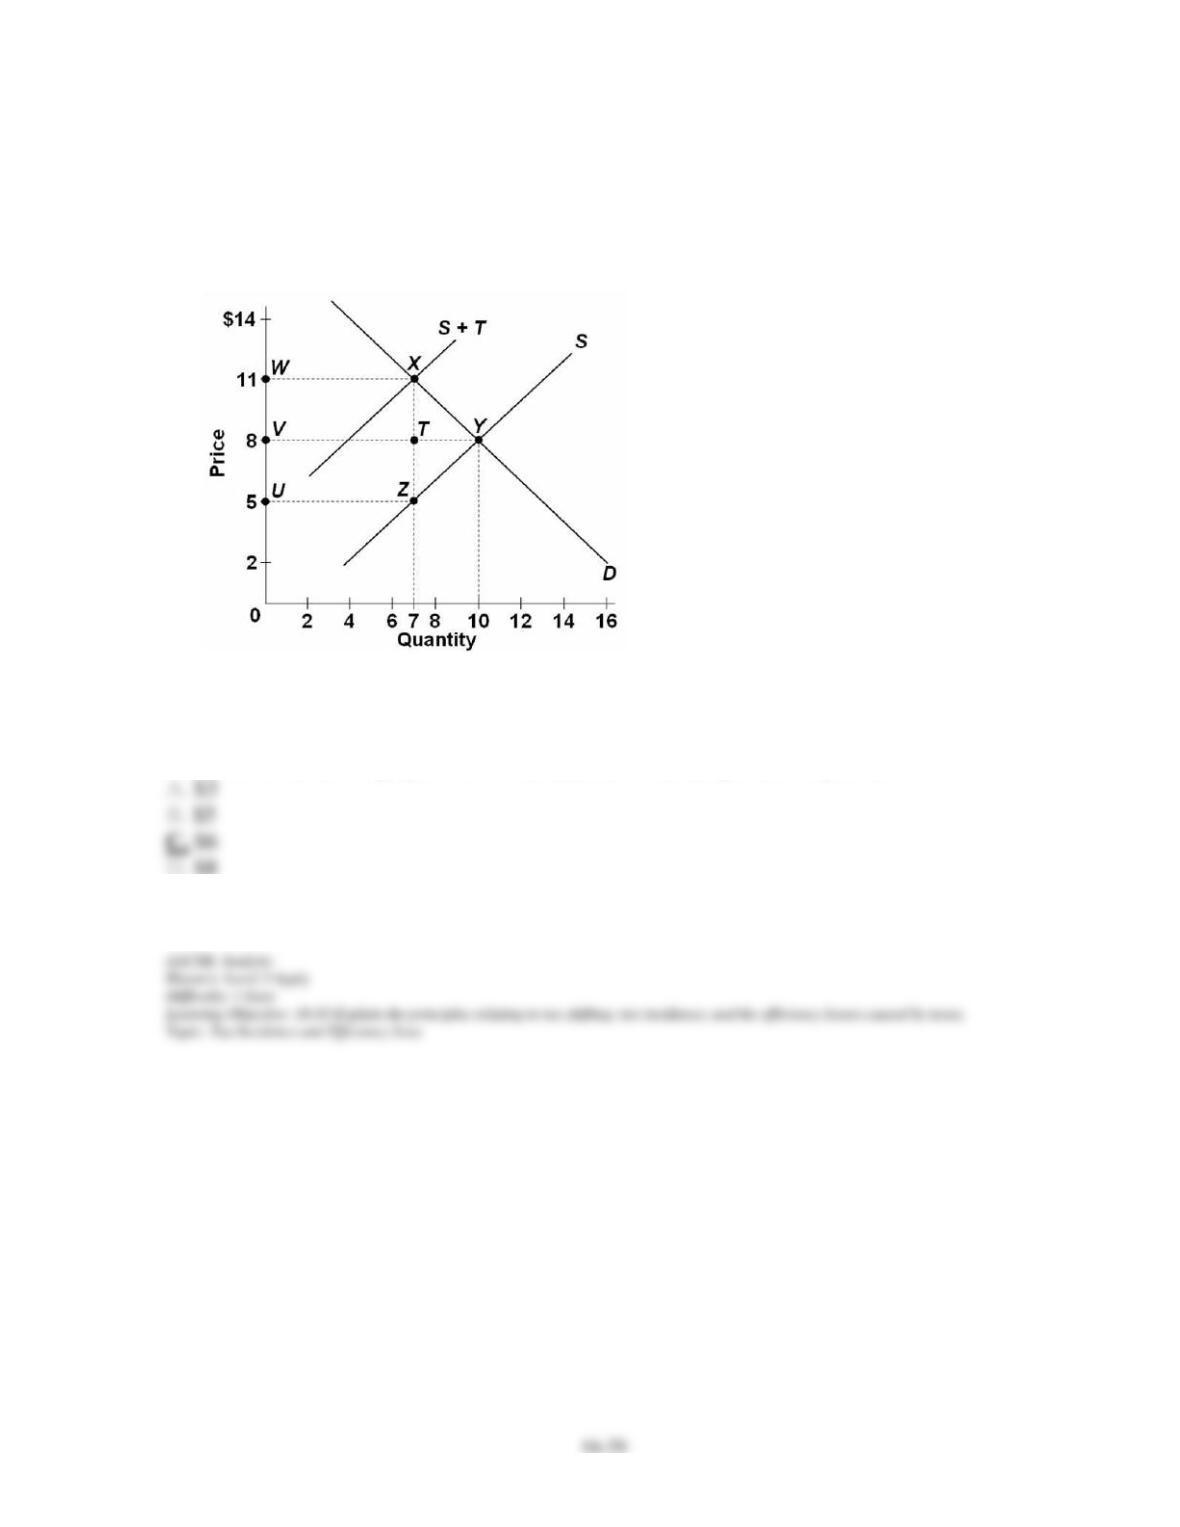
The graphs below illustrate the market for a product on which an excise tax has been imposed
by government.
78. Refer to the above graph. What is the amount of the tax per unit of product?
Chapter 16 – Public Finance: Expenditures and Taxes
79. Refer to the above graph. What was the price of the product before the tax was imposed,
and what is the price with the tax?
80. Refer to the above graph. How much of the excise tax per unit is shouldered by the
buyers?
81. Refer to the above graph. The excise tax on this product as shown in the graph is
ultimately paid:
Chapter 16 – Public Finance: Expenditures and Taxes
82. Refer to the above graph. What is the area that represents the portion of the excise tax that
is the burden to consumers?
83. Refer to the above graph. What is the area that represents the total amount of tax revenue
going to the government?
84. Refer to the above graph. How much is the total amount of tax revenue going to the
government?
Chapter 16 – Public Finance: Expenditures and Taxes
85. Refer to the above graph. What is the area that represents the efficiency loss due to the
tax?
86. Refer to the above graph. How much is the efficiency (or deadweight) loss due to the
excise tax?
Chapter 16 – Public Finance: Expenditures and Taxes
16–33
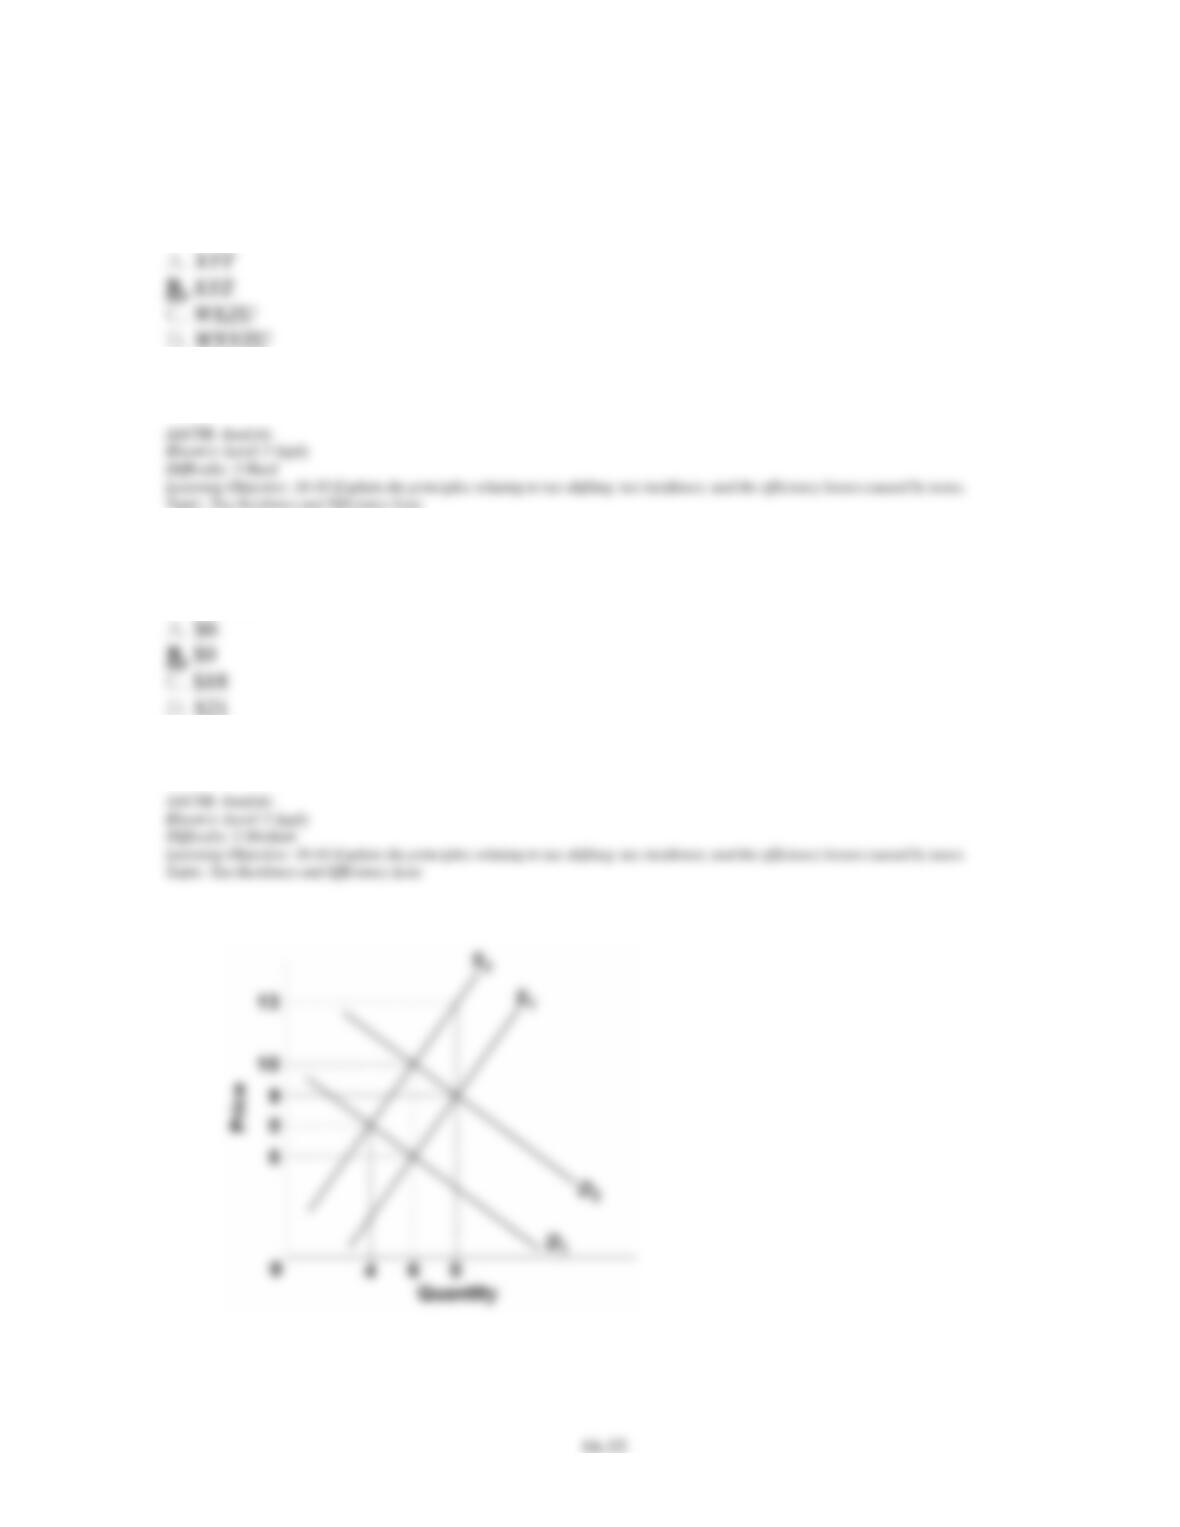
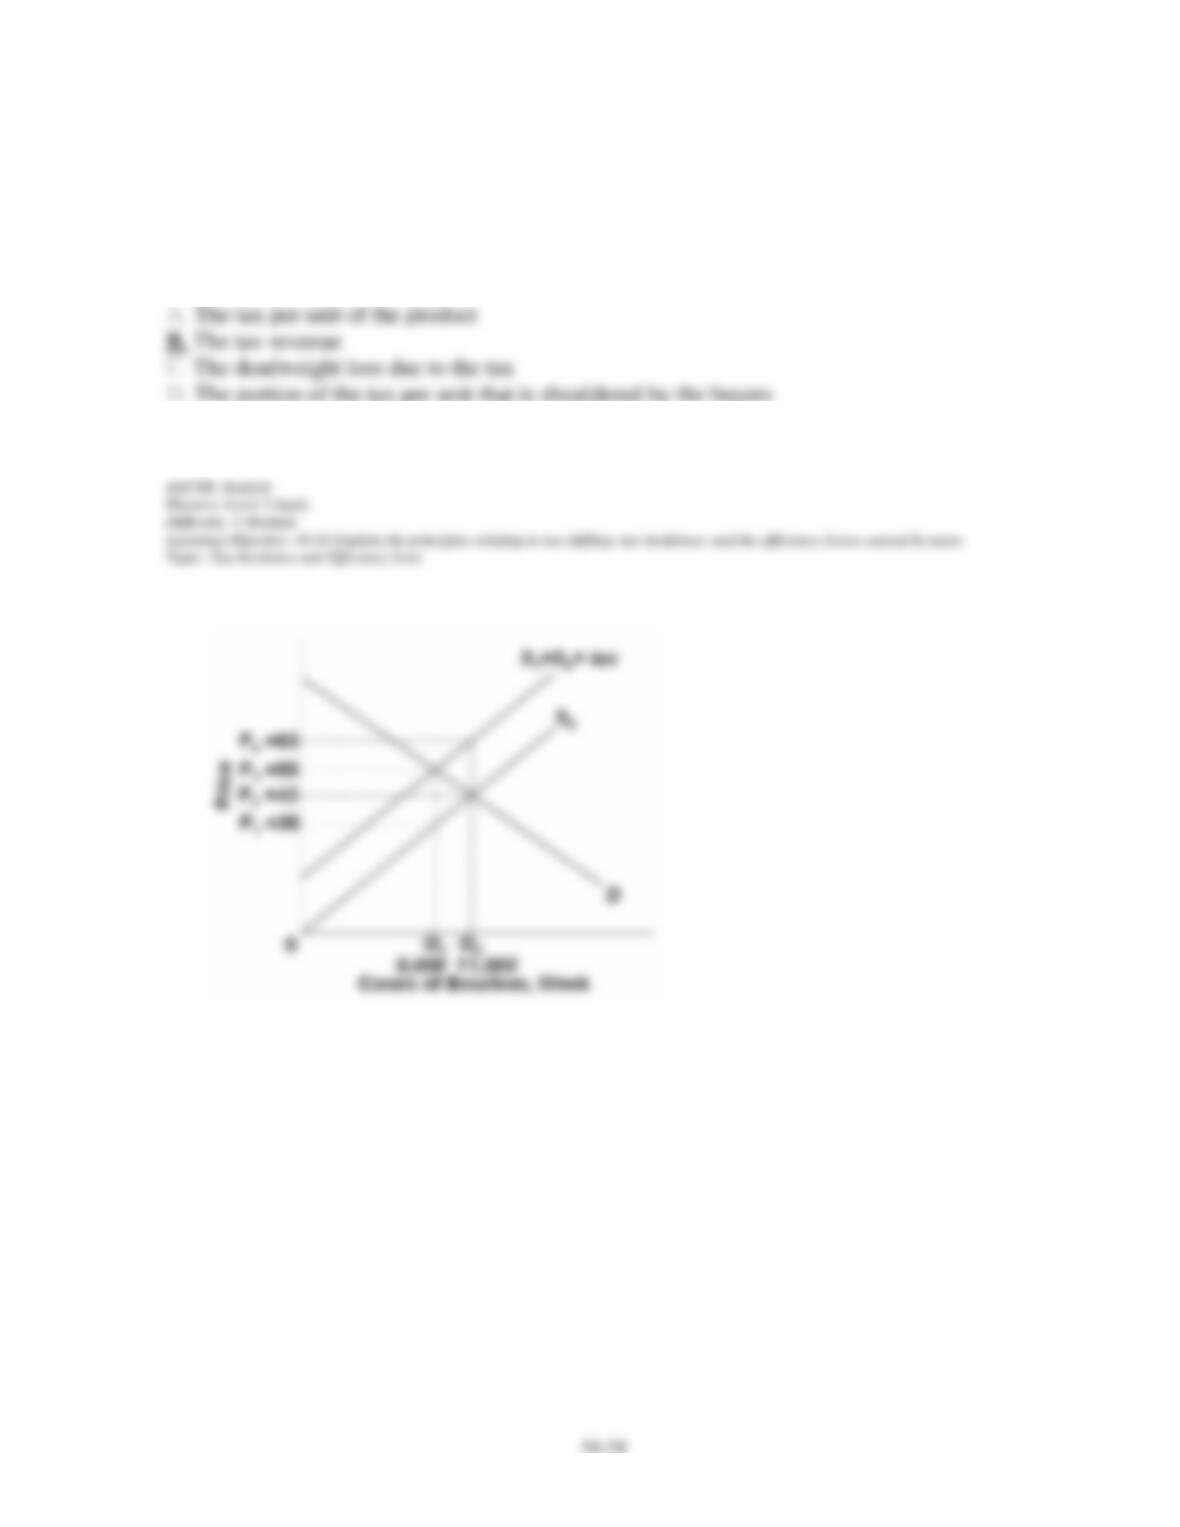
87. Refer to the above graph. Assume the market for this product is in equilibrium at the
intersection of D2 and S1. The shift in supply from S1 to S2 is due to an excise tax imposed on
the product. How much is the tax per unit of product?
88. Refer to the above graph. Assume the market for this product is in equilibrium at the
intersection of D2 and S1. The shift in supply from S1 to S2 is due to an excise tax imposed on
the product. The incidence of the tax is:
89. Refer to the above graph. Assume the market for this product is initially in equilibrium at
the intersection of D2 and S1. The shift in supply from S1 to S2 is due to an excise tax imposed
on the product. The excise tax revenue collected by the government will be:
Chapter 16 – Public Finance: Expenditures and Taxes
90. Refer to the above graph. Assume the market for this product started out at the
intersection of D2 and S1. Then supply shifted from S1 to S2 due to an excise tax imposed on
the product. If demand subsequently shifts from D2 to D1, then which of the following will
decrease?