
KEYWORDS:
Bloom’s: Comprehension
52. A production function specifies the relation between ____________ and the ___________ to
____________________.
a.
technology; output; Real GDP
b.
technology; the factor inputs; Real GDP
c.
price; quantity; Real GDP
d.
Real GDP; the factor inputs; the price level
Exhibit 17-1
Production Function
Real GDP = T (L, K), such that Real GDP = T(L + K)
Assume that the technology coefficient is equal to 0.40.
53. Refer to Exhibit 17-1. If there are 4 units of capital and 6 units of labor, ________ units of output (Real GDP) will be
produced.
a.
10
b.
5
c.
4
d.
20
POINTS:
1
DIFFICULTY:
Moderate
United States – BUSPROG: Analytic
LOCAL STANDARDS:
United States – OH – Default City – DISC: Productivity and growth
Bloom’s: Application
NOTES:
New
54. Refer to Exhibit 17-1. If this production function is graphed with Real GDP on the vertical axis and labor on the
horizontal axis, the resulting graph would be
a.
upward sloping.
b.
downward sloping.
c.
vertical.
d.
horizontal.
ANSWER:
1
DIFFICULTY:
Moderate
NATIONAL STANDARDS:
United States – BUSPROG: Analytic
ANSWER:
b
POINTS:
1
Moderate
NATIONAL STANDARDS:
United States – BUSPROG: Analytic
United States – OH – Default City – DISC: Productivity and growth
KEYWORDS:
Bloom’s: Comprehension

55. Refer to Exhibit 17-1. If this production function is graphed with Real GDP on the vertical axis and labor on the
horizontal axis, and labor rises from 6 units to 7 units it would cause a
a.
shift upward in the production function to a higher level of Real GDP.
b.
shift downward in the production function to a lower level of Real GDP.
c.
movement down along the same production function to a lower level of Real GDP.
d.
movement up along the same production function to a higher level of Real GDP.
d
Moderate
United States – BUSPROG: Analytic
United States – OH – Default City – DISC: Productivity and growth
Bloom’s: Application
56. Refer to Exhibit 17-1. If this production function is graphed with Real GDP on the vertical axis and labor on the
horizontal axis, and capital rises from 4 units to 6 units it would cause a
a.
shift upward in the production function to a higher level of Real GDP.
b.
shift downward in the production function to a lower level of Real GDP.
c.
movement down along the same production function to a lower level of Real GDP.
d.
movement up along the same production function to a higher level of Real GDP.
1
Moderate
United States – BUSPROG: Analytic
United States – OH – Default City – DISC: Productivity and growth
Bloom’s: Application
57. Refer to Exhibit 17-1. If this production function is graphed with Real GDP on the vertical axis and labor on the
horizontal axis, and the technology coefficient rises from 0.40 to 0.50, it would cause a
a.
shift upward in the production function to a higher level of Real GDP.
b.
shift downward in the production function to a lower level of Real GDP.
c.
movement down along the same production function to a lower level of Real GDP.
d.
movement up along the same production function to a higher level of Real GDP.
1
Moderate
United States – BUSPROG: Analytic
United States – OH – Default City – DISC: Productivity and growth
Bloom’s: Application
58. Refer to Exhibit 17-1. If there are 20 units of capital and 16 units of labor, ________ units of output (Real GDP) will
be produced.
a.
36
b.
5.6
c.
4
United States – OH – Default City – DISC: Productivity and growth
Bloom’s: Application

d.
14.4
59. In the production function Real GDP = T (L, K), the T represents the _____________ coefficient, the L represents
________________ and the K represents _______________.
a.
tax; labor; capital
b.
technology; labor; capital
c.
technology; labor; knowledge
d.
technology; livestock; knowledge
1
United States – BUSPROG: Analytic
United States – OH – Default City – DISC: Productivity and growth
Bloom’s: Application
60. When a production function is graphed with Real GDP on the vertical axis and labor on the horizontal axis, a rise in
labor ________________________which shifts the LRAS curve ____________ resulting in ______________________.
a.
shifts the production function up; rightward; economic growth
b.
shifts the production function down; leftward; a shrinking economy
c.
moves us up along a given production function; rightward; economic growth
d.
moves us down along a given production function; leftward; a shrinking economy
1
United States – BUSPROG: Analytic
United States – OH – Default City – DISC: Productivity and growth
Bloom’s: Application
61. Suppose that the production function for an economy is graphed with Real GDP on the vertical axis and labor on the
horizontal axis. When the level of capital in this economy rises, it causes ____________________which shifts the LRAS
curve ____________ resulting in ______________________.
a.
a movement down along a given production function; leftward; a shrinking economy
b.
the production function to shift downward; leftward; a shrinking economy
c.
a movement up along a given production function; rightward; economic growth
d.
the production function to shift upward; rightward; economic growth
1
Moderate
d
Moderate
United States – BUSPROG: Analytic
United States – OH – Default City – DISC: Productivity and growth
Bloom’s: Application

62. When income taxes are lowered in a given economy, it causes the supply of labor curve to shift __________which
___________ the equilibrium quantity of labor employed. In terms of the production function (graphed with labor on the
horizontal axis and Real GDP on the vertical axis) this then causes _______________, which makes the LRAS curve shift
____________ resulting in ______________________.
a.
rightward; raises; the production function to shift upward; rightward; economic growth
b.
leftward; lowers; the production function to shift downward; leftward; a shrinking economy
c.
rightward; raises; a movement up along a given production function; rightward; economic growth
d.
rightward; raises; a movement down along a given production function; leftward; a shrinking economy
United States – BUSPROG: Analytic
United States – OH – Default City – DISC: Productivity and growth
Bloom’s: Application
63. When interest rates fall in a given economy, it causes firms to borrow __________ funds used for purchasing capital
goods. The result will be a(n) ___________ in the level of capital employed in the economy. In terms of the production
function (graphed with labor on the horizontal axis and Real GDP on the vertical axis), this then
causes ____________________ which makes the LRAS curve shift ____________ resulting in
______________________.
a.
more; increase; the production function to shift upward; rightward; economic growth
b.
less; decrease; the production function to shift downward; leftward; a shrinking economy
c.
more; increase; a movement up along a given production function; rightward; economic growth
d.
more; increase; a movement down along a given production function; leftward; a shrinking economy
United States – BUSPROG: Analytic
United States – OH – Default City – DISC: Productivity and growth
Bloom’s: Application
64. When a production function is graphed with Real GDP on the vertical axis and labor on the horizontal axis, a rise in
labor ________________________, and a rise in capital __________________.
a.
shifts the production function upward; also shifts the production function upward
b.
shifts the production function downward; shifts the production function upward
c.
moves us up along a given production function; shifts the production function upward
d.
shifts the production function upward; moves us up along a given production function
United States – BUSPROG: Analytic
United States – OH – Default City – DISC: Productivity and growth
United States – OH – Default City – DISC: Productivity and growth
Bloom’s: Application

65. When a production function is graphed with Real GDP on the vertical axis and labor on the horizontal axis, a rise in
labor ________________________, and a rise in the technology coefficient __________________.
a.
shifts the production function upward; also shifts the production function upward
b.
moves us up along a given production function; shifts the production function upward
c.
shifts the production function downward; shifts the production function upward
d.
shifts the production function upward; moves us up along a given production function
66. When taxes on the return to capital in a given economy are reduced, it causes firms to employ __________ capital
goods. In terms of the production function (graphed with labor on the horizontal axis and Real GDP on the vertical axis),
this then causes ____________________ which makes the LRAS curve shift ____________ resulting in
______________________.
a.
less; the production function to shift downward; leftward; a shrinking economy
b.
more; the production function to shift upward; rightward; economic growth
c.
more; a movement up along a given production function; rightward; economic growth
d.
more; a movement down along a given production function; leftward; a shrinking economy
United States – BUSPROG: Analytic
United States – OH – Default City – DISC: Productivity and growth
Bloom’s: Application
67. In the production function Real GDP = T (L, K, NR, H), the T represents the _____________ coefficient, the L
represents ________________, the K represents _______________, the NR represents natural resources, and the H
represents ________________.
a.
tax; labor; capital; humanity
b.
technology; labor; knowledge; humanity
c.
technology; labor; capital; human capital
d.
trade; labor; knowledge; human capital
United States – BUSPROG: Analytic
United States – OH – Default City – DISC: Productivity and growth
Bloom’s: Application
68. When interest rates in a given economy are reduced, it causes firms to employ __________ capital goods. In terms of
the production function (graphed with labor on the horizontal axis and Real GDP on the vertical axis), this then
causes ____________________ .
a.
more; the production function to shift upward
b.
less; the production function to shift downward
United States – BUSPROG: Analytic
United States – OH – Default City – DISC: Productivity and growth
Bloom’s: Application

c.
more; a movement up along a given production function
d.
more; a movement down along a given production function
69. When a production function is graphed with Real GDP on the vertical axis and labor on the horizontal axis, a rise in
capital________________________, and a rise in the technology coefficient __________________.
a.
shifts the production function upward; also shifts the production function upward
b.
shifts the production function downward; shifts the production function upward
c.
moves us up along a given production function; shifts the production function upward
d.
shifts the production function upward; moves us up along a given production function
United States – BUSPROG: Analytic
United States – OH – Default City – DISC: Productivity and growth
Bloom’s: Application
70. Examples of physical capital include _______________________. Examples of human capital include
______________________________.
a.
knowledge one picks up through education and training; factories and computers
b.
machines and factories; chairs and desks
c.
knowledge one picks up through education and experience; factories and machines
d.
machines and factories; knowledge one picks up through education and training
United States – BUSPROG: Analytic
United States – OH – Default City – DISC: Productivity and growth
Bloom’s: Application
Exhibit 17-2
United States – BUSPROG: Analytic
United States – OH – Default City – DISC: Productivity and growth
Bloom’s: Application
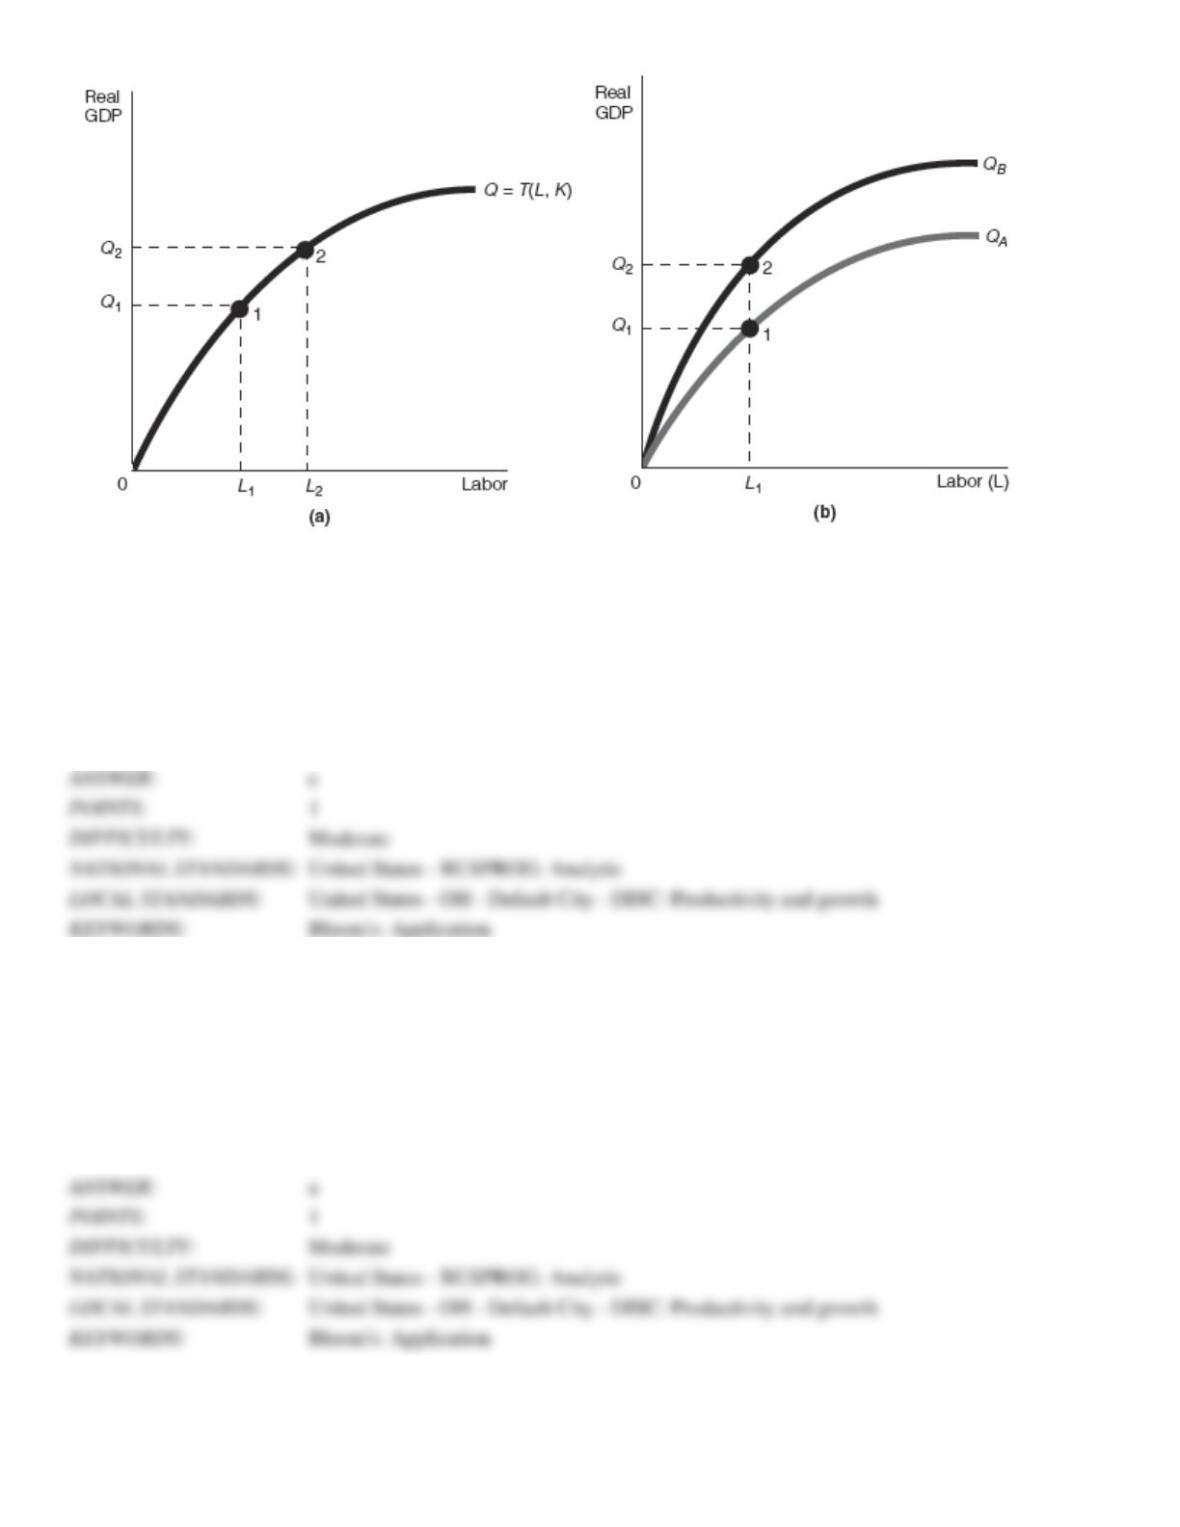
71. Refer to Exhibit 17-2. Assume that the starting point is always point 1. Which of the production function graphs
shown, (a) or (b), represents an increase in the quantity of labor, and which represents an increase in the quantity of
capital, respectively?
a.
(a); (a)
b.
(b); (a)
c.
(a); (b)
d.
(b); (b)
72. Refer to Exhibit 17-2. Assume that the starting point is always point 1. Which of the production function graphs
shown, (a) or (b), represents an increase in the quantity of labor, and which represents an increase in the technology
coefficient, respectively?
a.
(a); (b)
b.
(b); (a)
c.
(a); (a)
d.
(b); (b)
United States – BUSPROG: Analytic
United States – OH – Default City – DISC: Productivity and growth
Bloom’s: Application
Exhibit 17-3
United States – BUSPROG: Analytic
United States – OH – Default City – DISC: Productivity and growth
Bloom’s: Application
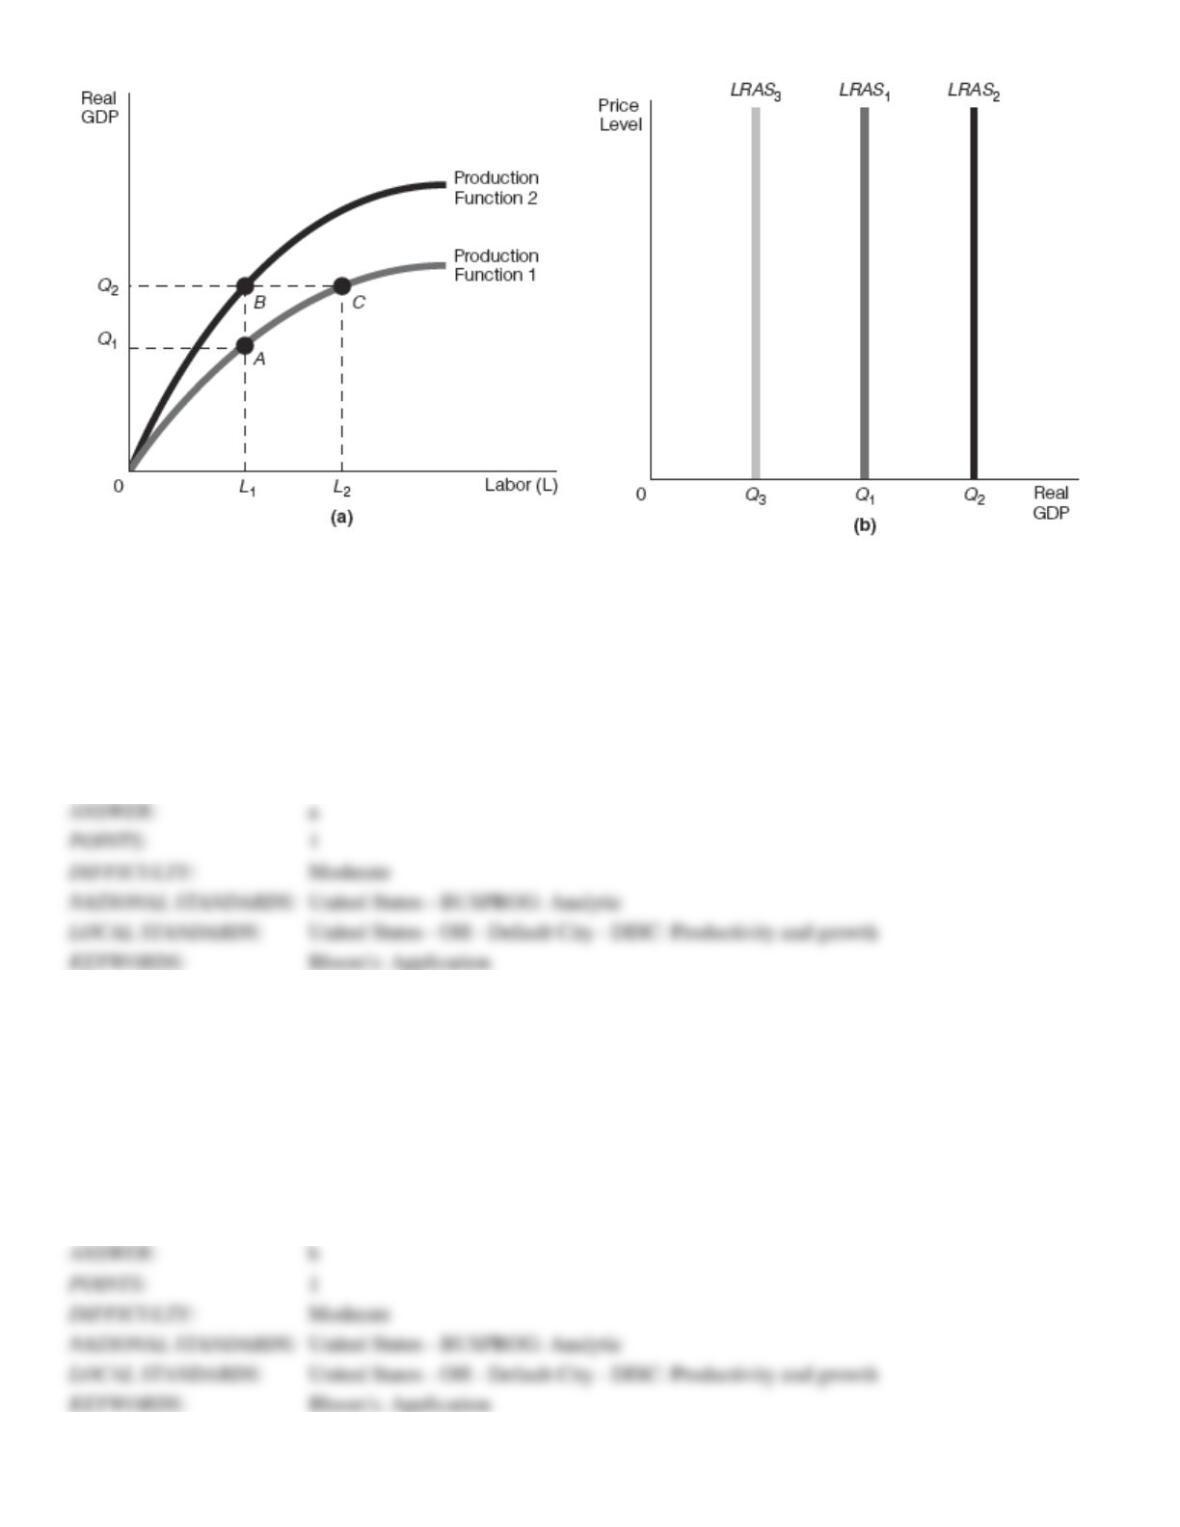
73. Refer to Exhibit 17-3 Assume that the starting point on the production function is point A. After an increase in the
quantity of labor, there would be a ______________________ which would shift the LRAS curve from LRAS1 to
_______________ resulting in _______________..
a.
movement along the production function to point C; LRAS2; economic growth
b.
shifting upward of the production function to point B; LRAS2; economic growth
c.
movement along the production function to point C; LRAS3; a shrinking economy
d.
shifting upward of the production function to point B; LRAS3; a shrinking economy
74. Refer to Exhibit 17-3 Assume that the starting point on the production function is point A. After an increase in the
quantity of capital, there would be a ______________________ which would shift the LRAS curve from LRAS1 to
_______________ resulting in _______________..
a.
movement along the production function to point C; LRAS2; economic growth
b.
shift upward of the production function to point B; LRAS2; economic growth
c.
movement along the production function to point C; LRAS3; a shrinking economy
d.
shift upward of the production function to point B; LRAS3; a shrinking economy
75. Refer to Exhibit 17-3 Assume that the starting point on the production function is point A. After an increase in the
technology coefficient, there would be a ______________________ which would shift the LRAS curve from LRAS1 to
_______________ resulting in _______________..
a.
movement along the production function to point C; LRAS2; economic growth
b.
shift upward of the production function to point B; LRAS2; economic growth
c.
movement along the production function to point C; LRAS3; a shrinking economy
d.
shift upward of the production function to point B; LRAS3; a shrinking economy
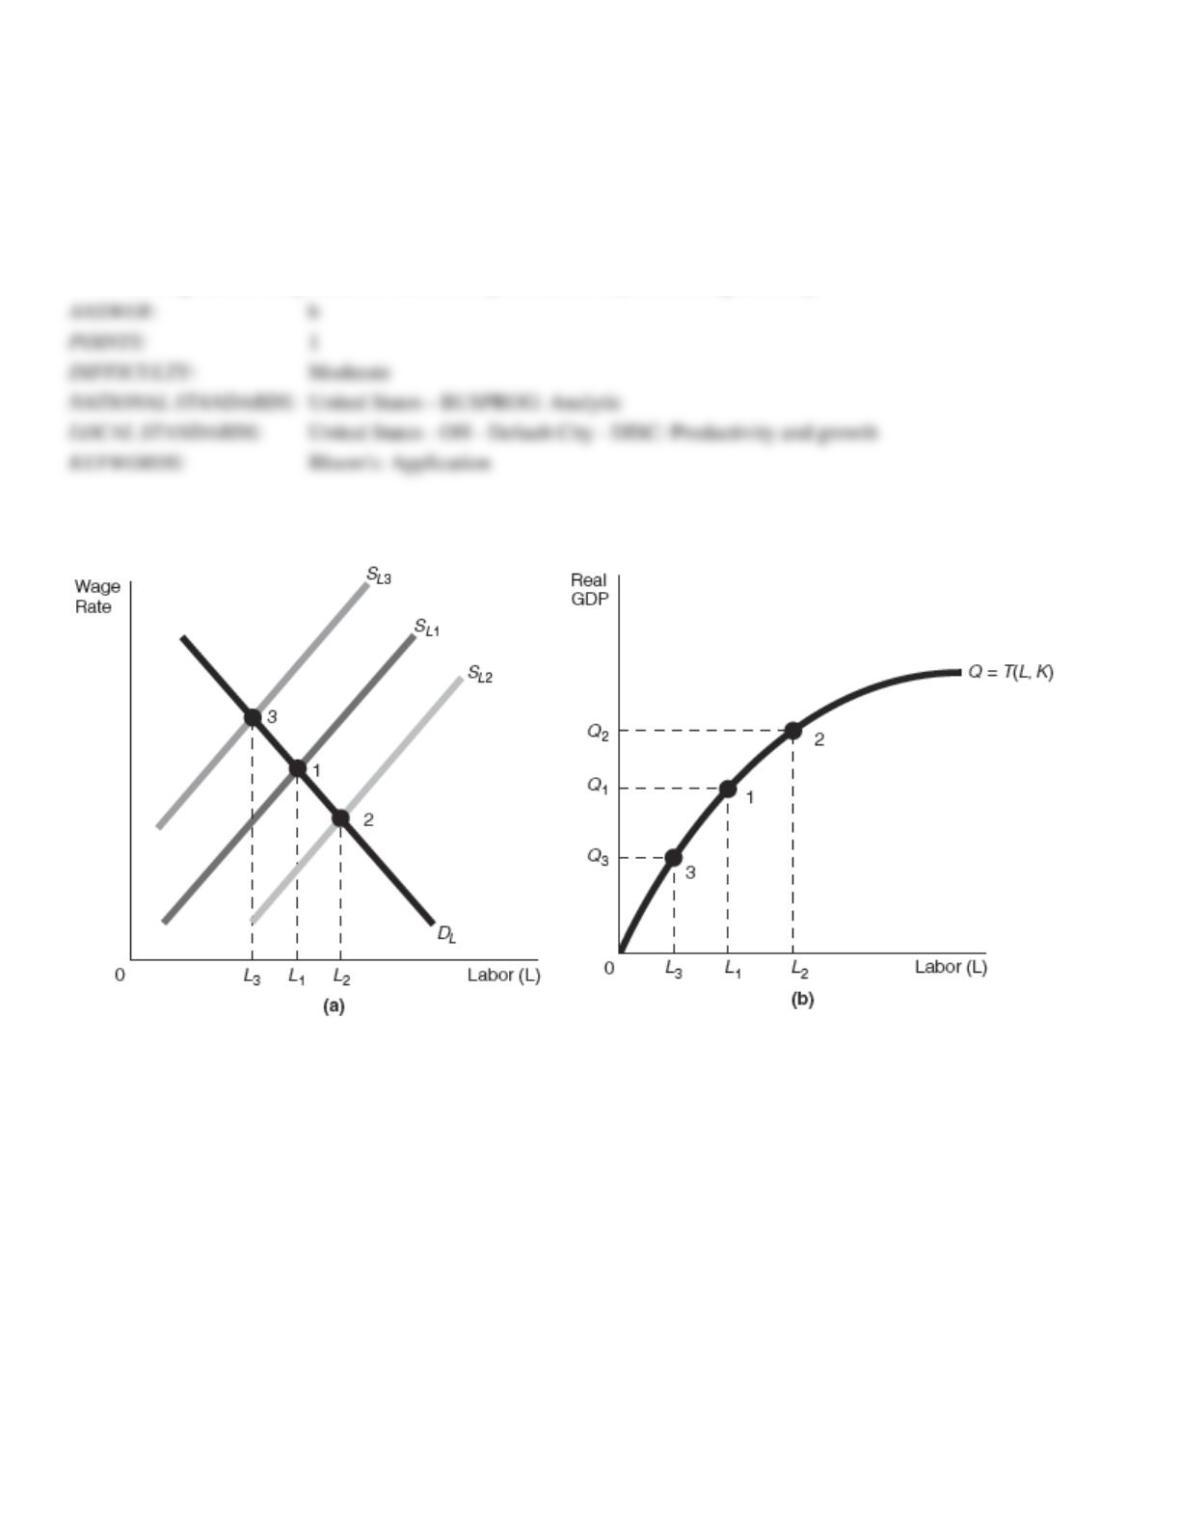
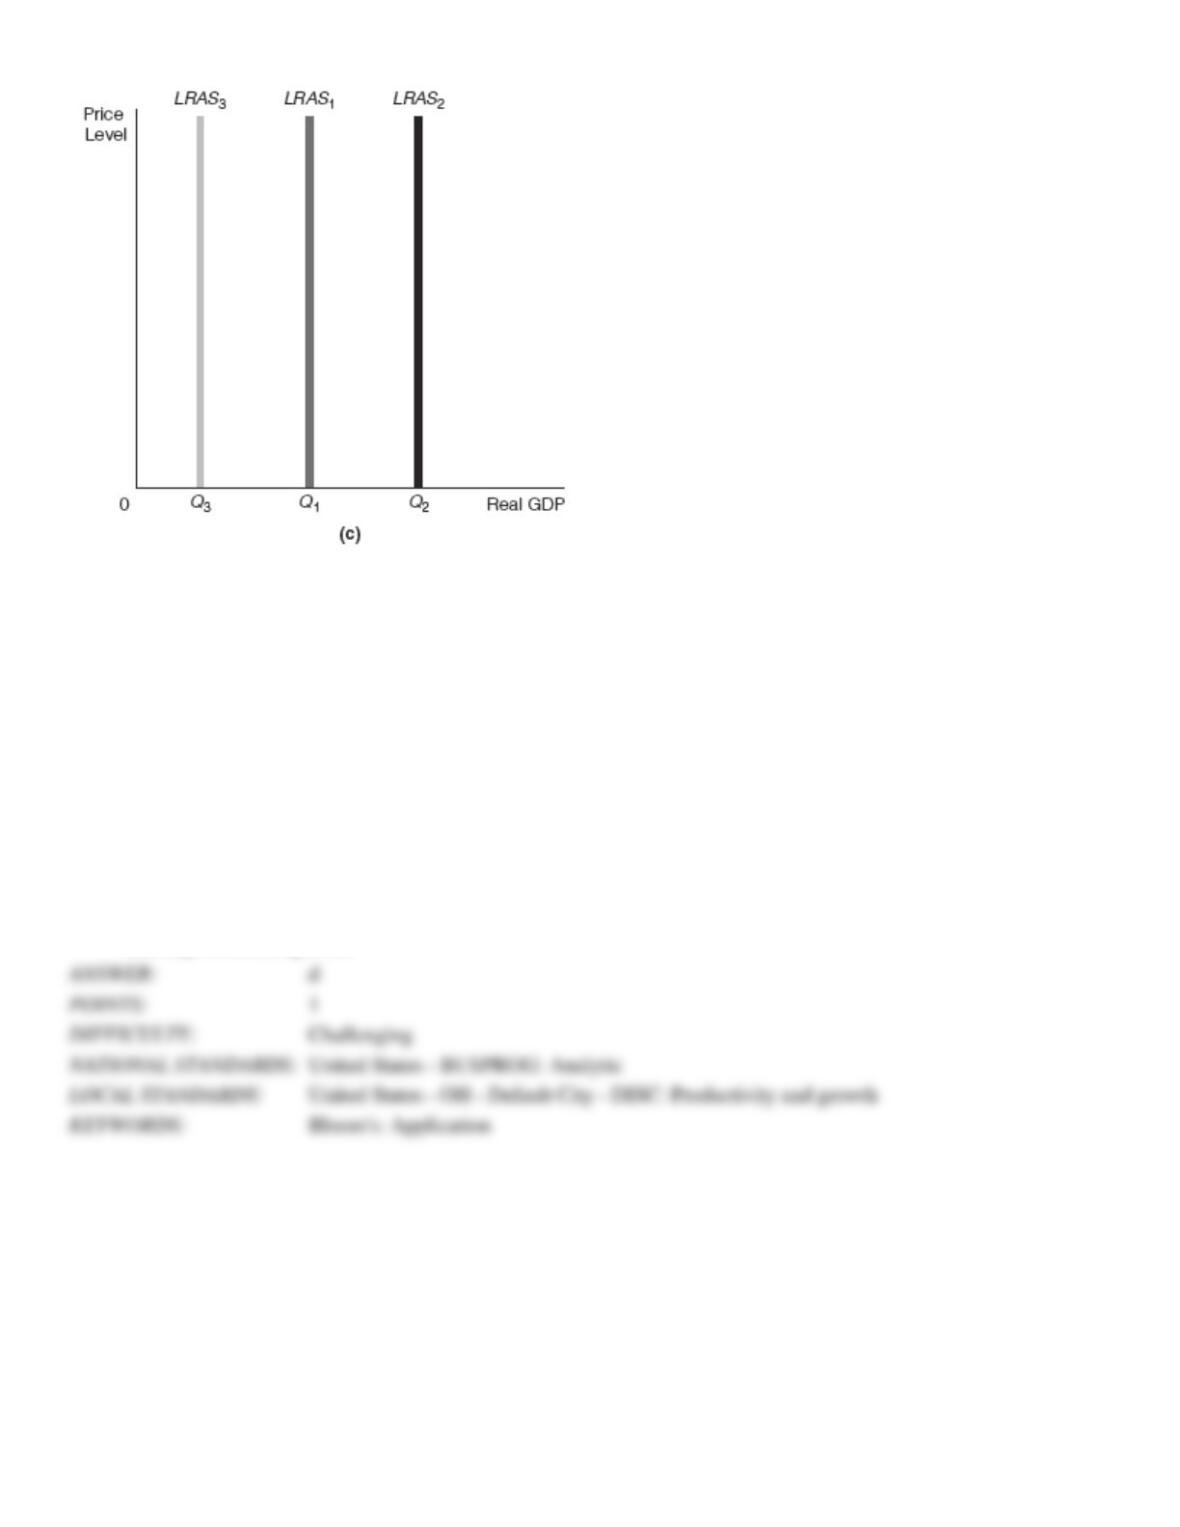
Exhibit 17-4
76. Refer to Exhibit 17-4 Assume that the starting point in graphs (a) and (b) in Exhibit 17-4 is point 1. After a decrease
in income taxes, there would be a ______________________ which would cause a movement along the production
function from point 1 to point ______________. The result would be a shift of the LRAS curve from LRAS1 to
_______________ resulting in _______________..
a.
leftward shift of the labor supply curve from SL1 to SL3; movement along the production function to point 3;
LRAS3; a shrinking economy
b.
rightward shift of the labor supply curve from SL1 to SL2; movement along the production function to point 3;
LRAS3; a shrinking economy
c.
leftward shift of the labor supply curve from SL1 to SL3; movement along the production function to point 2;
LRAS2; economic growth
d.
rightward shift of the labor supply curve from SL1 to SL2; movement along the production function to point 2;
LRAS2; economic growth
Exhibit 17-5
Applying the concept of a production function to your learning, assume that the amount of learning you acquire can be
summarized by the following equation (and that your motivation to learn and the quality of instruction are both rated on a
scale from 1 to 10):
Amount of learning acquired = 0.2(number of books read) + 0.25(hours spent studying) + 0.15(quality of instruction) +
0.4(motivation to learn)
77. Refer to Exhibit 17-5. Based on the equation given in this exhibit, if you read 2 books, study for 3 hours, have an
instructor whose quality of instruction is ranked as 4, and your motivation to learn is ranked as 7, what is the amount of
United States – BUSPROG: Analytic
United States – OH – Default City – DISC: Productivity and growth

learning that you will acquire?
a.
2.65
b.
9.65
c.
16
d.
4.55
78. Refer to Exhibit 17-5. Based on the equation given in this exhibit, if your motivation to learn rises from 7 to 9, by
how much will the amount of learning acquired rise as a result?
a.
2
b.
0.8
c.
1.6
d.
8
b
1
Challenging
United States – BUSPROG: Analytic
Bloom’s: Application
Economics 24/7
New
Essay
79. List and describe four factors that can contribute to economic growth.
1
Moderate
United States – BUSPROG: Analytic
United States – OH – Default City – DISC: Productivity and growth
Bloom’s: Application
80. Describe new growth theory. Explain how it differs from neoclassical growth theory.
d
1
Challenging
United States – BUSPROG: Analytic
United States – OH – Default City – DISC: Productivity and growth
Bloom’s: Application
Economics 24/7
New

81. Using the production function Real GDP = T (L, K), define the term production function and describe what each of
the variables (T, L, and K) represents. When graphed with Real GDP on the vertical axis and labor on the horizontal axis,
which variable(s) can shift the production function and which variable(s) can cause a movement along the production
function?
82. Using the production function Real GDP = T (L, K), define the term production function and describe what each of the
variables (T, L, and K) represents. When graphed with Real GDP on the vertical axis and labor on the horizontal axis,
which variable(s) can shift the production function and which variable(s) can cause a movement along the production
function?
83. Using the labor market, the production function Real GDP = T (L, K), and the LRAS curve, describe the process by
which a decrease in income taxes impacts economic growth.

84. Using the production function Real GDP = T (L, K), and the LRAS curve, describe the process by which a decline in
taxes on the returns to capital impacts economic growth.
85. Using the production function Real GDP = T (L, K), and the LRAS curve, describe the process by which a decline in
interest rates impacts the use of capital and economic growth.