Figure: Efficiency and Pollution
Reference: Ref 16-11
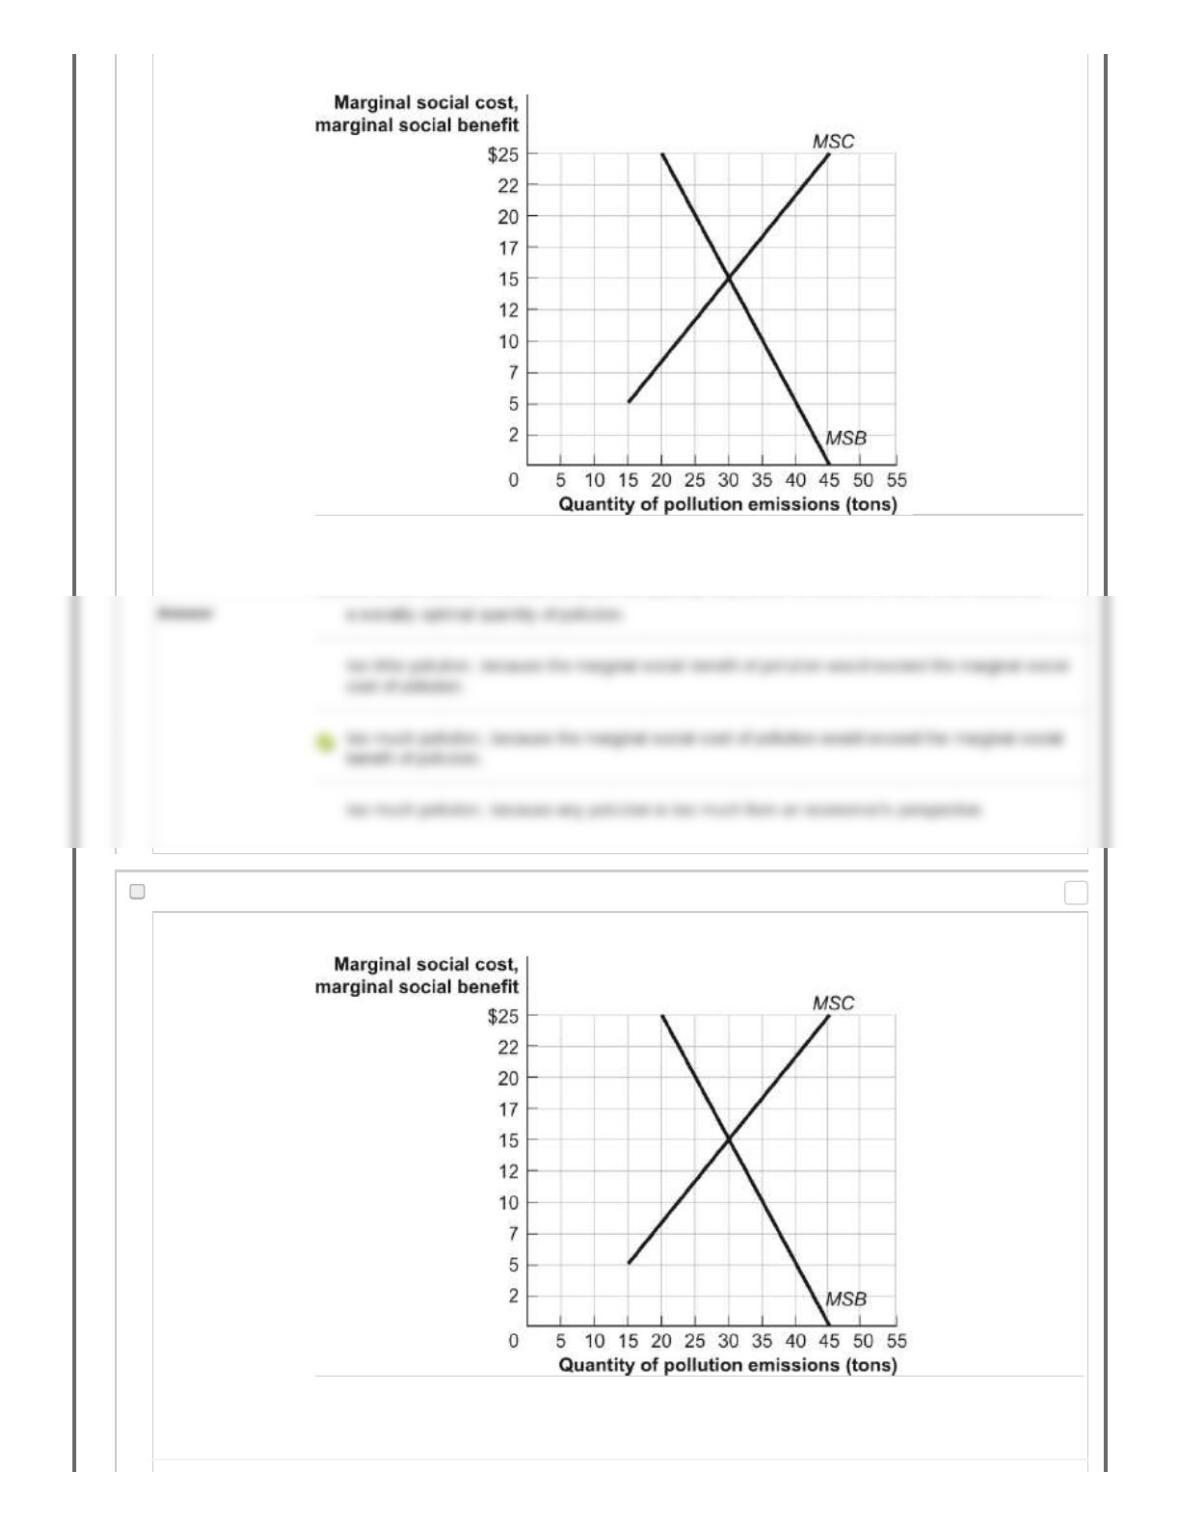
(Figure: Efficiency and Pollution) Look at the figure Efficiency and Pollution. If the government imposed an
environmental standard that did not allow the quantity of pollution to exceed 40 tons, there would be:
191. Multiple Choice: Figure: Efficiency and Pollution Refe…
Question Figure: Efficiency and Pollution
Reference: Ref 16-11
(Figure: Efficiency and Pollution) Look at the figure Efficiency and Pollution. If the government imposed an
environmental standard that did not allow the quantity of pollution to exceed 30 tons, there would be:
Points: 0
192. Multiple Choice: Figure: MSB and MSC of Pollution Refe…
Question Figure: MSB and MSC of Pollution
Reference: Ref 16-12
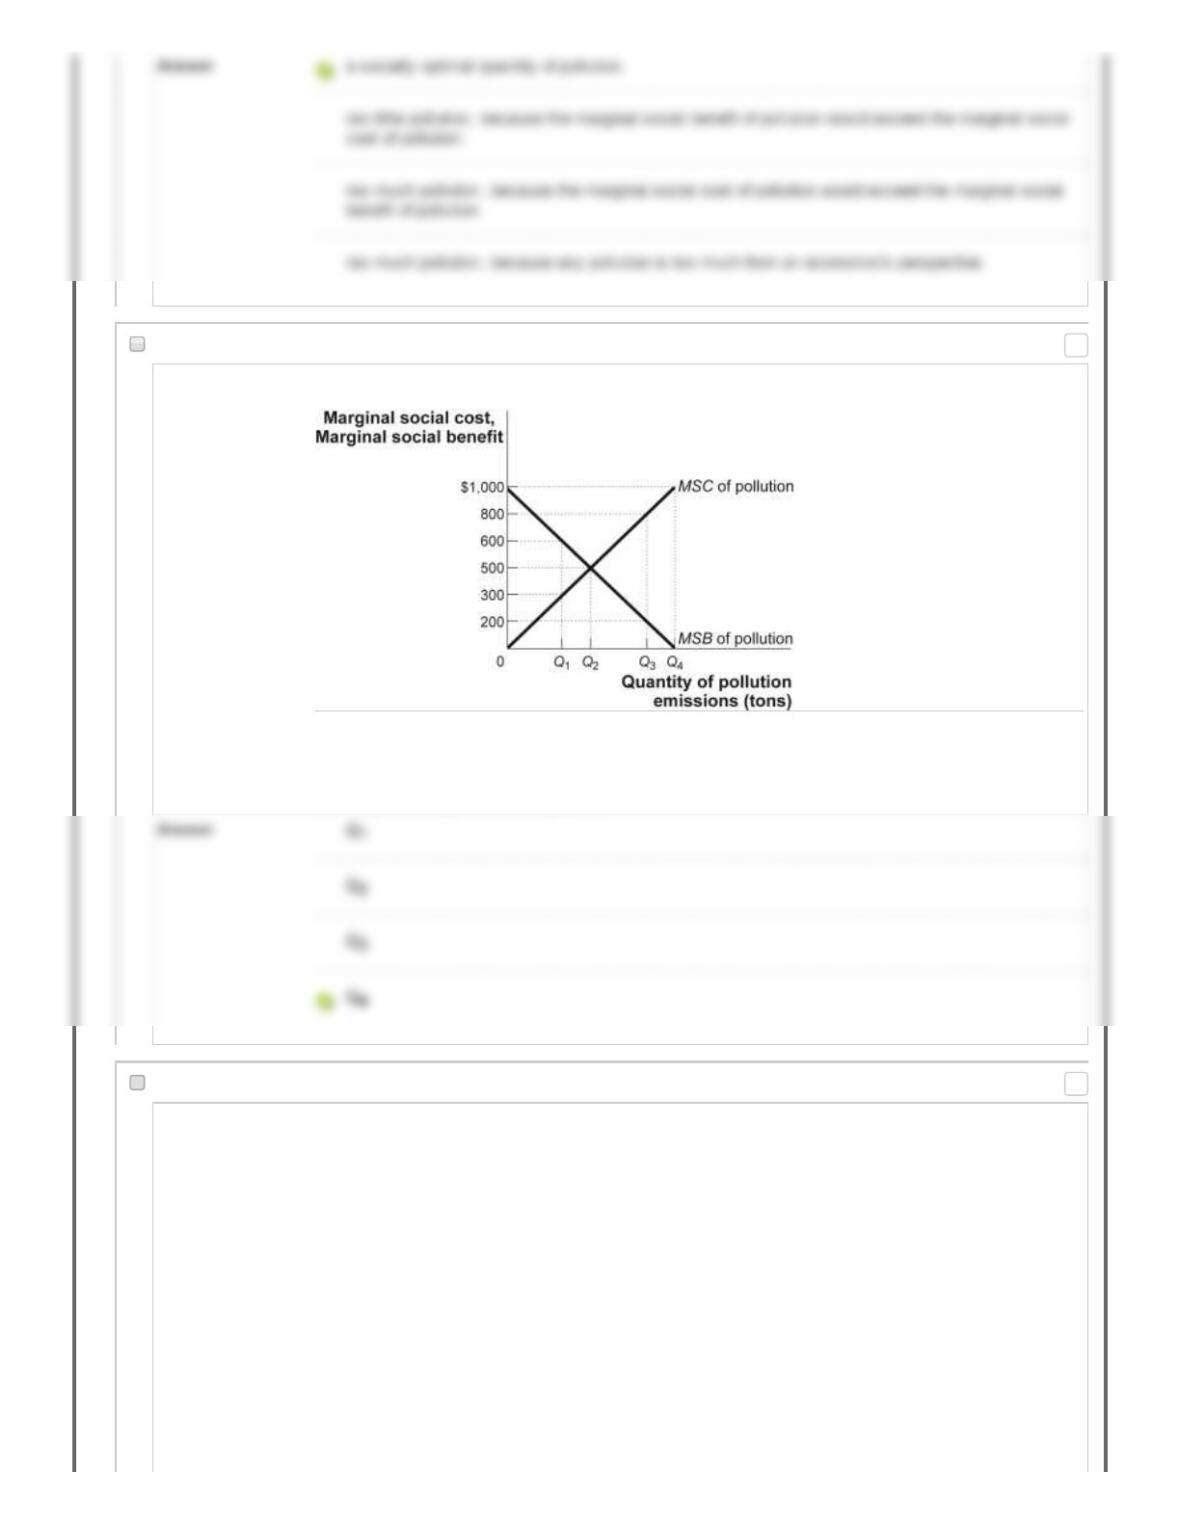
(Figure: MSB and MSC of Pollution) The figure MSB and MSC of Pollution shows the marginal social
cost and marginal social benefit of pollution. What level of pollution would be emitted in a market
economy without government regulation?
193. Multiple Choice: Figure: MSB and MSC of Pollution Refe…
Question
Points: 0
Points: 0
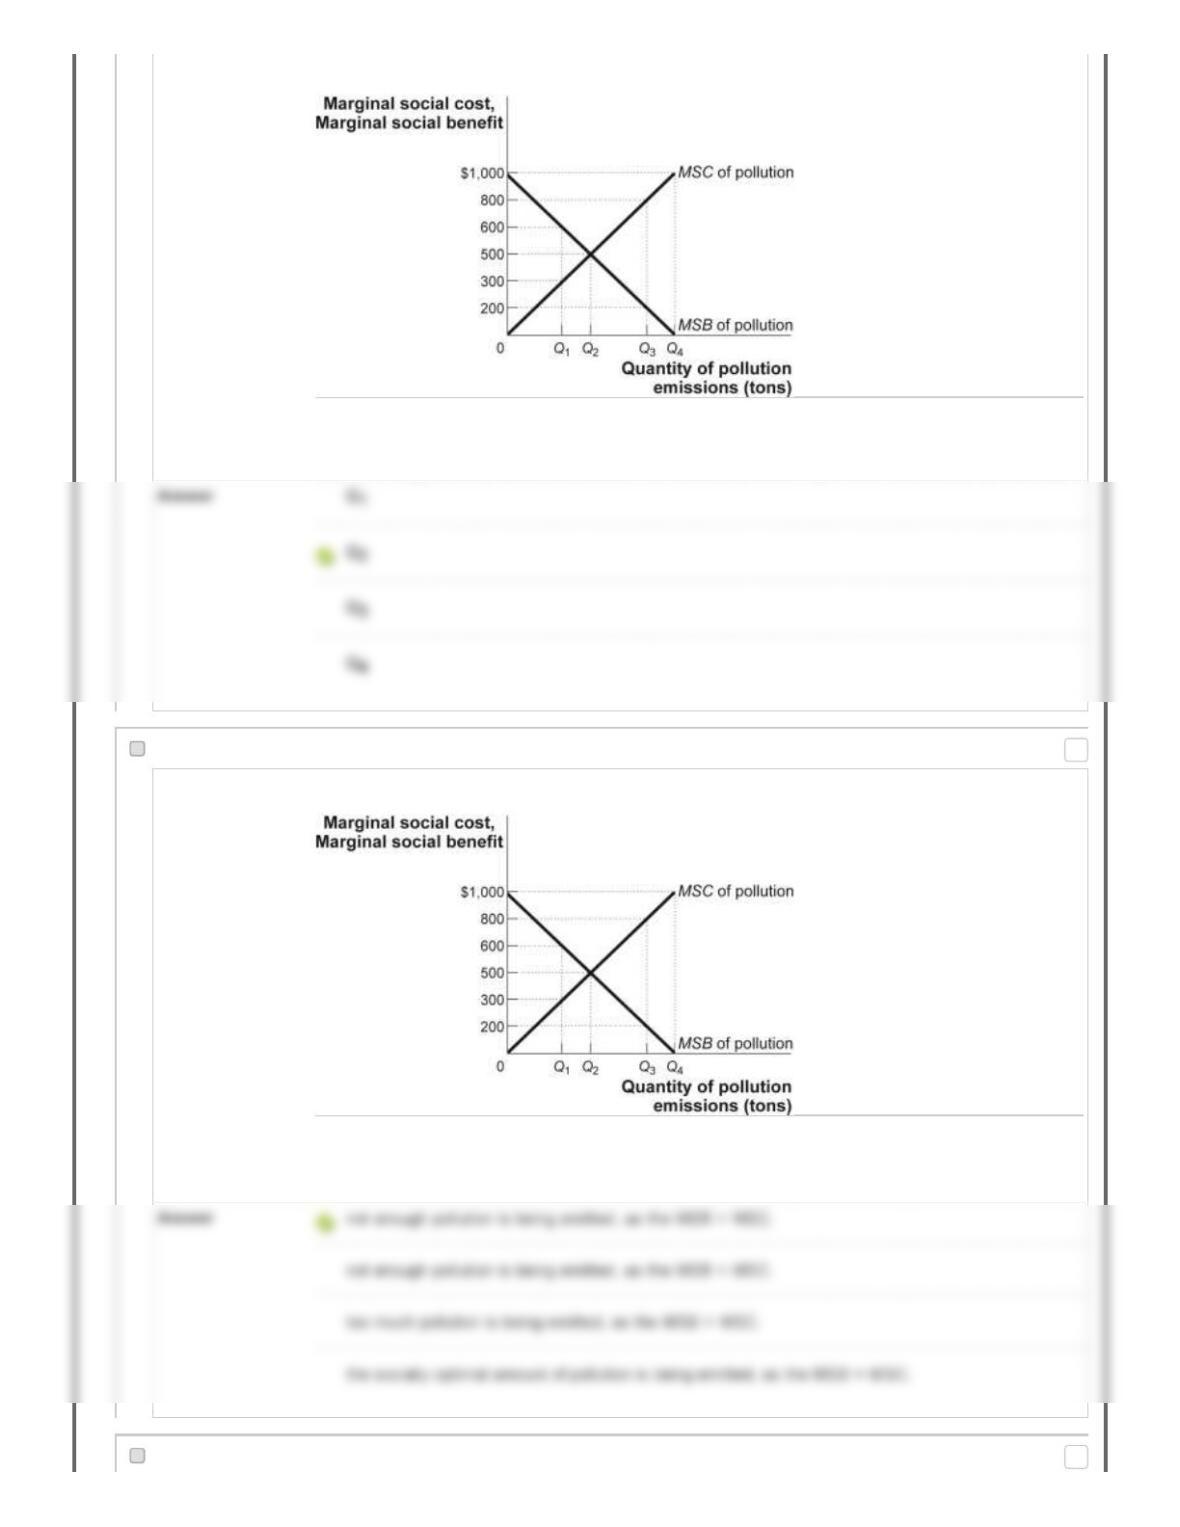
Figure: MSB and MSC of Pollution
Reference: Ref 16-12
(Figure: MSB and MSC of Pollution) The figure MSB and MSC of Pollution shows the marginal social
cost and marginal social benefit of pollution. What level of pollution represents the socially optimal level?
194. Multiple Choice: Figure: MSB and MSC of Pollution Refe…
Question Figure: MSB and MSC of Pollution
Reference: Ref 16-12
(Figure: MSB and MSC of Pollution) The figure MSB and MSC of Pollution shows the marginal social
cost and marginal social benefit of pollution. If the current level of pollution is at Q1:
195. Multiple Choice: (Figure: MSB and MSC of Pollution) Th...
Points: 0
Points: 0

Question (Figure: MSB and MSC of Pollution) The figure MSB and MSC of Pollution shows the marginal social
cost and marginal social benefit of pollution. Suppose pollution is unregulated. What is the level of an
emissions tax that would move the level of pollution to the socially optimal level?
196. Multiple Choice: Figure: Model of a Competitive Market…
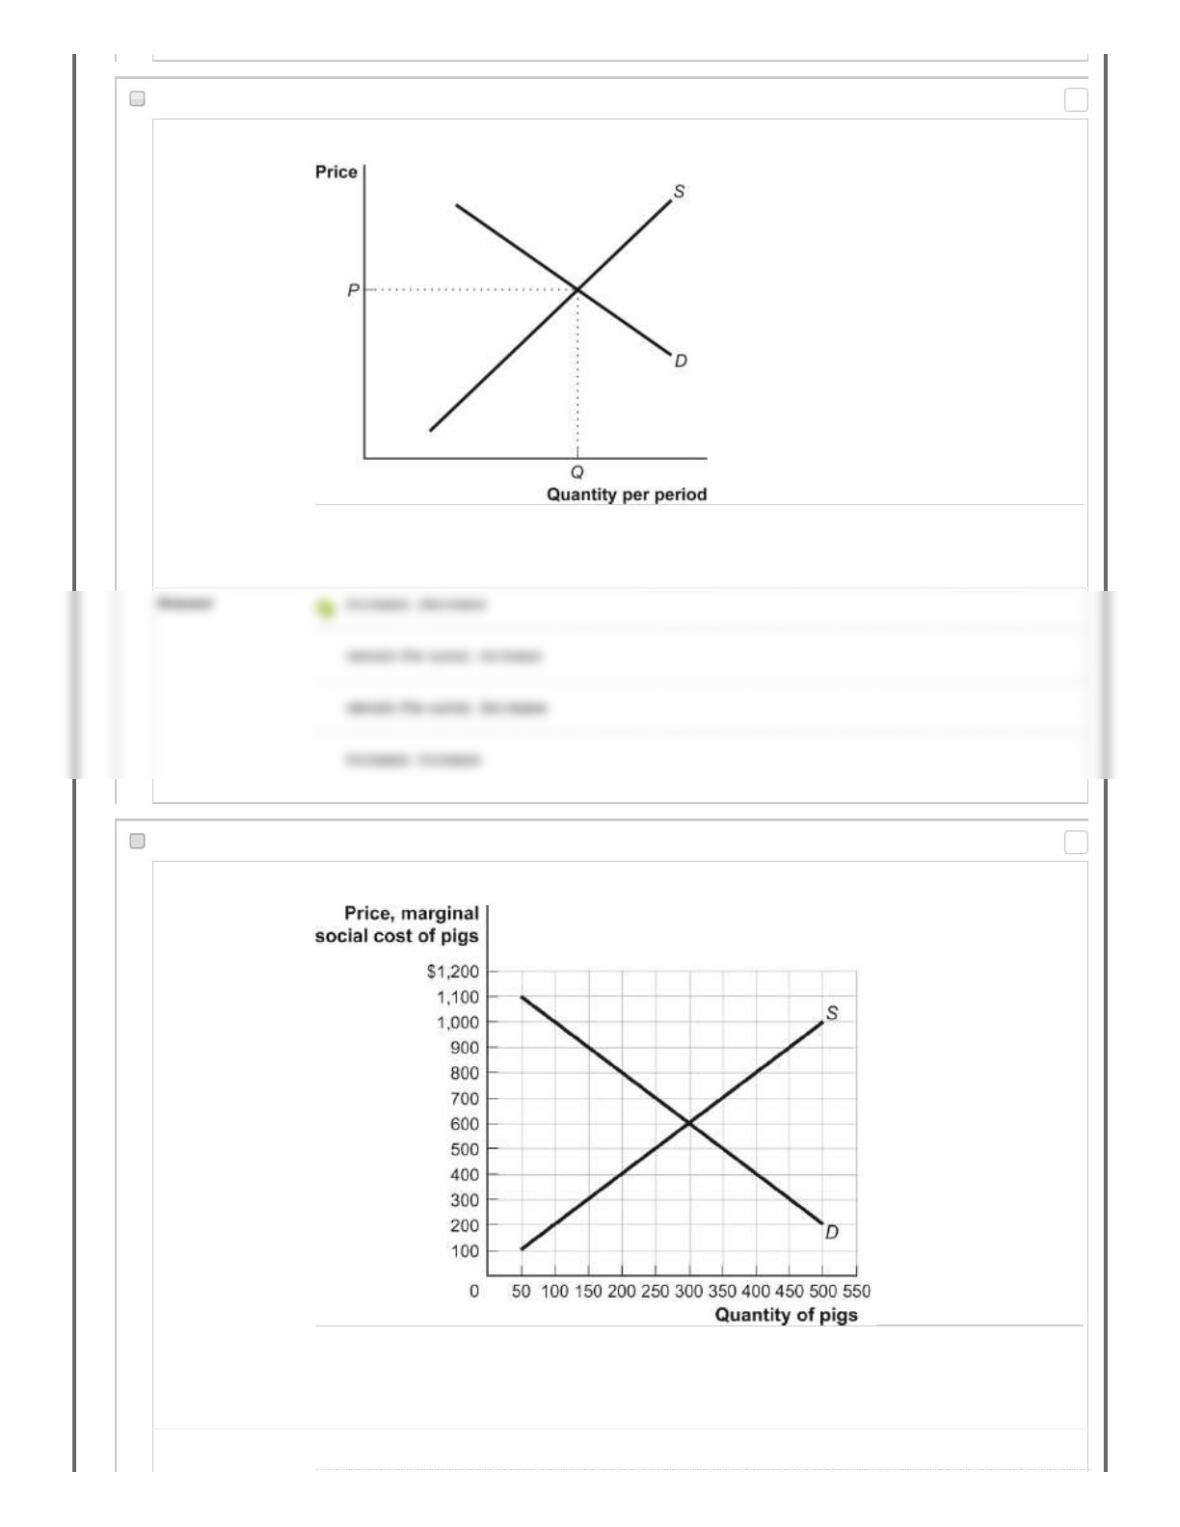
Question Figure: Model of a Competitive Market
Reference: Ref 16-13
(Figure: Model of a Competitive Market) Given the figure Model of a Competitive Market, if there are no
external benefits or costs, the output at Q will be:
197. Multiple Choice: Figure: Model of a Competitive Market…
Question
Points: 0
Points: 0
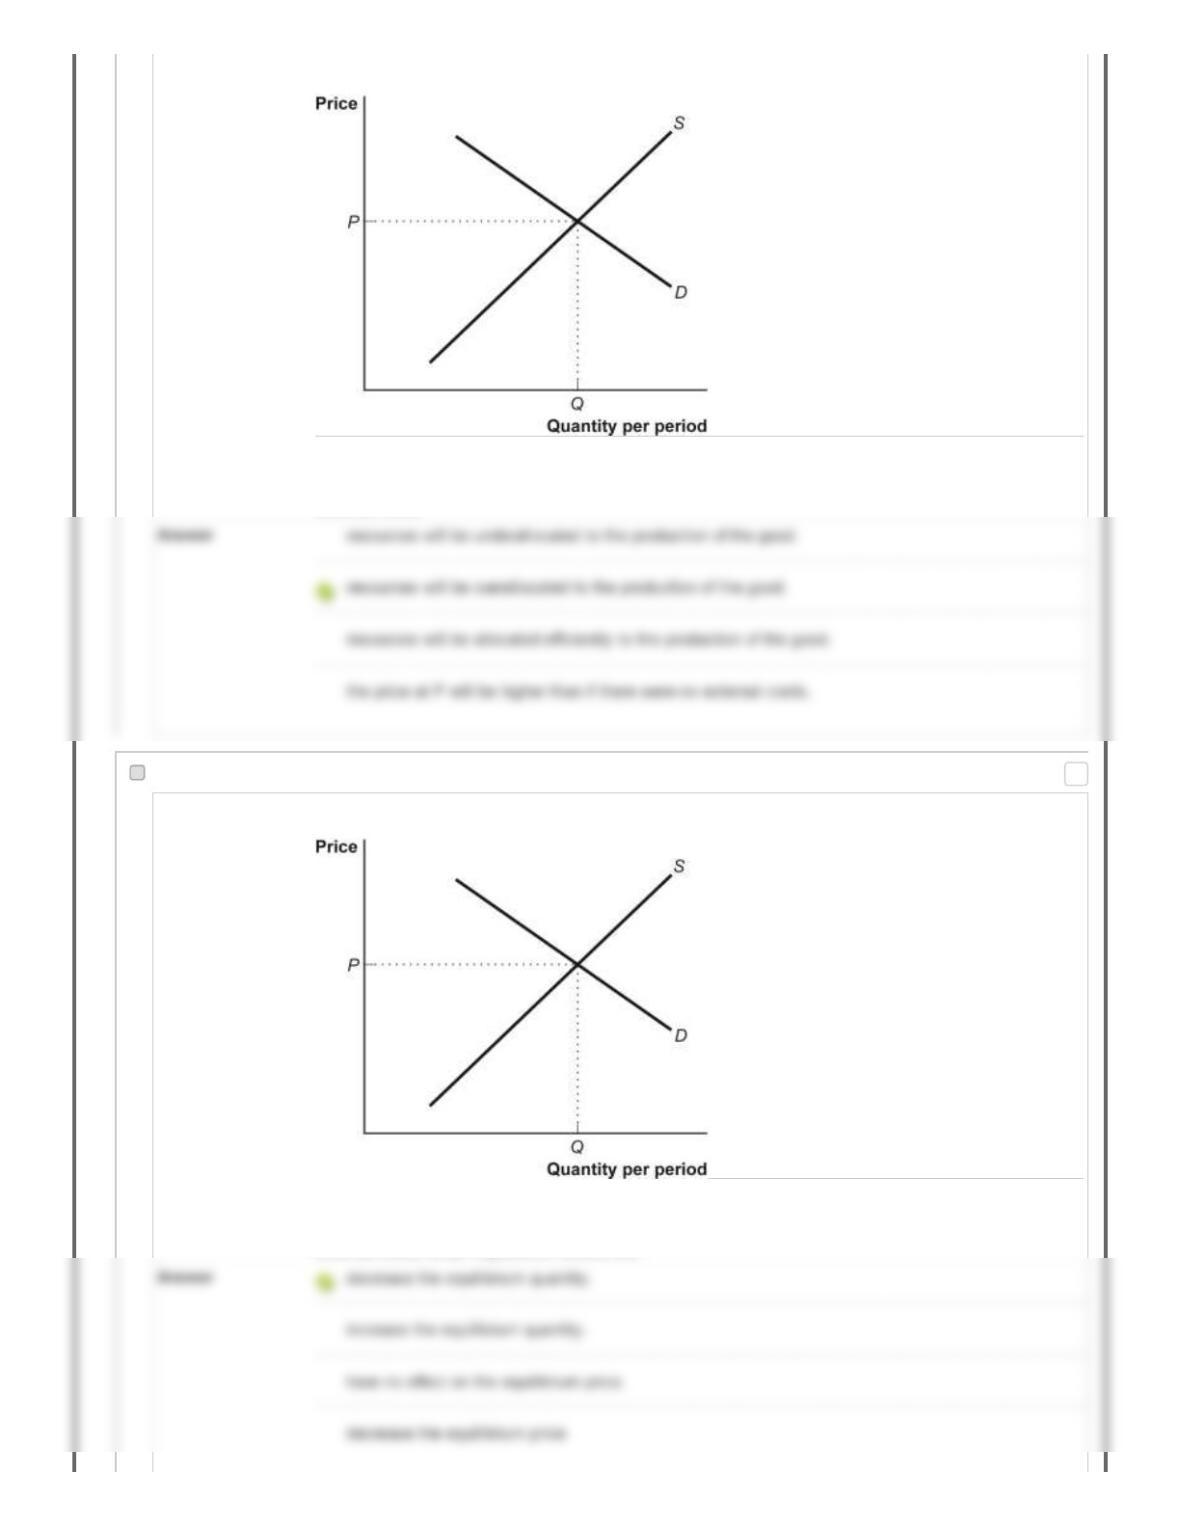
Figure: Model of a Competitive Market
Reference: Ref 16-13
(Figure: Model of a Competitive Market) Given the figure Model of a Competitive Market, if there are
external costs:
198. Multiple Choice: Figure: Model of a Competitive Market…
Question Figure: Model of a Competitive Market
Reference: Ref 16-13
(Figure: Model of a Competitive Market) Given the figure Model of a Competitive Market, if there are
external costs, a tax imposed on sellers will:
Points: 0
199. Multiple Choice: Figure: Model of a Competitive Market…
Question Figure: Model of a Competitive Market
Reference: Ref 16-13
(Figure: Model of a Competitive Market) Given the figure Model of a Competitive Market, if a tax is
imposed on sellers, the equilibrium price will ________ and the equilibrium quantity will ________.
200. Multiple Choice: Figure: Negative Externalities and Ra…
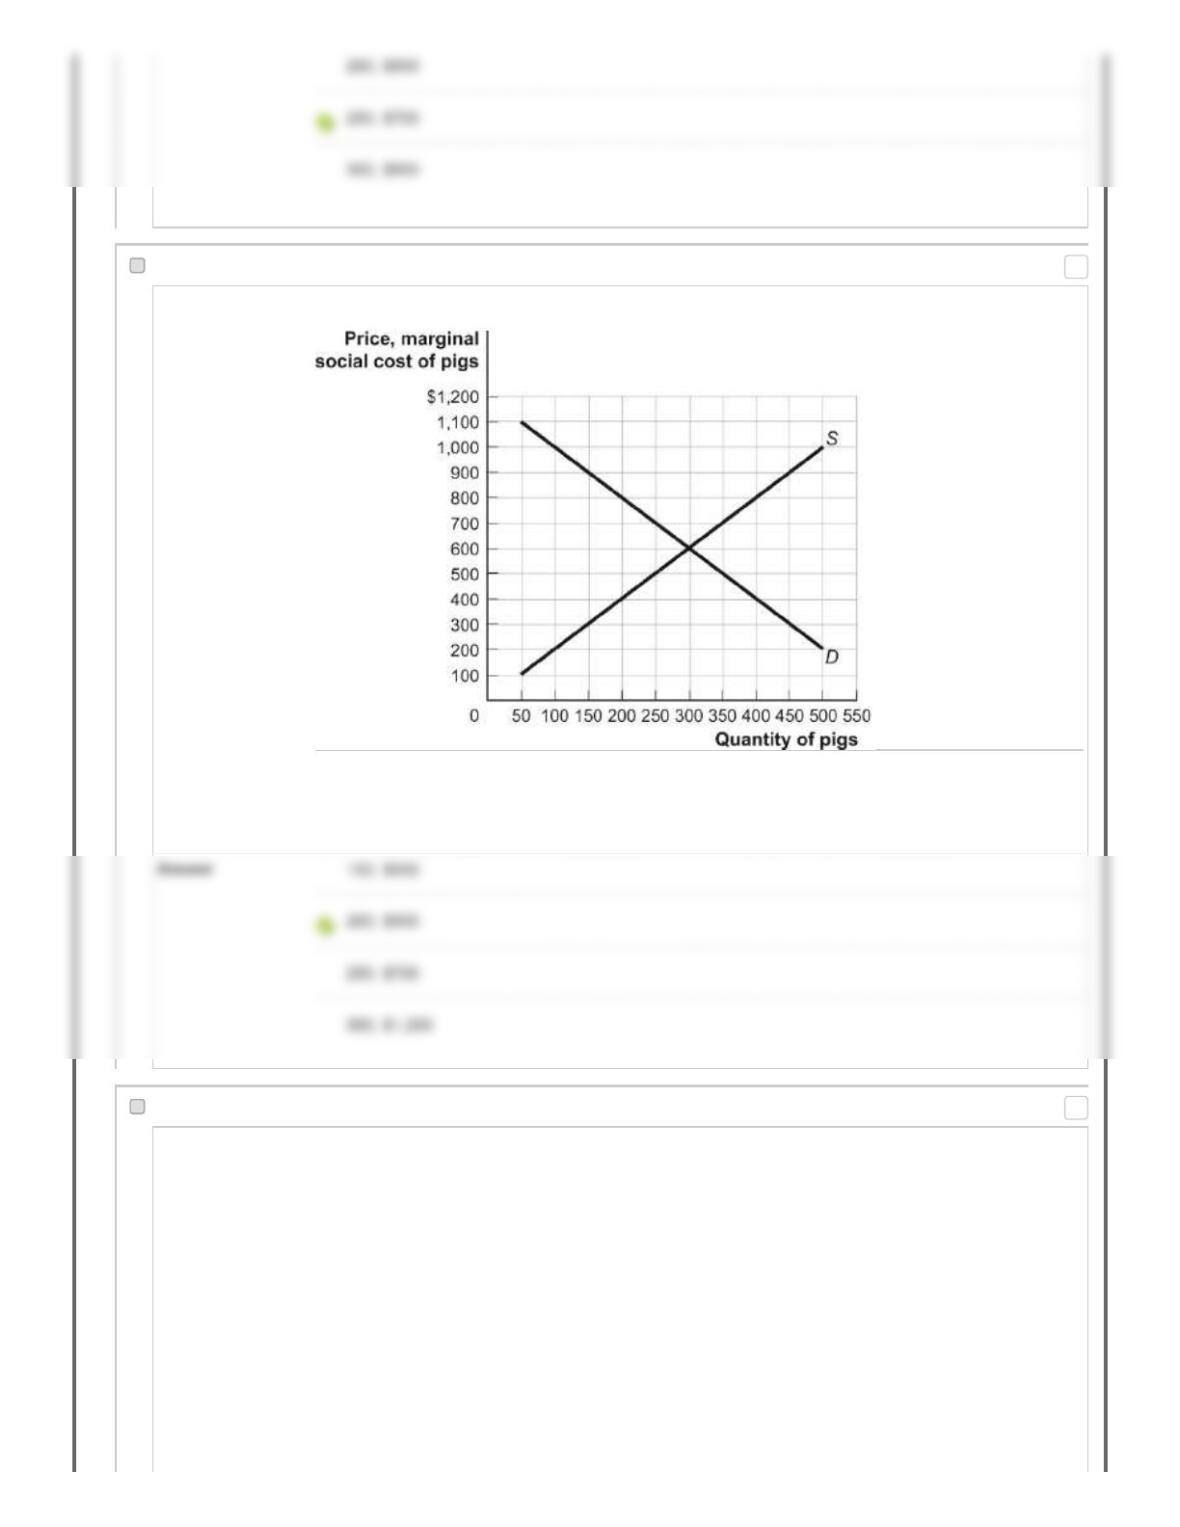
Question Figure: Negative Externalities and Raising Pigs for Pork
Reference: Ref 16-14
(Figure: Negative Externalities and Raising Pigs for Pork) Refer to the figure Negative Externalities and
Raising Pigs for Pork. If the marginal external cost of raising a pig for pork is $200, then the socially
optimal quantity of pigs to raise is ________ and the socially optimal price is ________.
Answer 150; $900
Points: 0
Points: 0
201. Multiple Choice: Figure: Negative Externalities and Ra…
Question Figure: Negative Externalities and Raising Pigs for Pork
Reference: Ref 16-14
(Figure: Negative Externalities and Raising Pigs for Pork) Refer to the figure Negative Externalities and
Raising Pigs for Pork. If the marginal external cost of raising a pig for pork is $400, then the socially
optimal quantity of pigs to raise is ________ and the socially optimal price is ________.
202. Multiple Choice: Figure: Negative Externalities and Ra…
Question
Points: 0
Points: 0
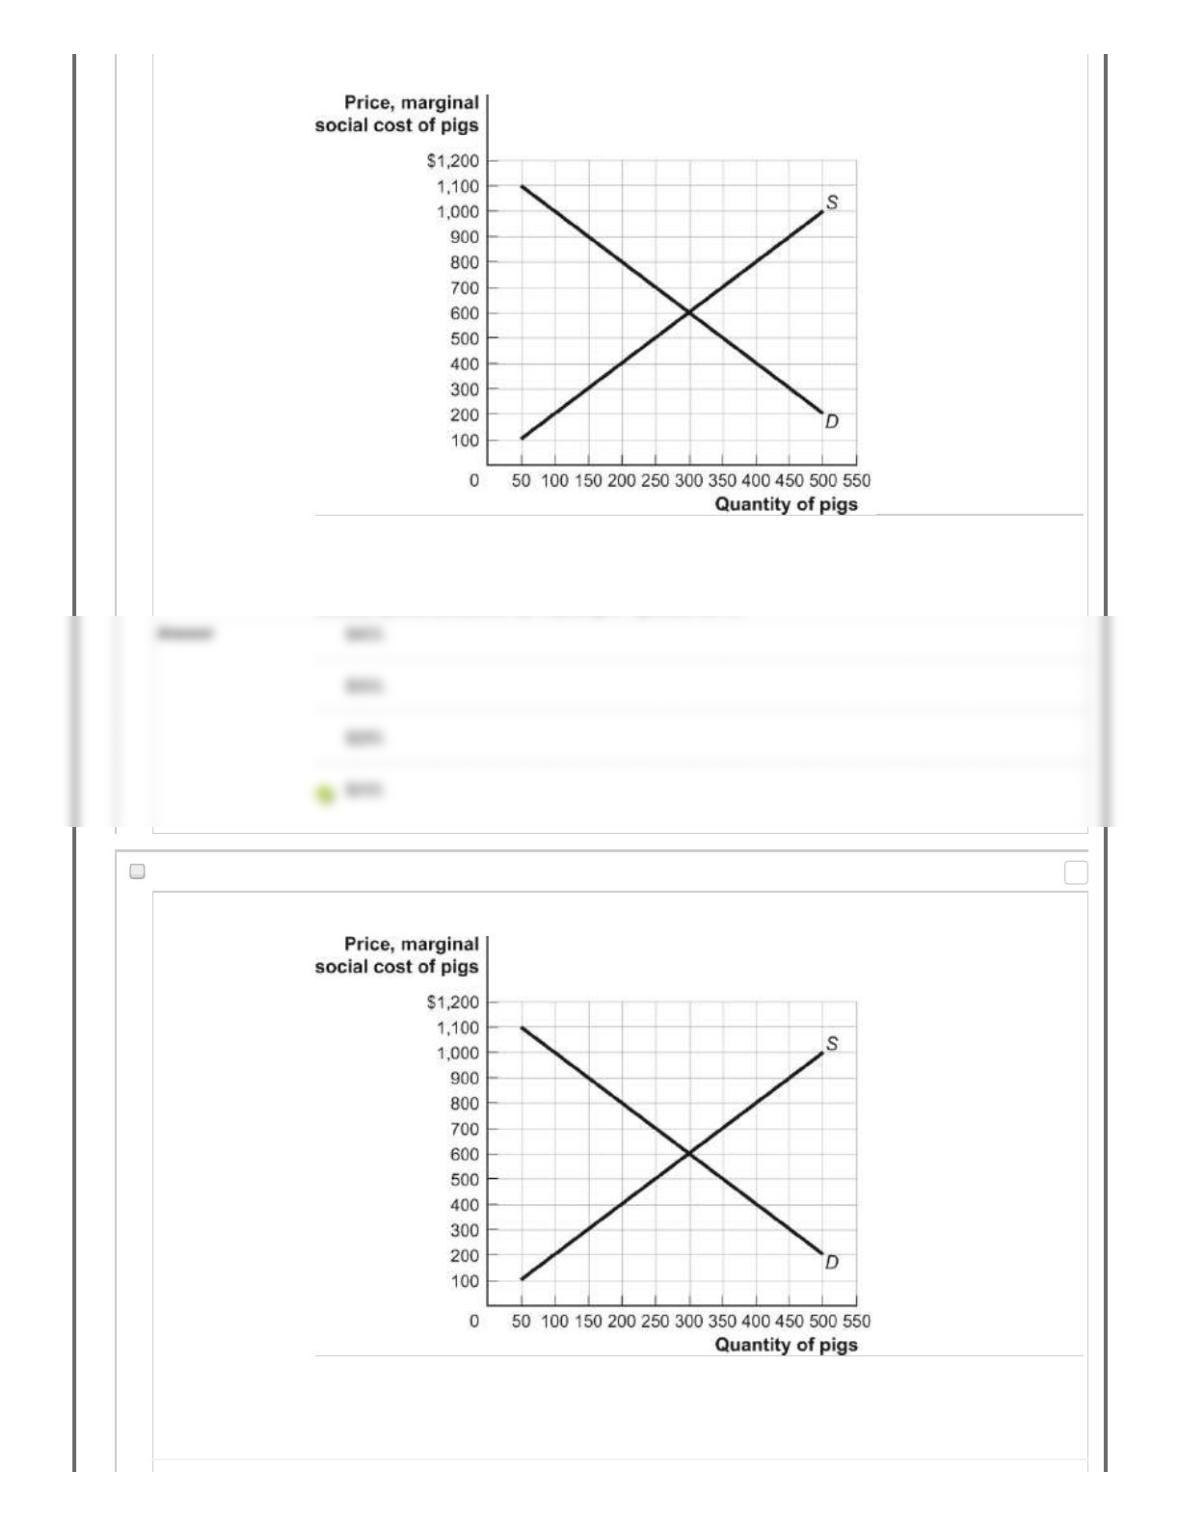
Figure: Negative Externalities and Raising Pigs for Pork
Reference: Ref 16-14
(Figure: Negative Externalities and Raising Pigs for Pork) Refer to the figure Negative Externalities and
Raising Pigs for Pork. If the socially optimal production of pigs is 250, the government could achieve this
socially optimal production by imposing a Pigouvian tax of:
203. Multiple Choice: Figure: Negative Externalities and Ra…
Question Figure: Negative Externalities and Raising Pigs for Pork
Reference: Ref 16-14
(Figure: Negative Externalities and Raising Pigs for Pork) Refer to the figure Negative Externalities and
Raising Pigs for Pork. If the socially optimal production of pigs is 200, the government could achieve the
socially optimal production by imposing a Pigouvian tax of:
Points: 0
204. Multiple Choice: Figure: Positive Externalities and th…
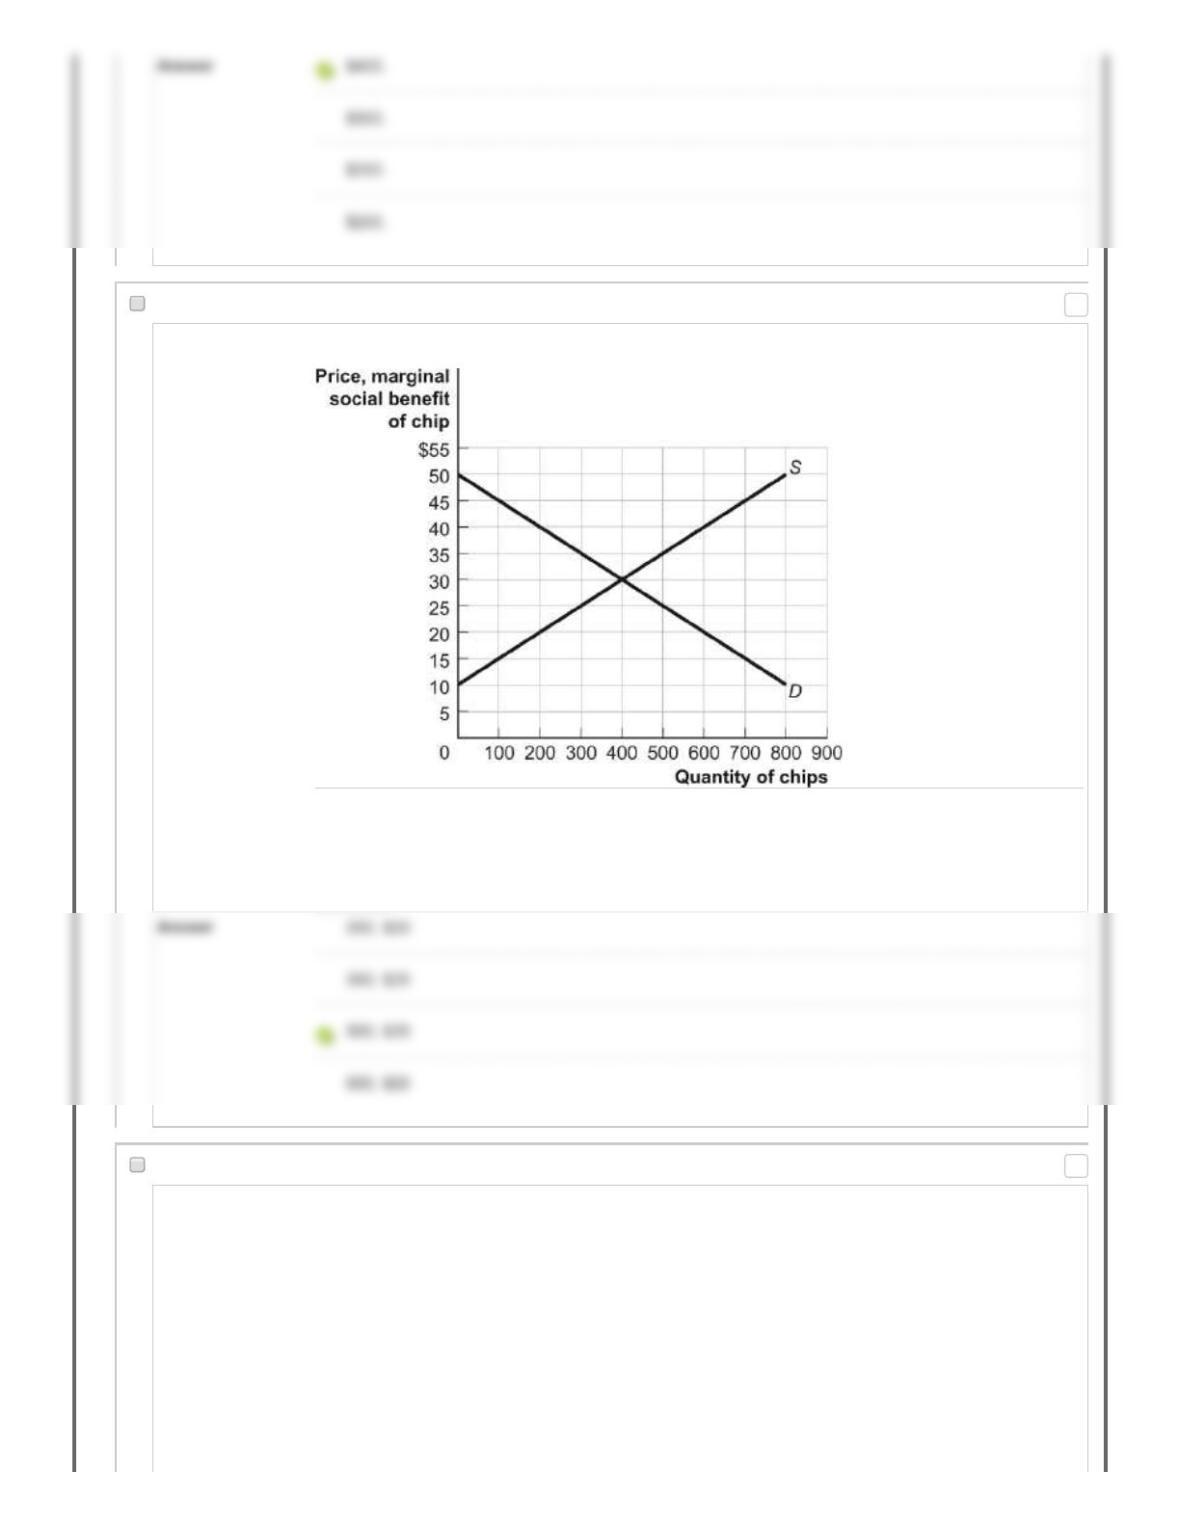
Question Figure: Positive Externalities and the Production of Semiconductor Chips
Reference: Ref 16-15
(Figure: Positive Externalities and the Production of Semiconductor Chips) Look at the figure Positive
Externalities and the Production of Semiconductor Chips. If the marginal external benefit of producing a
chip is $10, then the socially optimal quantity of chips is ________ and the socially optimal price is
________.
205. Multiple Choice: Figure: Positive Externalities and th…
Question
Points: 0
Points: 0
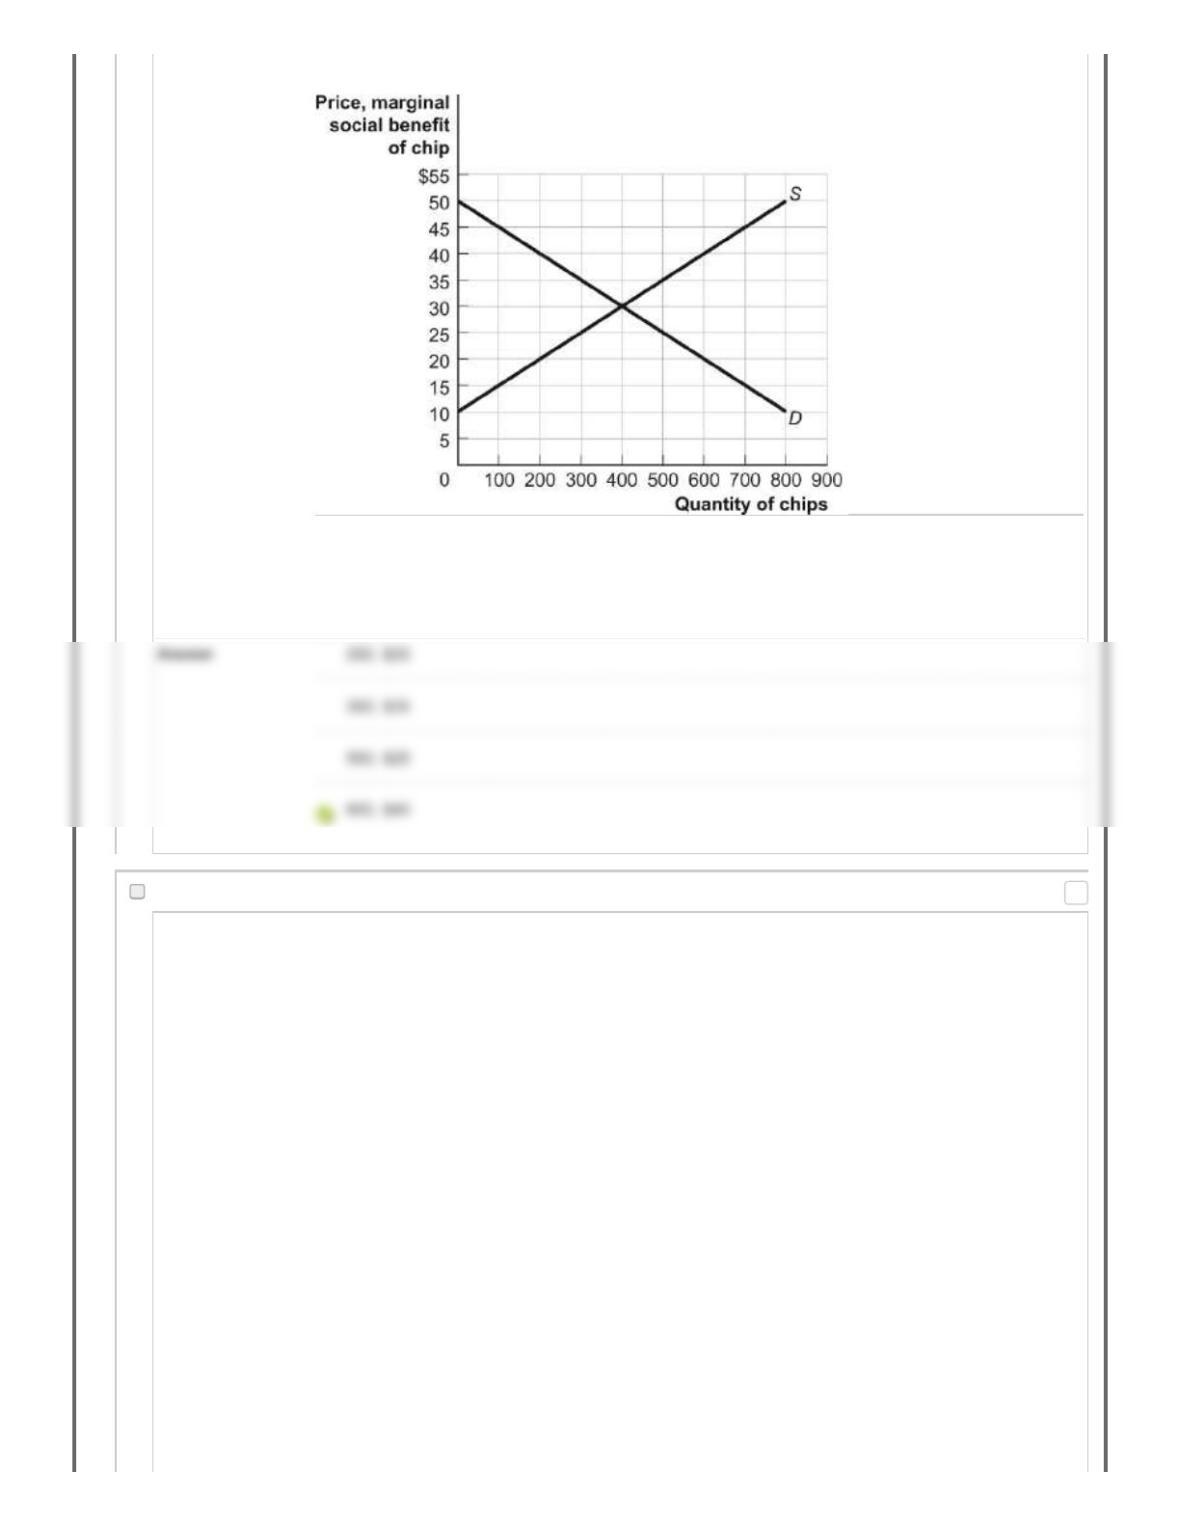
Figure: Positive Externalities and the Production of Semiconductor Chips
Reference: Ref 16-15
(Figure: Positive Externalities and the Production of Semiconductor Chips) Look at the figure Positive
Externalities and the Production of Semiconductor Chips. If the marginal external cost of producing a
chip is $20, then the socially optimal quantity of chips is ________ and the socially optimal price is
________.
206. Multiple Choice: Figure: Positive Externalities and th…
Question
Points: 0
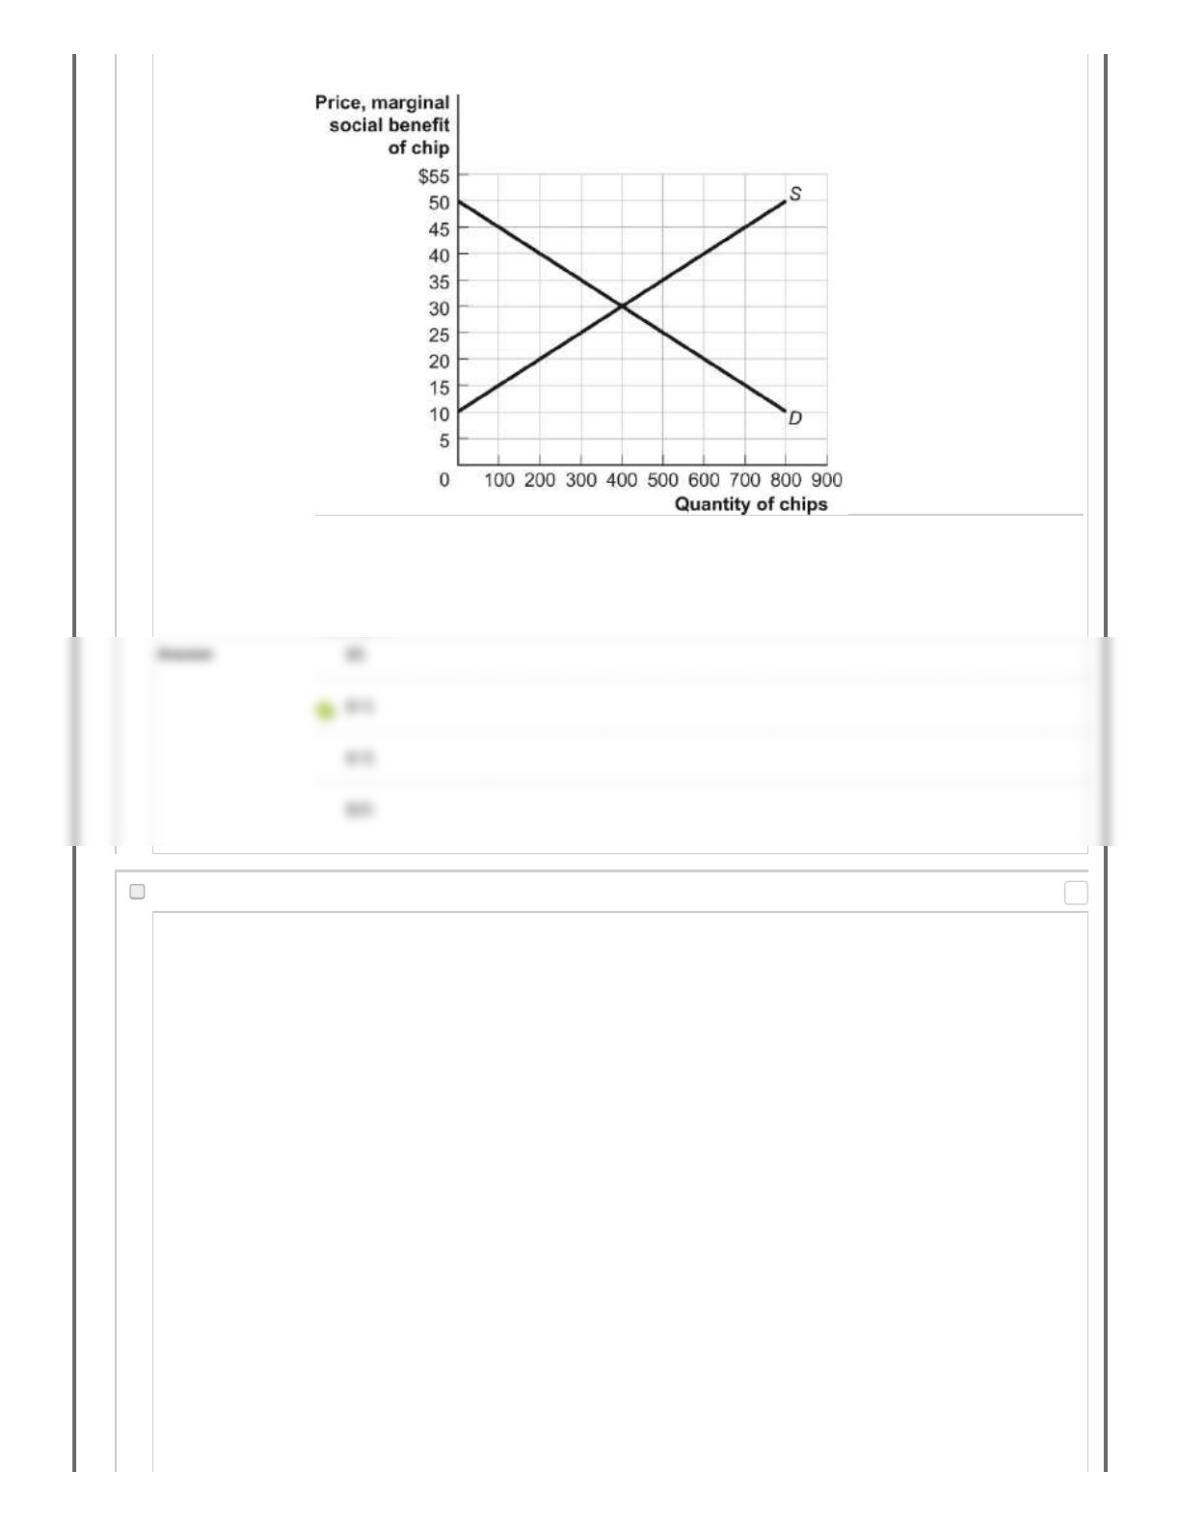
Figure: Positive Externalities and the Production of Semiconductor Chips
Reference: Ref 16-15
(Figure: Positive Externalities and the Production of Semiconductor Chips) Look at the figure Positive
Externalities and the Production of Semiconductor Chips. If the socially optimal production of chips is
500, the government could achieve the socially optimal level of production by granting a Pigouvian
subsidy of:
207. Multiple Choice: Figure: Positive Externalities and th…
Question
Points: 0