68. Refer to Figure 16–4. What price will the monopolistically competitive firm charge in this market?
a.
$400
b.
$600
c.
$700
d.
$800
69. Refer to Figure 16–4. At the profit-maximizing, or loss-minimizing, output level, the firm in this figure has total
revenue of approximately
a.
$12,000.
b.
$21,000.
c.
$24,000.
d.
$27,300.
70. Refer to Figure 16–4. Assume the firm in the figure is currently producing 20 units of output and charging $925. The
firm
a.
will increase its profits if it raises its price and reduces its production level.
b.
will increase its profits if it lowers its price and expands its production level.
c.
is maximizing profits.
d.
will increase its profits if it raises its prices and expands its production level.
71. Refer to Figure 16–4. The maximum total short-run economic profit for the monopolistically competitive firm in this
figure is
a.
-$3,000.
b.
$3,000.
c.
$9,000.
d.
$24,000.
72. Refer to Figure 16–4. Which of the following will occur in the long run in this industry?
a.
Firms will exit this industry.
b.
Firms will enter this industry.
c.
This firm will continue to earn positive economic profits.
d.
This firm will incur losses.
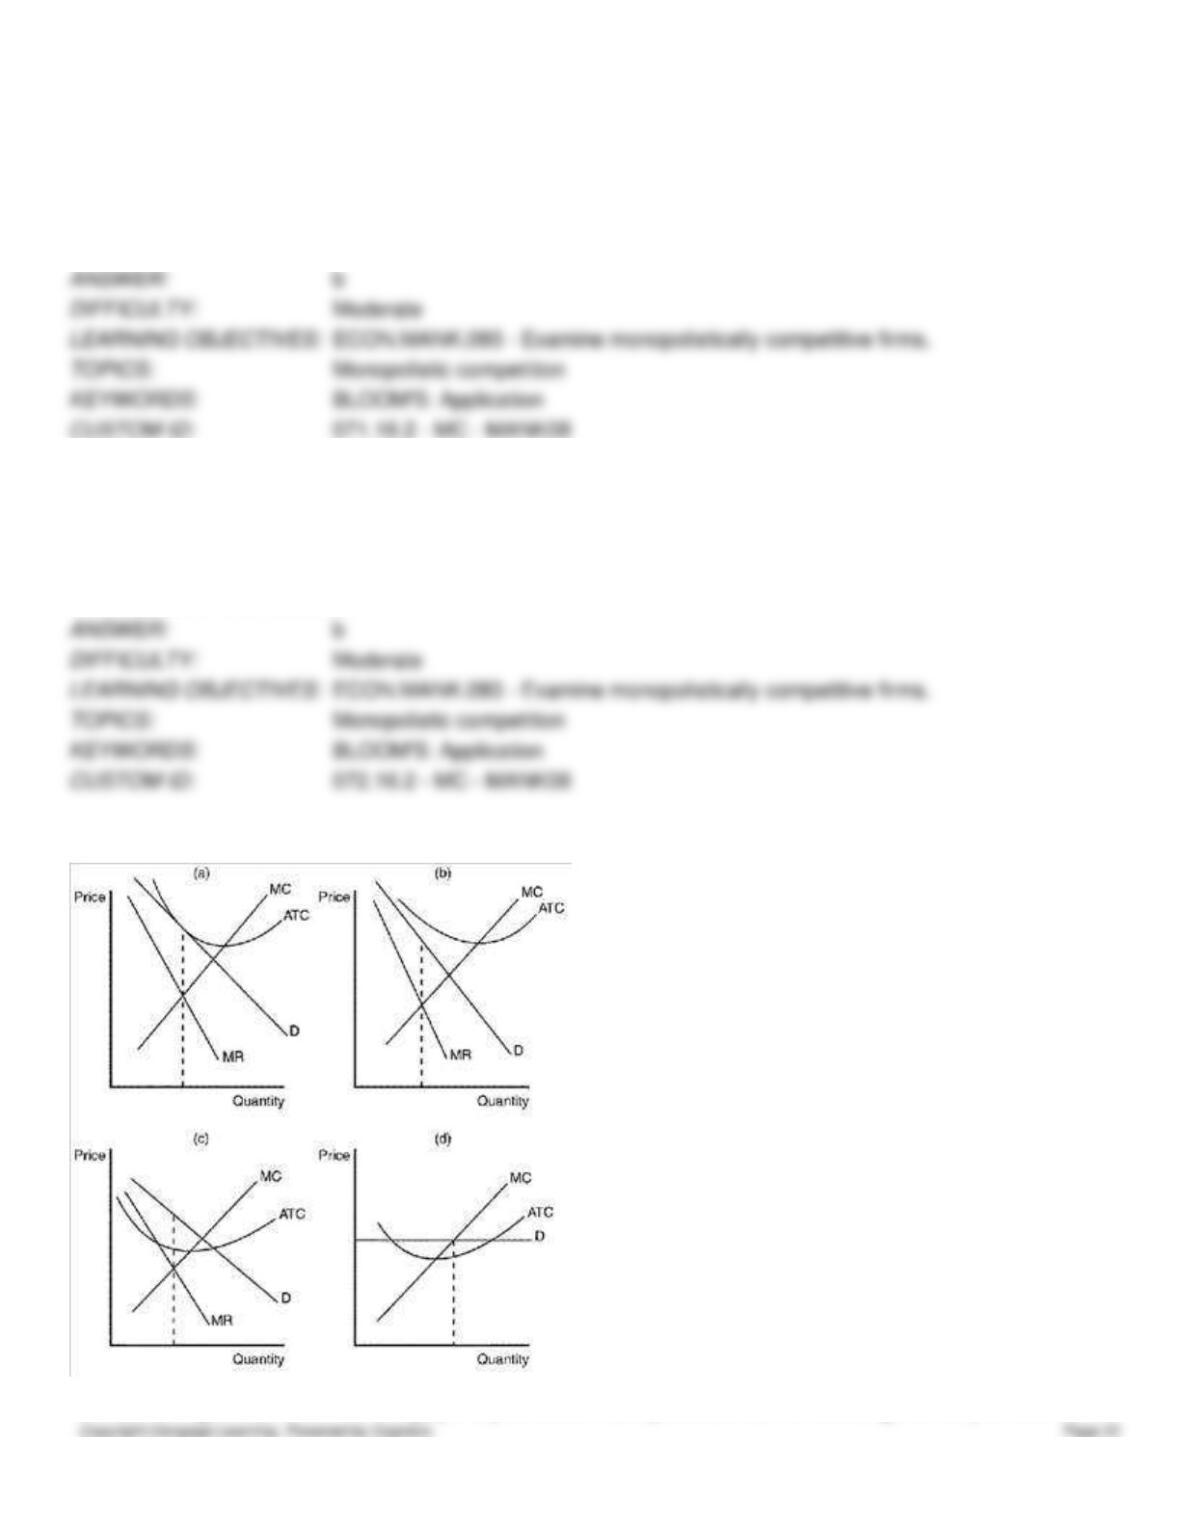
Figure 16-5
73. Refer to Figure 16–5. Which of the graphs depicts a short-run equilibrium that will encourage the entry of other firms
into a monopolistically competitive industry?
a.
panel a
b.
panel b
c.
panel c
d.
panel d
74. Refer to Figure 16–5. Which of the graphs depicts a short-run equilibrium that will encourage the exit of some firms
from a monopolistically competitive industry?
a.
panel a
b.
panel b
c.
panel c
d.
panel d
75. Refer to Figure 16–5. Which of the graphs depicts a short-run equilibrium that will not encourage either the entry or
exit of firms in a monopolistically competitive industry?
a.
panel a
b.
panel b
c.
panel c
d.
panel d
76. Refer to Figure 16-5. Panel a shows a profit-maximizing monopolistically competitive firm that is
a.
earning zero economic profit.
b.
likely to exit the market in the long run.
c.
producing its efficient scale of output.
d.
not maximizing its profit.
77. Refer to Figure 16-5. Which of the panels depicts a firm in a monopolistically competitive market earning positive
economic profits?
a.
panel a
b.
panel b
c.
panel c
d.
panel d
78. Refer to Figure 16-5. Panel b is consistent with a firm in a monopolistically competitive market that is
a.
not in long-run equilibrium.
b.
in long-run equilibrium.
c.
producing its efficient scale of output.
d.
earning a positive economic profit.
79. Refer to Figure 16-5. Which of the panels shown could illustrate the short-run situation for a monopolistically
competitive firm?
a.
panel a
b.
panel b
c.
panel c
d.
All of the above are correct.
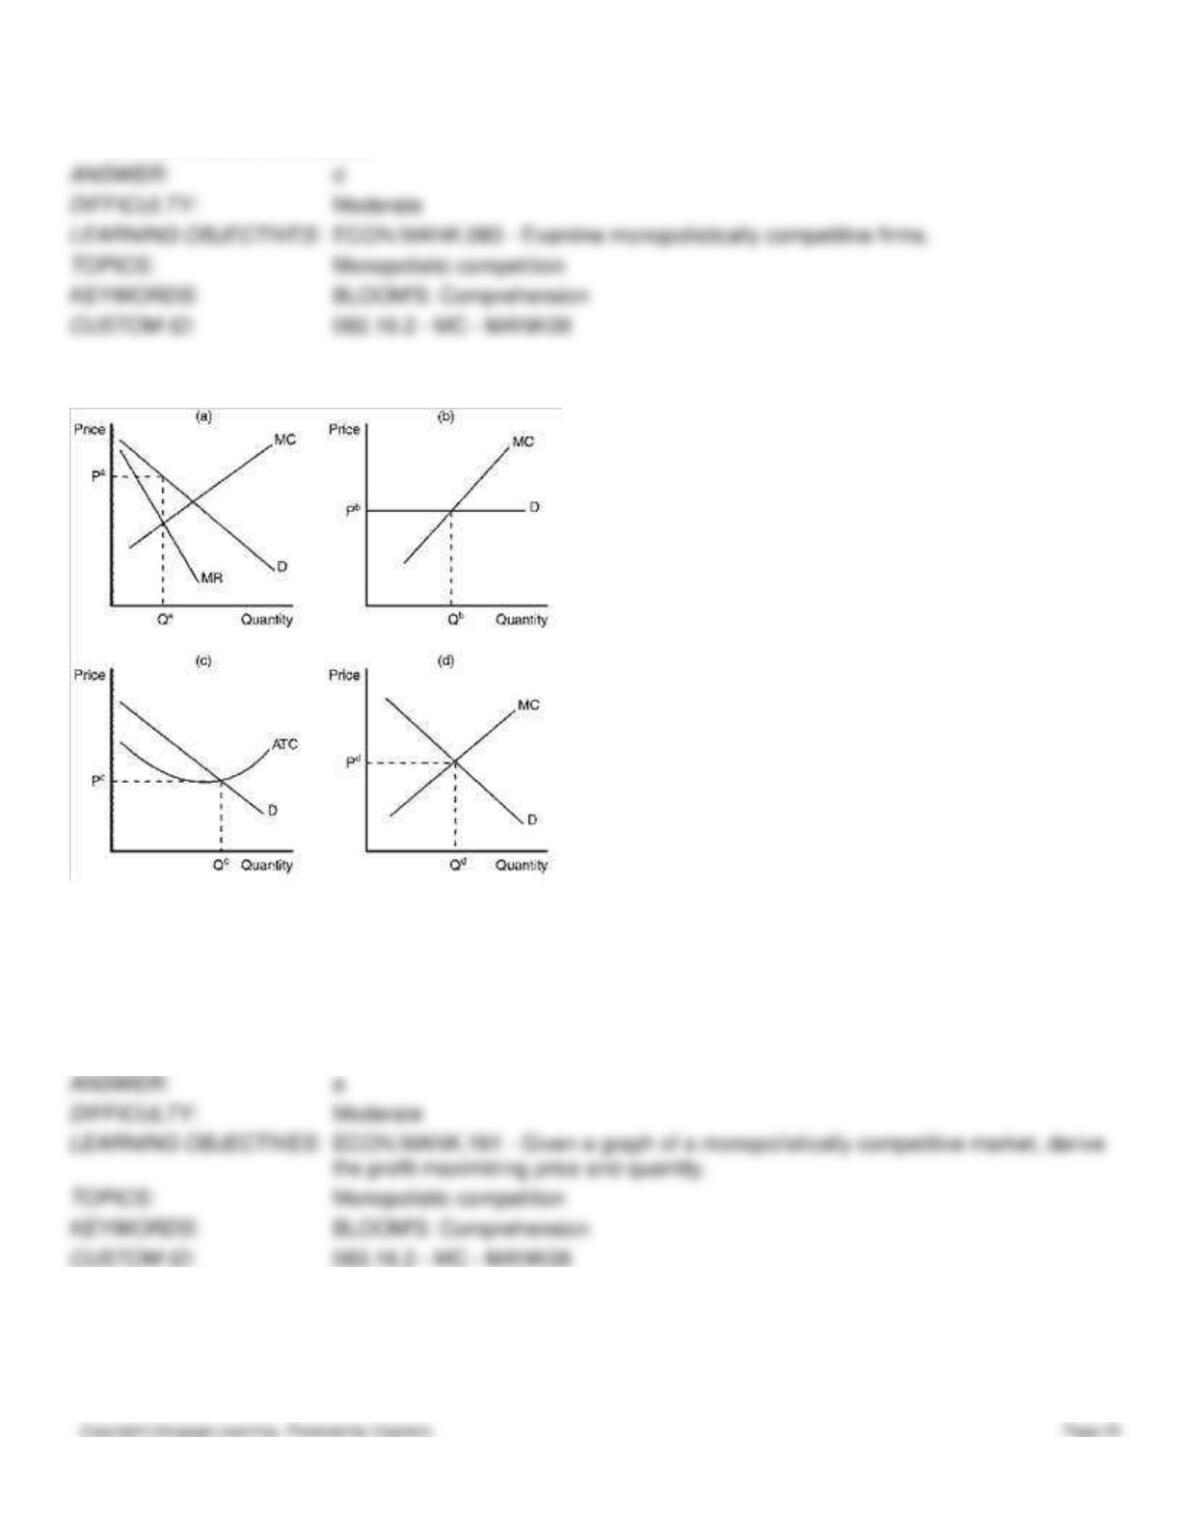
Figure 16-6
80. Refer to Figure 16-6. Which of the graphs shown would be consistent with a profit maximizing firm in a
monopolistically competitive market that is earning a positive profit?
a.
panel a
b.
panel b
c.
panel c
d.
panel d
81. Refer to Figure 16-6. Which of the graphs shown would be consistent with a firm in a monopolistically competitive
market that is doing its best but still losing money?
a.
panel a
b.
panel b
c.
panel c
d.
panel d
82. Refer to Figure 16-6. Which of the graphs depicts a monopolistically competitive firm in long-run equilibrium?
a.
panel a
b.
panel b
c.
panel c
d.
None of the above is correct.
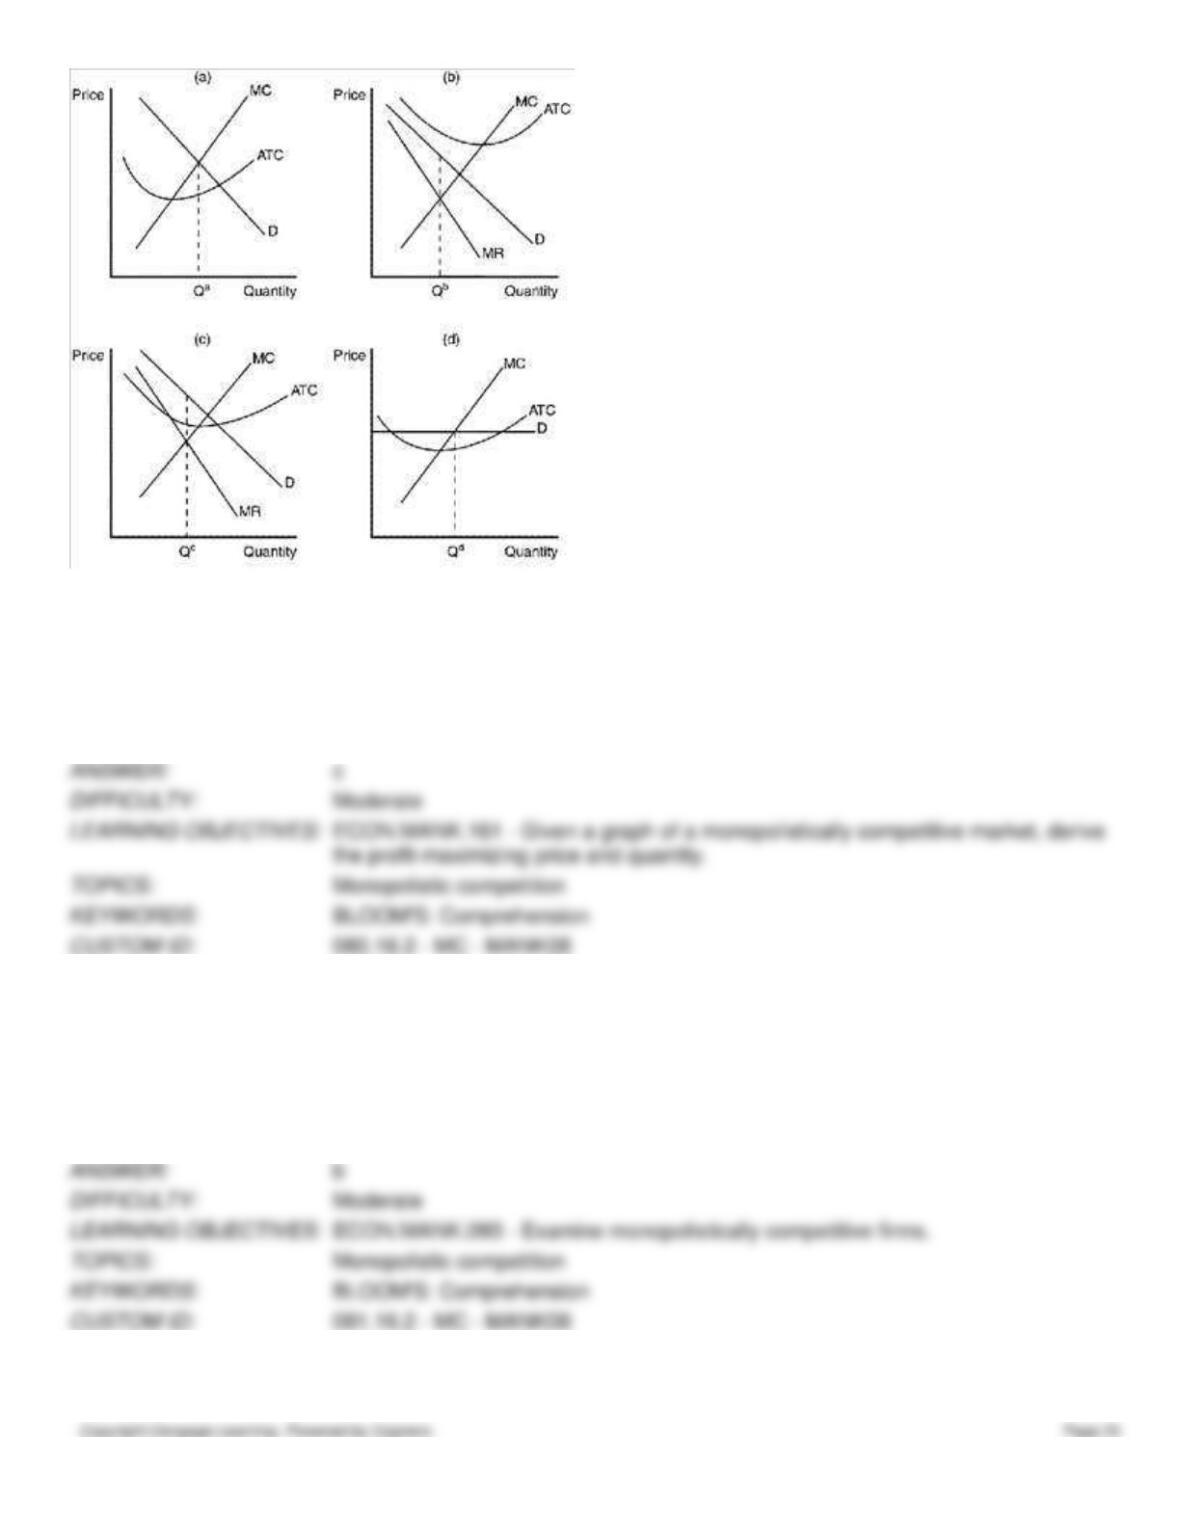
Figure 16-7
83. Refer to Figure 16-7. Which of the graphs depicts the situation for a profit-maximizing firm in a monopolistically
competitive market?
a.
panel a
b.
panel b
c.
panel c
d.
panel d
84. Refer to Figure 16-7. Suppose a firm is operating in the situation depicted in panel a. Which of the following
statements is correct?
a.
The firm is earning a positive short-run profit.
b.
The firm is earning a negative short-run profit.
c.
The firm is earning zero short-run profit.
d.
We cannot determine profit because we do not know the firm’s average total cost.
85. Refer to Figure 16-7. If a firm in a monopolistically competitive market was producing the level of output depicted as
Qd in panel (d), it would
a.
not be maximizing its profit.
b.
be minimizing its losses.
c.
be losing market share to other firms in the market.
d.
be operating at excess capacity.
86. Refer to Figure 16-7. The firm depicted in panel b faces a horizontal demand curve. If panel b depicts a profit–
maximizing firm,
a.
it could be operating in either a perfectly competitive market or in a monopolistically competitive market.
b.
it would not have excess capacity in its production as long as it is earning zero economic profit.
c.
it is able to choose the price at which it sells its product.
d.
the firm can always raise its profit by increasing production since consumers will buy as much as the firm can
produce.
Figure 16-8
The lines in the figures below illustrate the potential effect of entry and exit in a monopolistically competitive market on
either the demand curve or the marginal cost curve of existing firms.
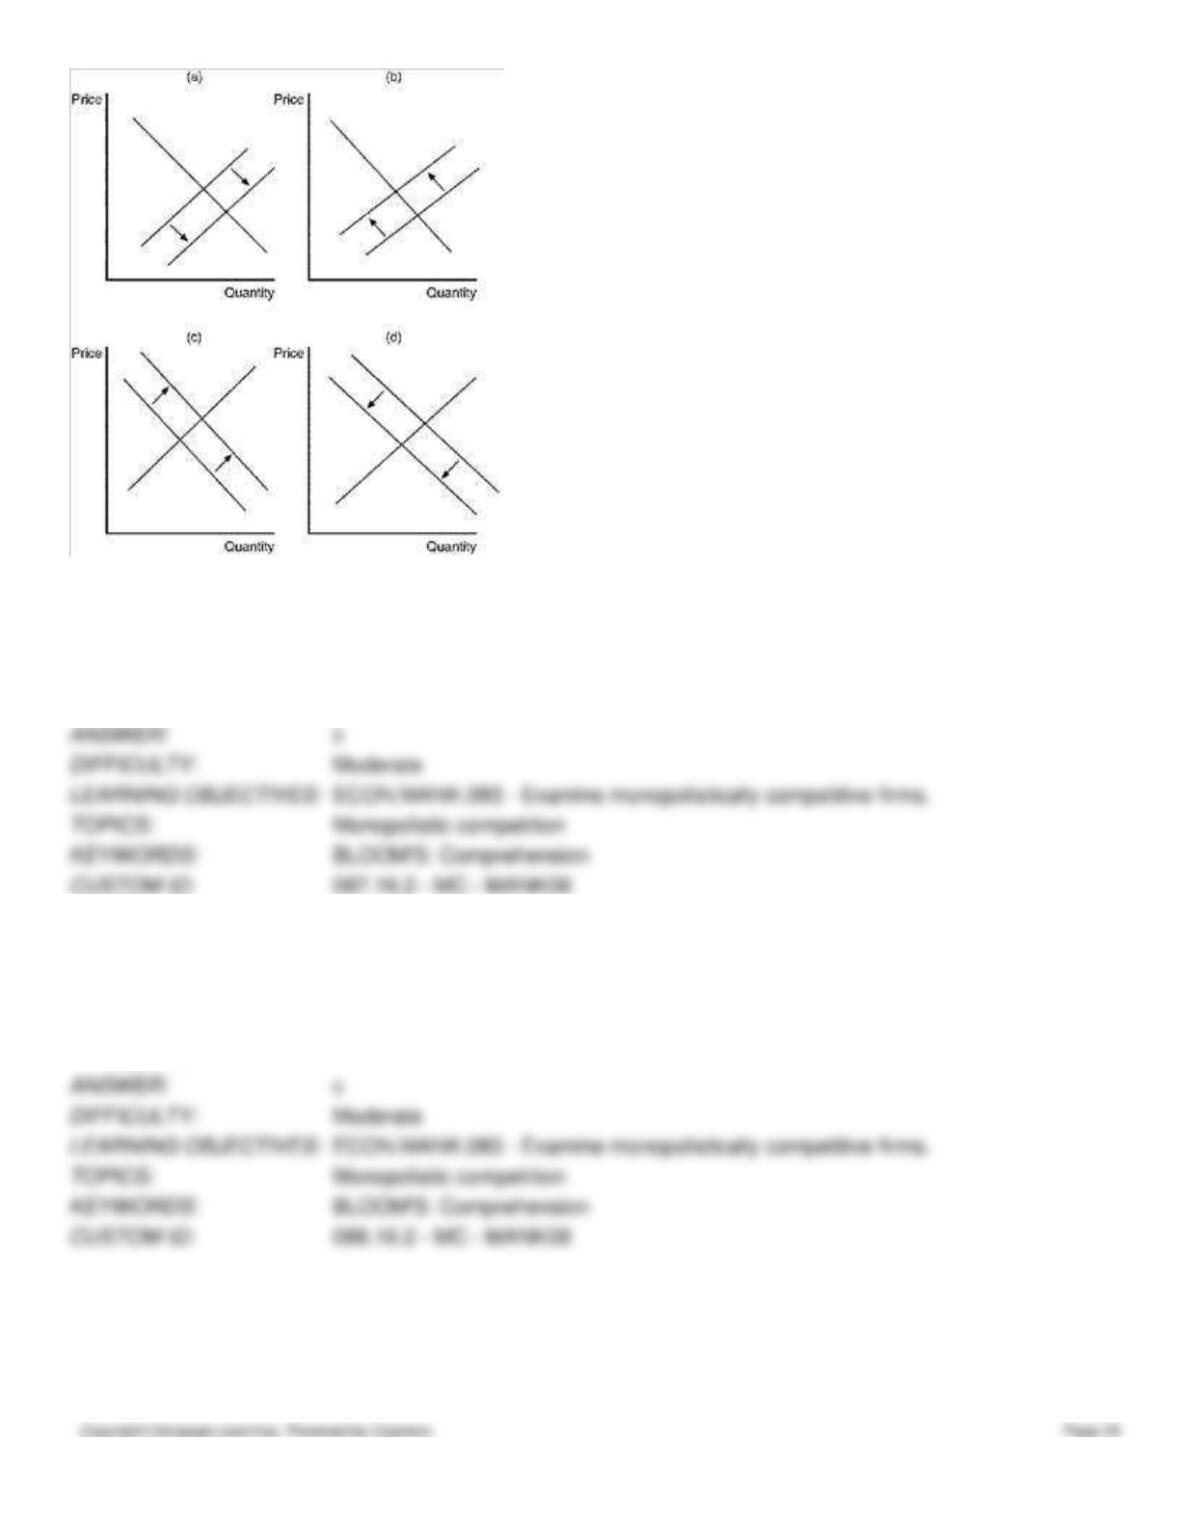
87. Refer to Figure 16-8. Panel (d) illustrates the change that would occur if existing firms faced
a.
long-run economic losses.
b.
a decrease in the diversity of products offered in the market.
c.
new entrants in the market.
d.
firms exiting the market.
88. Refer to Figure 16-8. Which of the diagrams illustrates the impact of some existing firms leaving the market?
a.
panel a
b.
panel b
c.
panel c
d.
panel d
Figure 16-9
The figure is drawn for a monopolistically-competitive firm.
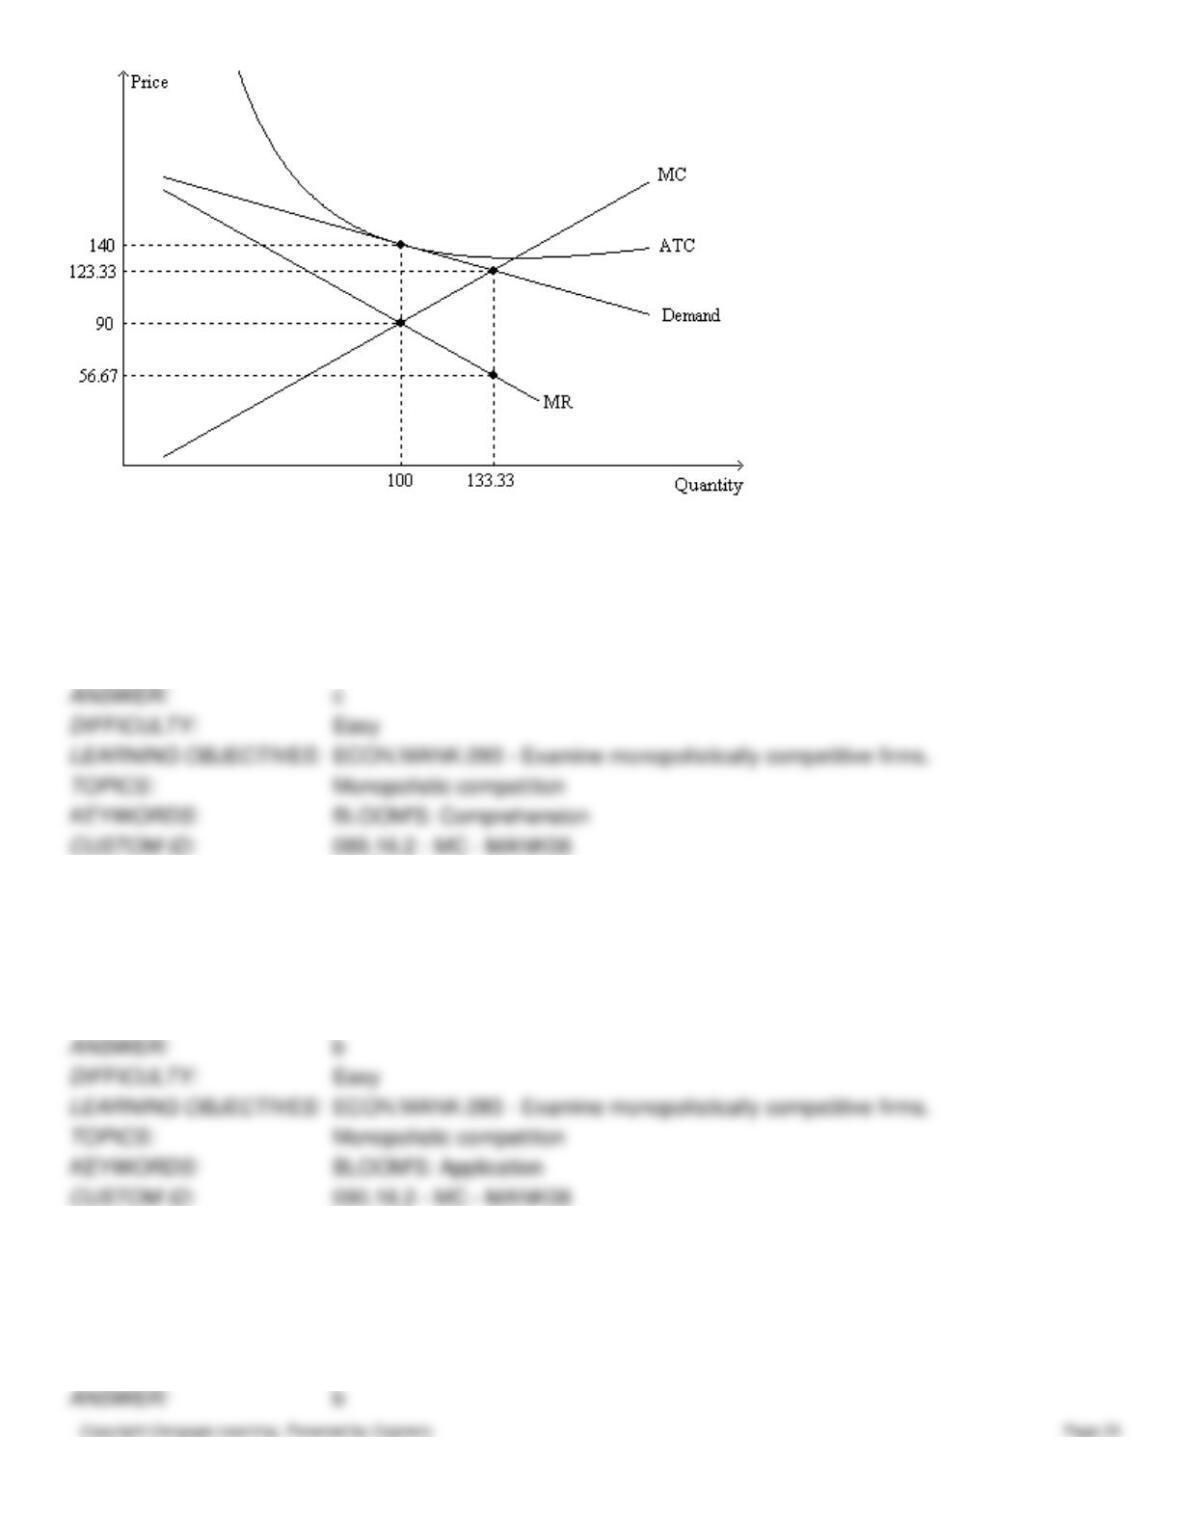
89. Refer to Figure 16–9. As the figure is drawn, the firm is in
a.
a short-run equilibrium but it is not in a long-run equilibrium.
b.
a long-run equilibrium but it is not in a short-run equilibrium.
c.
a short-run equilibrium as well as a long-run equilibrium.
d.
neither a short-run equilibrium nor a long-run equilibrium.
90. Refer to Figure 16–9. In order to maximize its profit, the firm will choose to produce
a.
less than 100 units of output.
b.
100 units of output.
c.
between 100 and 133.33 units of output.
d.
more than 133.33 units of output.
91. Refer to Figure 16–9. In order to maximize its profit, the firm will choose to produce
a.
100 units of output, and its profit will be positive.
b.
100 units of output, and its profit will be zero.
c.
133.33 units of output, and its profit will be negative.
d.
133.33 units of output, and its profit will be zero.
92. Refer to Figure 16–9. When the firm is maximizing its profit, the markup over marginal cost amounts to
a.
$16.67.
b.
$33.33.
c.
$50.00.
d.
$66.66.
93. Refer to Figure 16–9. The firm’s maximum profit is
a.
$-5,000.00.
b.
$0.
c.
$5,000.00.
d.
$8,887.78.
94. Refer to Figure 16–9. Efficient scale is reached
a.
at 100 units.
b.
between 100 and 133.33 units.
c.
at 133.33 units.
d.
beyond 133.33 units.
95. Refer to Figure 16–9. The quantity of output at which the MC and ATC curves cross is the
a.
efficient scale of the firm.
b.
short-run equilibrium quantity of output for the firm.
c.
long-run equilibrium quantity of output for the firm.
d.
All of the above are correct.
96. Refer to Figure 16–9. For this firm, the long-run equilibrium quantity of output is
a.
100 and the long-run equilibrium price is $90.
b.
100 and the long-run equilibrium price is $140.
c.
133.33 and the long-run equilibrium price is $56.67.
d.
133.33 and the long-run equilibrium price is $123.33.
97. Refer to Figure 16–9. Given this firm’s cost curves, if the firm were perfectly competitive rather than
monopolistically competitive, then in a long-run equilibrium it would produce
a.
less than 100 units of output.
b.
between 100 and 133.33 units of output.
c.
133.33 units of output.
d.
more than 133.33 units of output.
98. Refer to Figure 16–9. In response to the situation represented by the figure, we would expect
a.
new firms to enter the market.
b.
some of the firms that are currently in the market to exit.
c.
this firm’s profit to move from its current value toward a positive value.
d.
None of the above are correct.
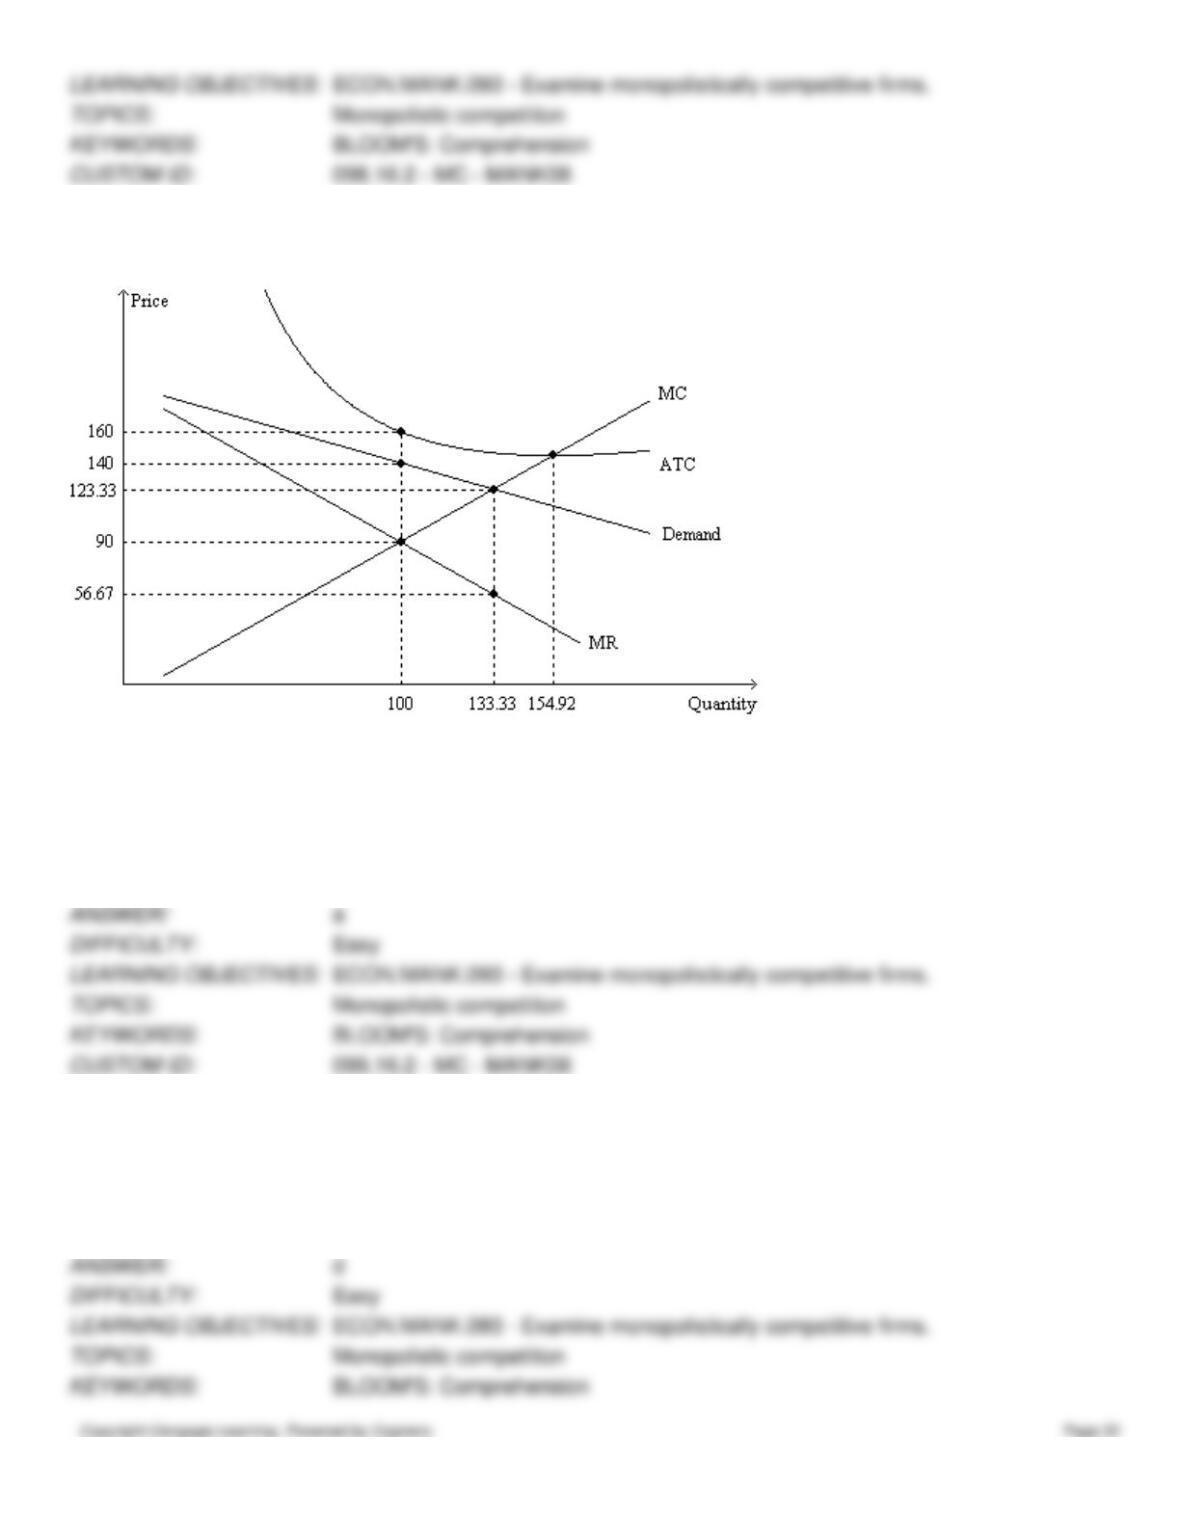
Figure 16–10
The figure is drawn for a monopolistically-competitive firm.
99. Refer to Figure 16-10. As the figure is drawn, the firm is in
a.
a short-run equilibrium but it is not in a long-run equilibrium.
b.
a long-run equilibrium but it is not in a short-run equilibrium.
c.
a short-run equilibrium as well as a long-run equilibrium.
d.
neither a short-run equilibrium nor a long-run equilibrium.
100. Refer to Figure 16-10. In response to the situation represented by the figure, we would expect
a.
some of the firms that are currently in the market to exit.
b.
the demand for this firm’s product to increase, assuming this firm does not exit.
c.
this firm’s profit to move from its current value toward zero.
d.
All of the above are correct.
101. Refer to Figure 16-10. In order to maximize its profit, the firm will choose to produce
a.
100 units of output.
b.
between 100 and 133.33 units of output.
c.
133.33 units of output.
d.
154.92 units of output.
102. Refer to Figure 16-10. In order to maximize its profit, the firm will choose to produce
a.
100 units of output, and its profit will be negative.
b.
100 units of output, and its profit will be zero.
c.
133.33 units of output, and its profit will be negative.
d.
133.33 units of output, and its profit will be zero.
103. Refer to Figure 16-10. The firm’s maximum profit is
a.
$-7,000.
b.
$-5,000.
c.
$-2,000.
d.
The firm’s maximum profit cannot be determined from the figure.
104. Refer to Figure 16-10. When the firm is maximizing its profit,
a.
TR = $9,000 and TC =$16,000.
b.
TR = $14,000 and TC =$16,000.
c.
TR = $16,000 and TC =$16,000.
d.
MC exceeds MR by $66.66 on the last unit of output produced.
105. Refer to Figure 16-10. At what quantity of output does average revenue exceed marginal revenue by $66.66?
a.
at 100 units of output
b.
somewhere between 100 and 133.33 units of output
c.
at 133.33 units of output
d.
at 154.92 units of output
106. Refer to Figure 16-10. Efficient scale is reached
a.
at 100 units.
b.
at 133.33 units.
c.
between 133.33 units and 154.92 units.
d.
at 154.92 units.
107. Refer to Figure 16-10. If the firm were to produce 154.92 units of output,
a.
efficient scale would be realized.
b.
ATC would be at its minimum value.
c.
the firm would sustain a loss of more than $2,000.
d.
All of the above are correct.
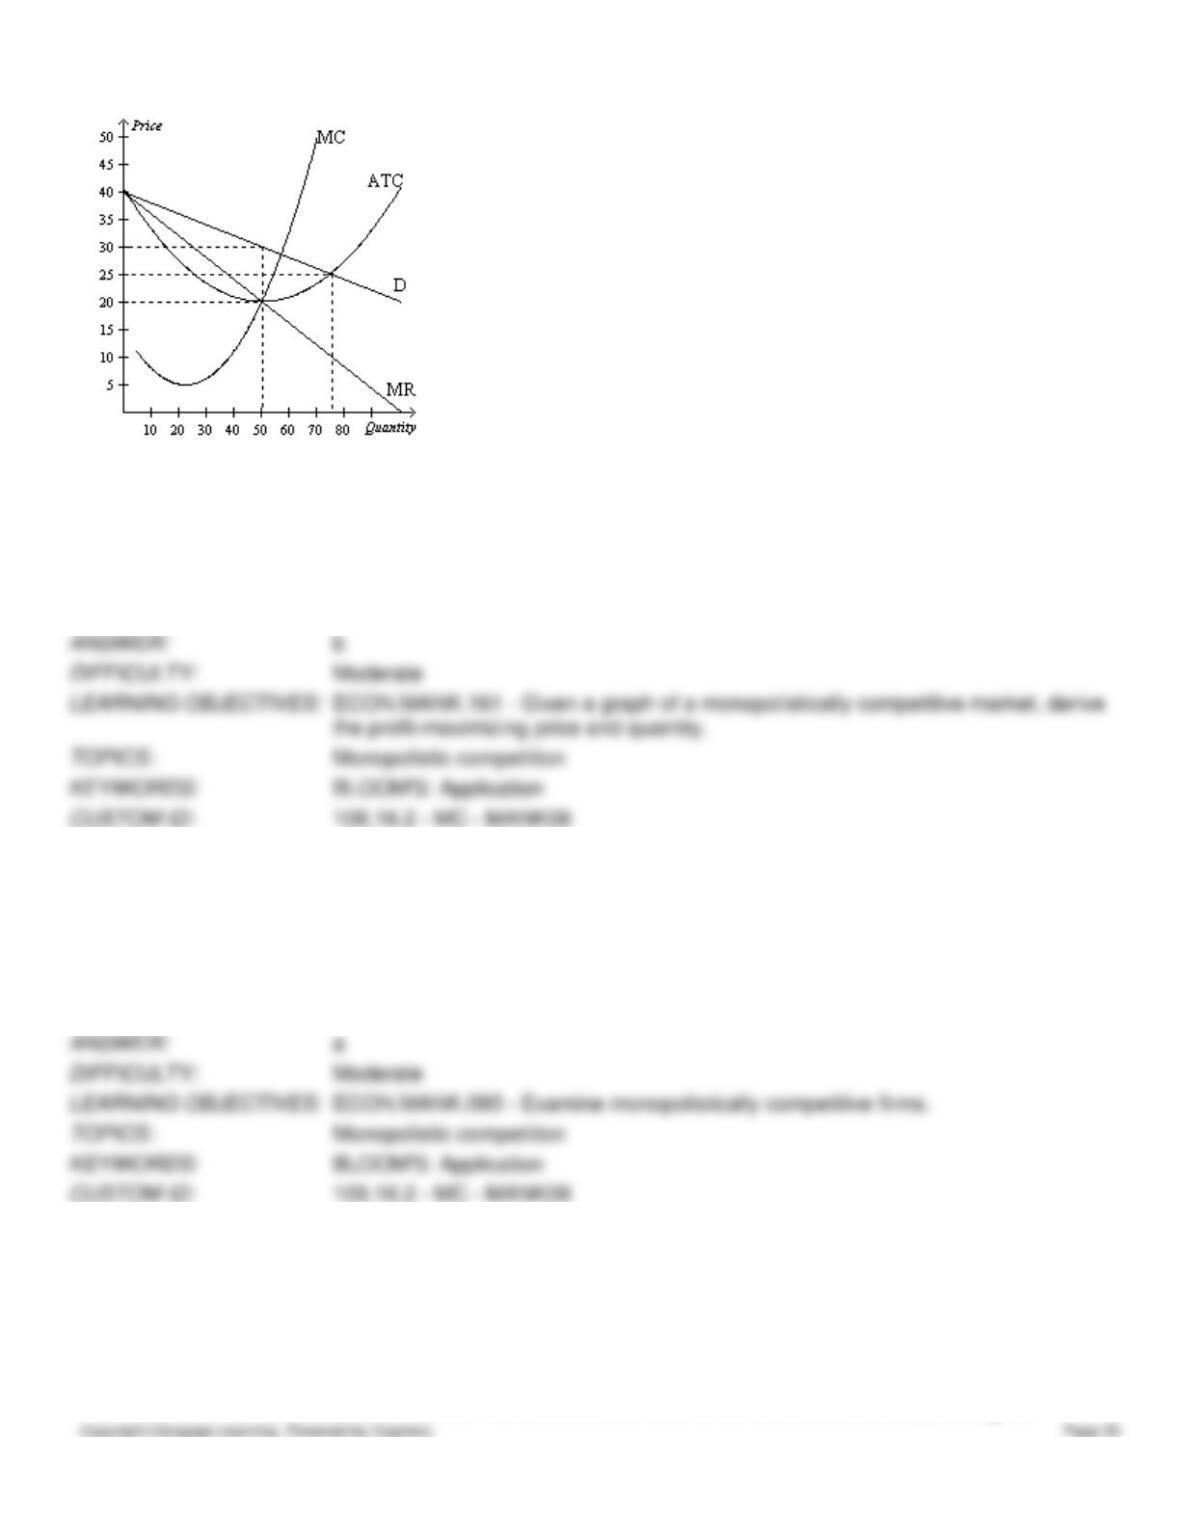
Figure 16–11
108. Refer to Figure 16-11. The profit for this firm is
a.
$375.
b.
$500.
c.
$1000.
d.
$1250.
109. Refer to Figure 16-11. How much consumer surplus will be derived from the purchase of this product at the
monopolistically competitive price?
a.
$250.
b.
$500
c.
$562.50.
d.
$1250.
110. Refer to Figure 16-11. The graph depicts a monopolistically competitive firm in the short run. Which of the
following explanations best describes the long run adjustment?
a.
More firms will enter this market and each firm will have a smaller share of the total market demand, shifting
this firm’s demand curve to the left.
b.
More firms will enter this market and each firm will have a larger share of the total market demand, shifting
this firm’s demand to the right.
c.
Firms will exit this market and each firm will have a smaller share of the total market demand, shifting this
firm’s demand to the left.
d.
Firms will exit this market and each firm will have a larger share of the total market demand, shifting this
firm’s demand to the right.
Figure 16–12
111. Refer to Figure 16-12. What is the efficient scale of production?
a.
This firm cannot produce efficiently.
b.
12 units
c.
22 units
d.
28 units
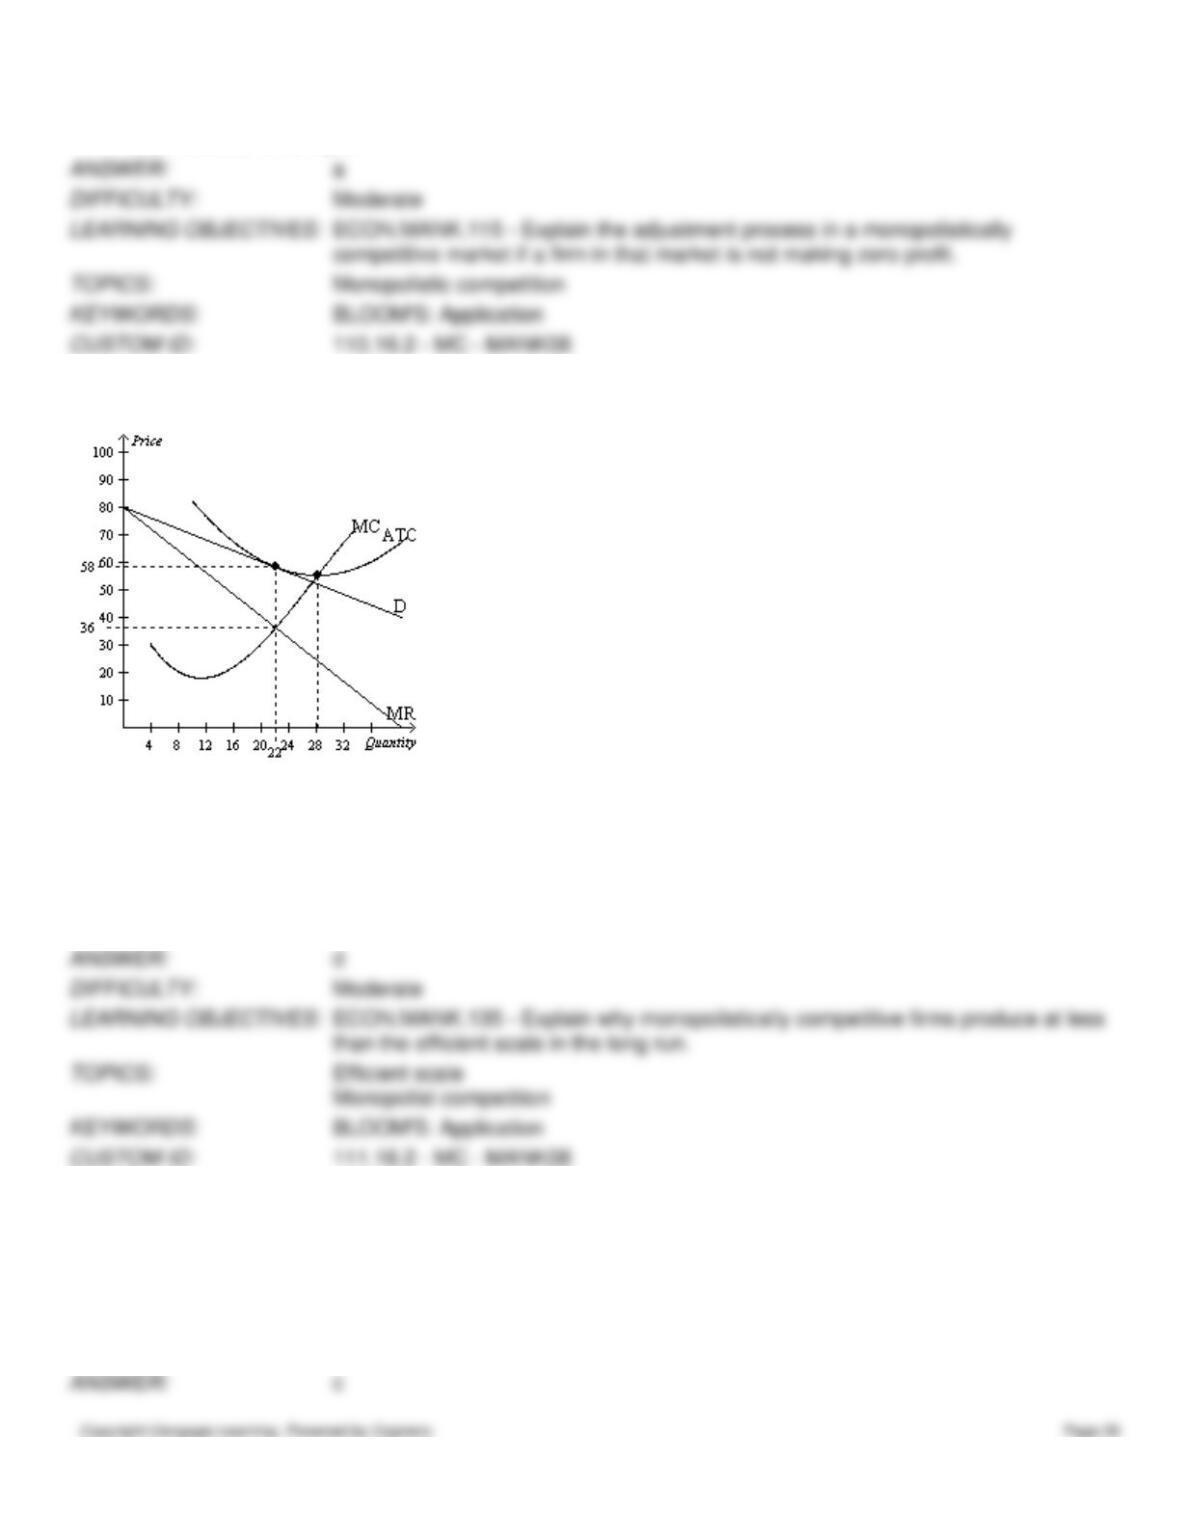
112. Refer to Figure 16-12. How much cost per unit could this firm save by producing the efficient level of output rather
than the profit-maximizing level of output?
a.
$0
b.
$1
c.
$2
d.
$3
Table 16-4
This table shows the demand schedule, marginal cost, and average total cost for a monopolistically competitive firm.
Quantity
Price
Marginal Cost
Average Total Cost
0
$50
—
—
1
$45
$30
$40
2
$40
$24
$32
3
$35
$14
$26
4
$30
$10
$22
5
$25
$12
$20
6
$20
$32
$22
7
$15
$50
$26
8
$10
$74
$32
9
$5
$104
$40
10
$0
$140
$50
113. Refer to Table 16–4. What price will this firm charge to maximize profit?
a.
$25
b.
$30
c.
$35
d.
$40
114. Refer to Table 16–4. What is this firm’s profit-maximizing level of output?
a.
0 units of output
b.
3 units of output
c.
4 units of output
d.
5 units of output
115. Refer to Table 16–4. At the profit-maximizing level of output, what is this firm’s total cost?
a.
$10
b.
$40
c.
$88
d.
$100
116. Refer to Table 16–4. Which of the following is likely to happen in the long run in this market?
a.
The market is currently in a long-run equilibrium.
b.
The market price is likely to rise.
c.
Firms are likely to enter the market since firms are earning a positive economic profit.
d.
Firms are likely to leave the market since firms are earning a negative economic profit.
117. Refer to Table 16–4. How much profit will this firm earn when it chooses its output to maximize profit?
a.
a $12 loss
b.
an $8 profit
c.
a $25 profit
d.
a $32 profit
118. Refer to Table 16–4. If the government forces this firm to produce at its efficient output level, how much output will
this firm produce?
a.
0 units of output
b.
3 units of output
c.
4 units of output
d.
5 units of output
119. Refer to Table 16–4. If the government forces this firm to produce at its efficient output level, how much profit will
this firm earn?
a.
a $12 loss
b.
a $13 profit
c.
a $25 profit
d.
a $32 profit
Table 16-5
This table shows the demand schedule, marginal cost, and average total cost for a monopolistically competitive firm.
Quantity
Price
Marginal
Cost
Average
Total Cost
0
$30
—
—
1
$24
$2
$32
2
$18
$4
$18
3
$12
$6
$14
4
$6
$8
$10
5
$0
$10
$10
120. Refer to Table 16–5. What price should this firm charge to maximize profit?
a.
$6
b.
$12
c.
$18
d.
$24
121. Refer to Table 16–5. What is this firm’s total cost at the profit-maximizing quantity?
a.
$12
b.
$18
c.
$32
d.
$36
122. Refer to Table 16–5. How much profit will this firm earn at the monopolistically competitive price?
a.
$0
b.
$5
c.
$12
d.
$16
123. Refer to Table 16–5. Which of the following statements regarding this monopolistically competitive firm is correct?
a.
New firms will enter this market in the long run since firm profits are greater than zero.
b.
Firms will leave this market in the long run since firm profits are less than zero.
c.
This firm is currently in long-run equilibrium.
d.
This firm is currently in long-run equilibrium, and the firm is producing its efficient scale of output.
Table 16-6
Beatrice’s Birthday Cakes is one bakery among many in the market for birthday cakes. The following table presents cost
and revenue data for birthday cakes at Beatrice’s.
COSTS
REVENUES
Quantity
Produced
Total
Cost
Marginal
Cost
Quantity
Demanded
Price
Total
Revenue
Marginal
Revenue
0
$25
—
0
$60
—
1
$28
1
$54
2
$32
2
$48
3
$37
3
$42
4
$43
4
$36
5
$50
5
$30
6
$58
6
$24
7
$67
7
$18