CHAPTER 16—RISK ANALYSIS Key
1. Economic risk is a situation where:
2. The chance of loss associated with a given managerial decision is:
3. The difficulty of selling corporate assets at favorable prices under typical market conditions is:
4. Following an increase in the risk-free rate, the certainty equivalent adjustment factor a will:
5. The minimum expected opportunity loss associated with a decision equals the:
6. A decision standard that selects the alternative with the best of the worst possible outcomes is:
7. Economic risk is the:
8. A probability distribution for total profit is a list of:
9. A project with a 75% chance of earning $4,000 in profit and a 25% chance of earning $12,000 in profit has
an expected value of:
10. A project with a 50% chance of earning $0 and a 50% chance of earning $100 has a standard deviation of:
11. For two projects of differing sizes, the project that is less risky has the:
12. If profits are normally distributed with a mean of $12 and a standard deviation of $4, there is a 50/50 chance
actual profits will exceed:
13. Risk neutrality implies a:
14. For a risk seeker the marginal utility of money is:
15. A certainty-equivalent adjustment factor a = 0.8 is consistent with risk:
16. If you are indifferent between $1 and a lottery ticket that gives you a 0.001 chance of winning $1,000 you
are:
17. To justify an investment that involves an out-of-pocket cost of $100 and a 50/50 chance of payoffs of $0 or
$250, the decision maker must have personal certainty equivalent adjustment factor that is:
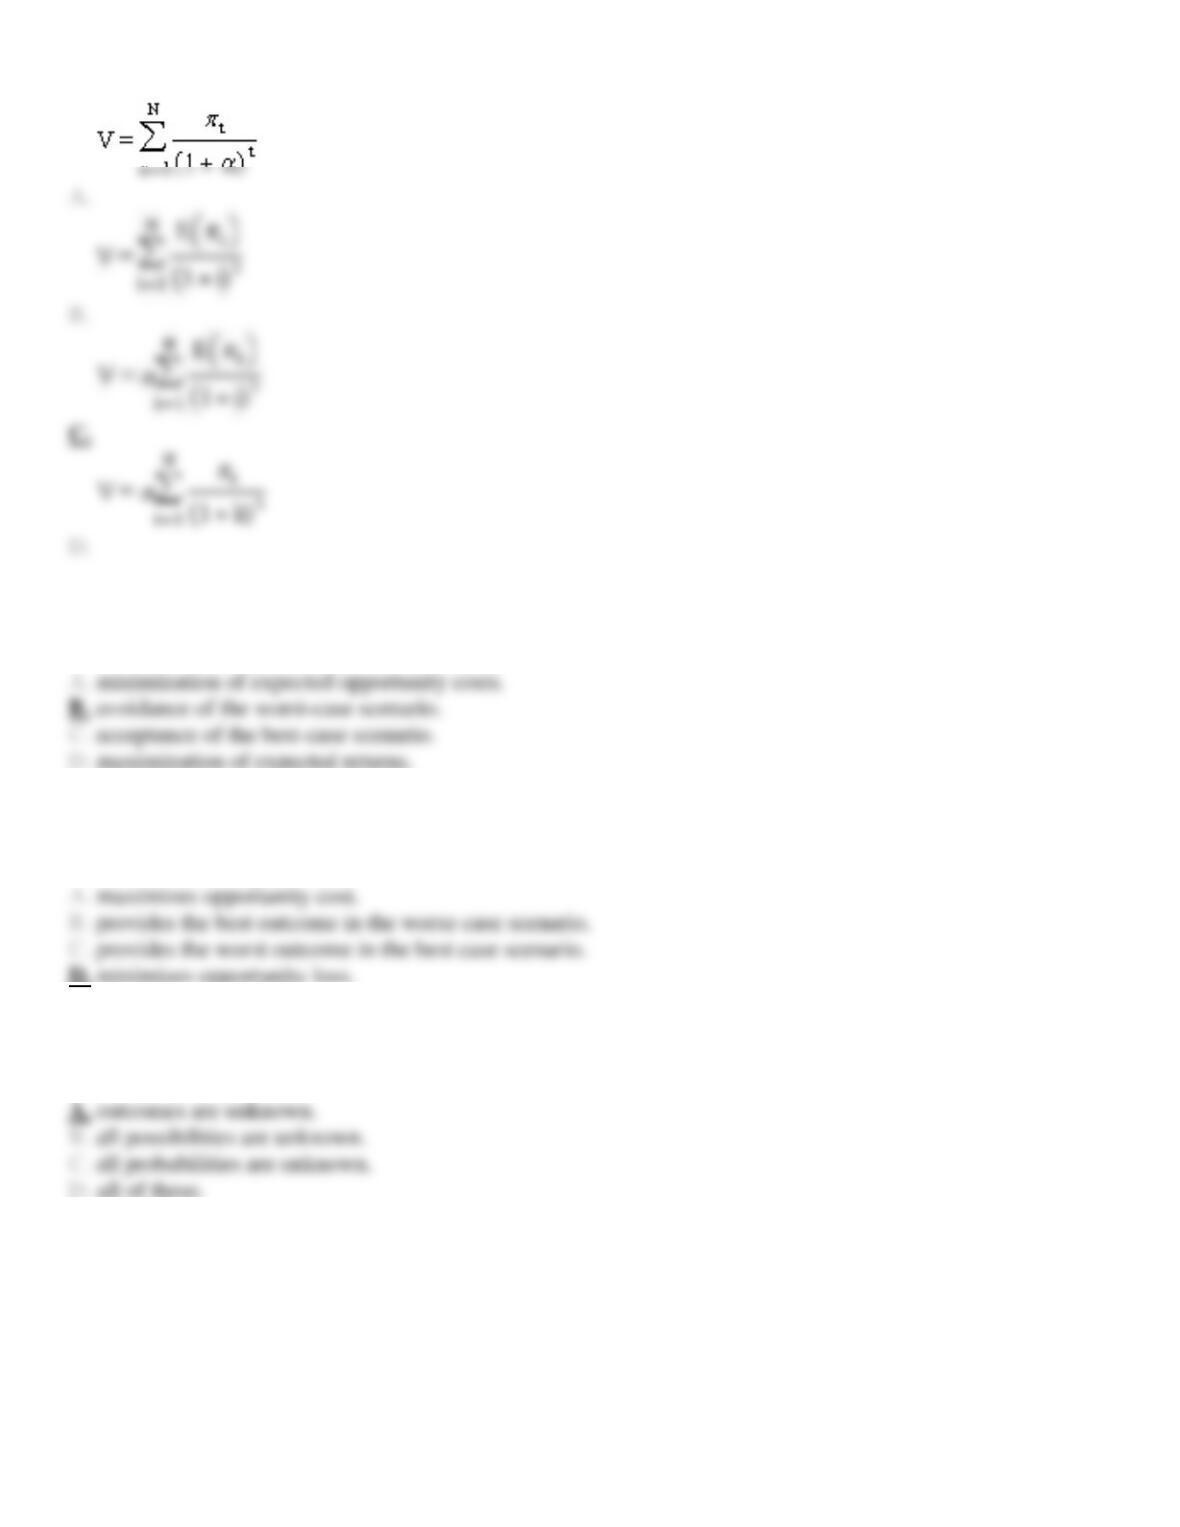
18. A valuation model that explicitly accounts for risk can be written as:
19. The maximin criterion involves:
20. The minimax regret criterion directs the decision maker to select the alternative that:
21. Uncertainty is present when:
22. The amount of a bet is irrational when it:
23. When the dispersion of possible returns is irrelevant, the decision maker is said to be:
24. A risk seeking decision maker displays:
25. When E(R) = $100,000, only a risk-seeking investor would make a certain sum investment in an amount:
26. Risk Attitudes. Identify each of the following as consistent with risk-averse, risk-neutral, or risk-seeking
behavior in investment project selection:
A.
Ignoring risk levels of investment alternatives.
B.
Larger risk premiums for riskier projects.
C.
Valuing equally certain sums and expected risky sums of equal dollar amounts.
D.
Increasing marginal utility of money.
E.
Preference for larger, as opposed to smaller, coefficients of variation.
27. Certainty Equivalents. The certainty equivalent concept can be widely employed in the analysis of
personal and business decision making. Identify each of the following statements as true or false and explain
why.
A.
If previously accepted projects with similar risk have a’s in a range from a = 0.4 to a = 0.5, an investment with an expected return of
$200,000 is acceptable at a cost of $125,000.
B.
A project for which NPV < 0 using a risk-adjusted discount rate will have an implied a factor that is too large to allow project
acceptance.
C.
The appropriate certainty equivalent adjustment factor a indicates the minimum price in certain dollars that an individual should be
willing to pay per risky dollar of expected return.
D.
State lotteries that pay out 40% of the revenues they generate require players who place at least a certain $2.50 value on each $1 of
expected risky return.
E.
An a < 1 implies that a certain sum and a risky expected return of a greater dollar amount provides equivalent utility to a given decision
maker.
A.
False. If similar projects implicitly involve a’s in the range from a = 0.4 to a = 0.5, then the maximum certain sum equivalent of an
expected risky $200,000 falls in the range between $80,000 (= 0.4 ´ $200,000) and $100,000 (= 0.5 ´ $200,000), because:
B.
True. A project which has an NPV < 0 using the risk adjusted discount rate approach will have an a factor above the maximum
C.
False. The certainty equivalent adjustment factor a indicates the maximum price in certain dollars that an individual is willing to pay per
risky dollar of expected return.
True. The a factor is the ratio of a certain sum divided by an expected risky amount that are equivalent in terms of utility, but may differ
B.
Risk averse describes those investors who are only willing to accept investment projects with larger risk premiums as project risk levels
C.
Risk neutrality implies that a given decision maker places a value on an investment project that is just equal to the project expected
return. Therefore, certain sums and expected risky sums of equal dollar amounts are valued equally.
D.
Risk seeking investors display behavior consistent with an increasing marginal utility of money. Because increases in income or wealth
28. Expected Return Analysis. William Mays offers free investment seminars to local PTA groups. On
average, Mays expects 1% of seminar participants to purchase $25,000 each in tax sheltered investments, and
2% to purchase $10,000 each in stocks and bonds. Mays earns a 4% net commission on tax shelters, and 1% on
stocks and bonds.
A.
Calculate Mays’ expected net commissions per seminar if attendance averages twenty-five persons.
29. Expected Return Analysis. Alex P. Keaton has just accepted a job as a broker at a major NYSE member
firm, and has been asked to develop a list of customers by telephoning medical doctors and other professionals
located in the metropolitan area. On average, Keaton expects 1% of those called to purchase $15,000 each in
mutual fund investments, and 3% to purchase $10,000 each in stocks and bonds. Keaton earns a 2% net
commission on mutual funds and 1% on stocks and bonds.
A.
Calculate Keaton’s expected net commissions if he calls an average of twenty-five persons per day.
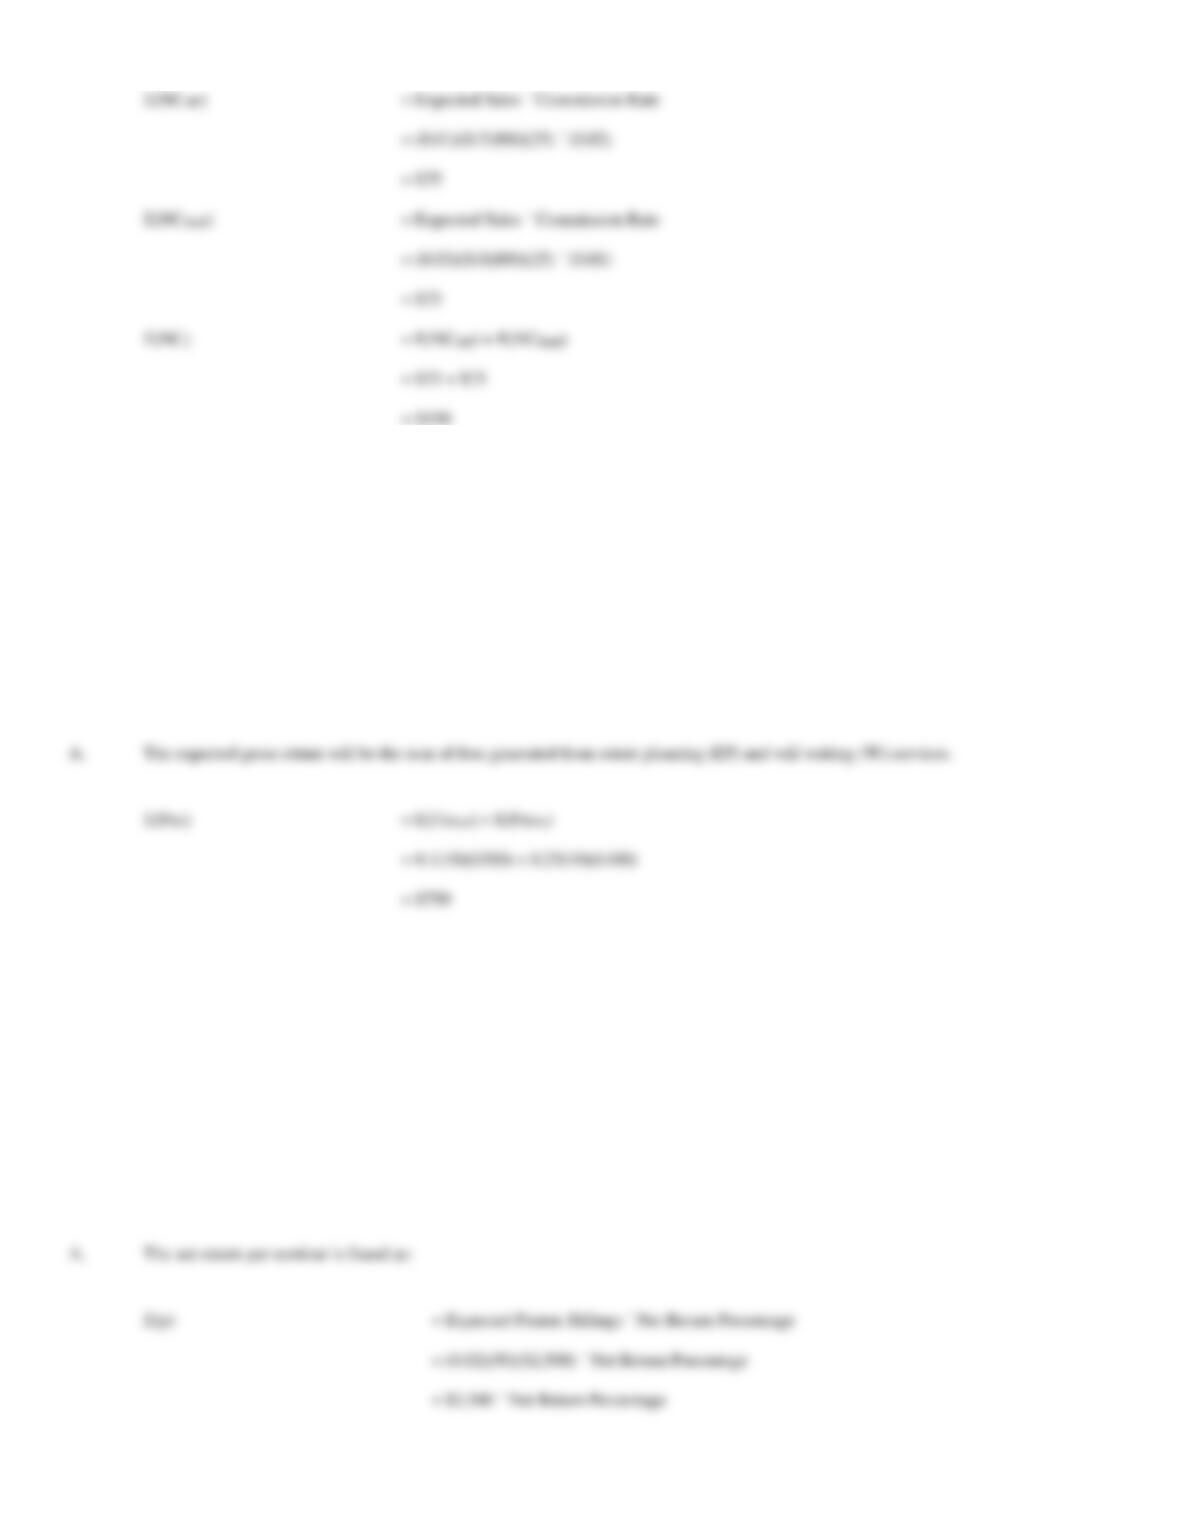
A.
Expected net commission will be the sum of net commissions on mutual funds (MF) and stocks and bonds (S&B).
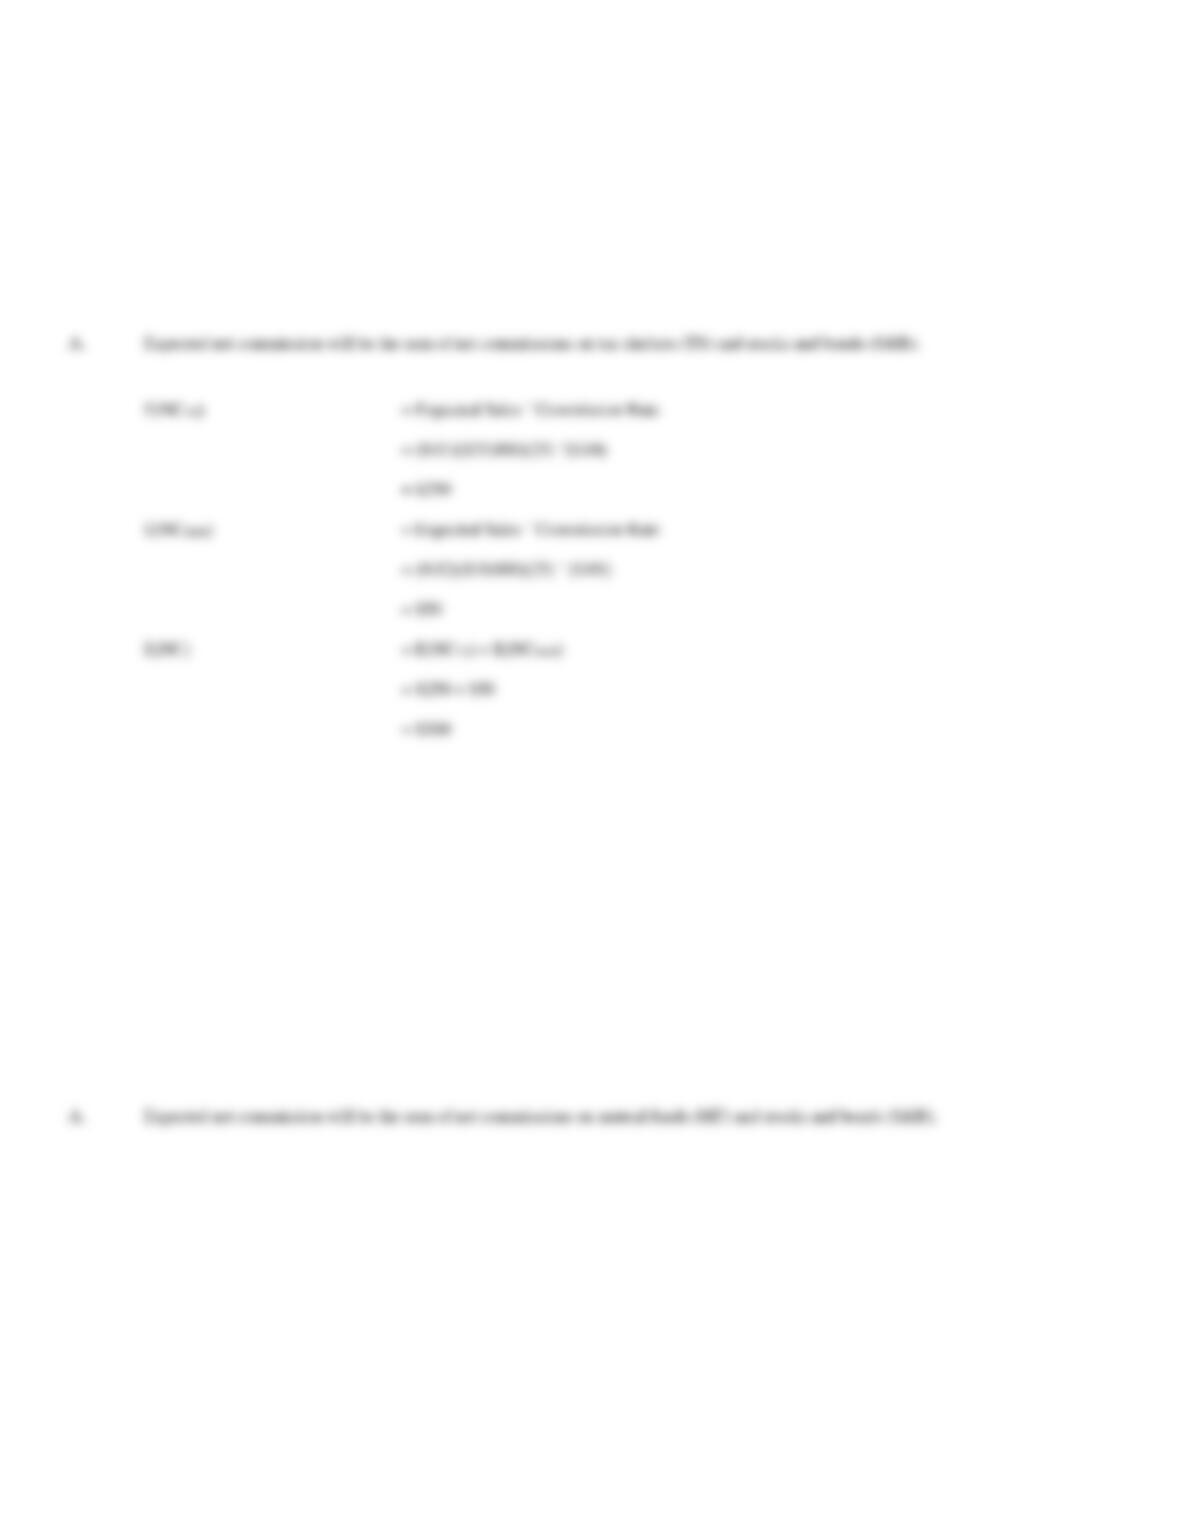
A.
Expected net commission will be the sum of net commissions on tax shelters (TS) and stocks and bonds (S&B).
= Expected Sales ´ Commission Rate
= (0.01)($25,000)(25) ´(0.04)
= $250
= Expected Sales ´ Commission Rate
= $50
= $250 + $50
30. Expected Return Analysis. Barry Bonds offers free fixed-income investment seminars to local YMCA
groups. On average, Bonds expects 10% of seminar participants to purchase customized financial planning
services priced at $500 each, and 25% to purchase an investment option priced at $100.
A.
Calculate Bonds’ expected gross return per seminar if attendance averages ten persons.
31. Expected Return Analysis. Dr. John Carter offers health seminars to local PTA groups. On average, Carter
expects 2% of seminar participants to become patients of his HMO organization at a gross billing of $2,500 per
patient per year.
A.
Calculate Carter’s expected net return per dollar of gross patient billings if attendance averages fifty persons per seminar, and a
first-year net return of $100 must be earned to justify Carter’s time and effort per seminar.
32. Probability Analysis. WD-50, Inc. has just completed development of a new spray lubricant. Preliminary
market research indicates two feasible marketing strategies: developing general consumer acceptance through
media advertising, or developing distributor acceptance through intensive personal selling by company
representatives. The marketing manager has developed the following estimates for sales under each alternative:
Media Advertising Strategy
Personal Selling Strategy
Probability
Sales
Probability
Sales
0.1
$125,000
0.3
$250,000
0.4
375,000
0.4
375,000
0.4
625,000
0.3
500,000
0.1
875,000
A.
Assume that the company has a 20% profit margin on sales. Calculate expected profits for each plan.
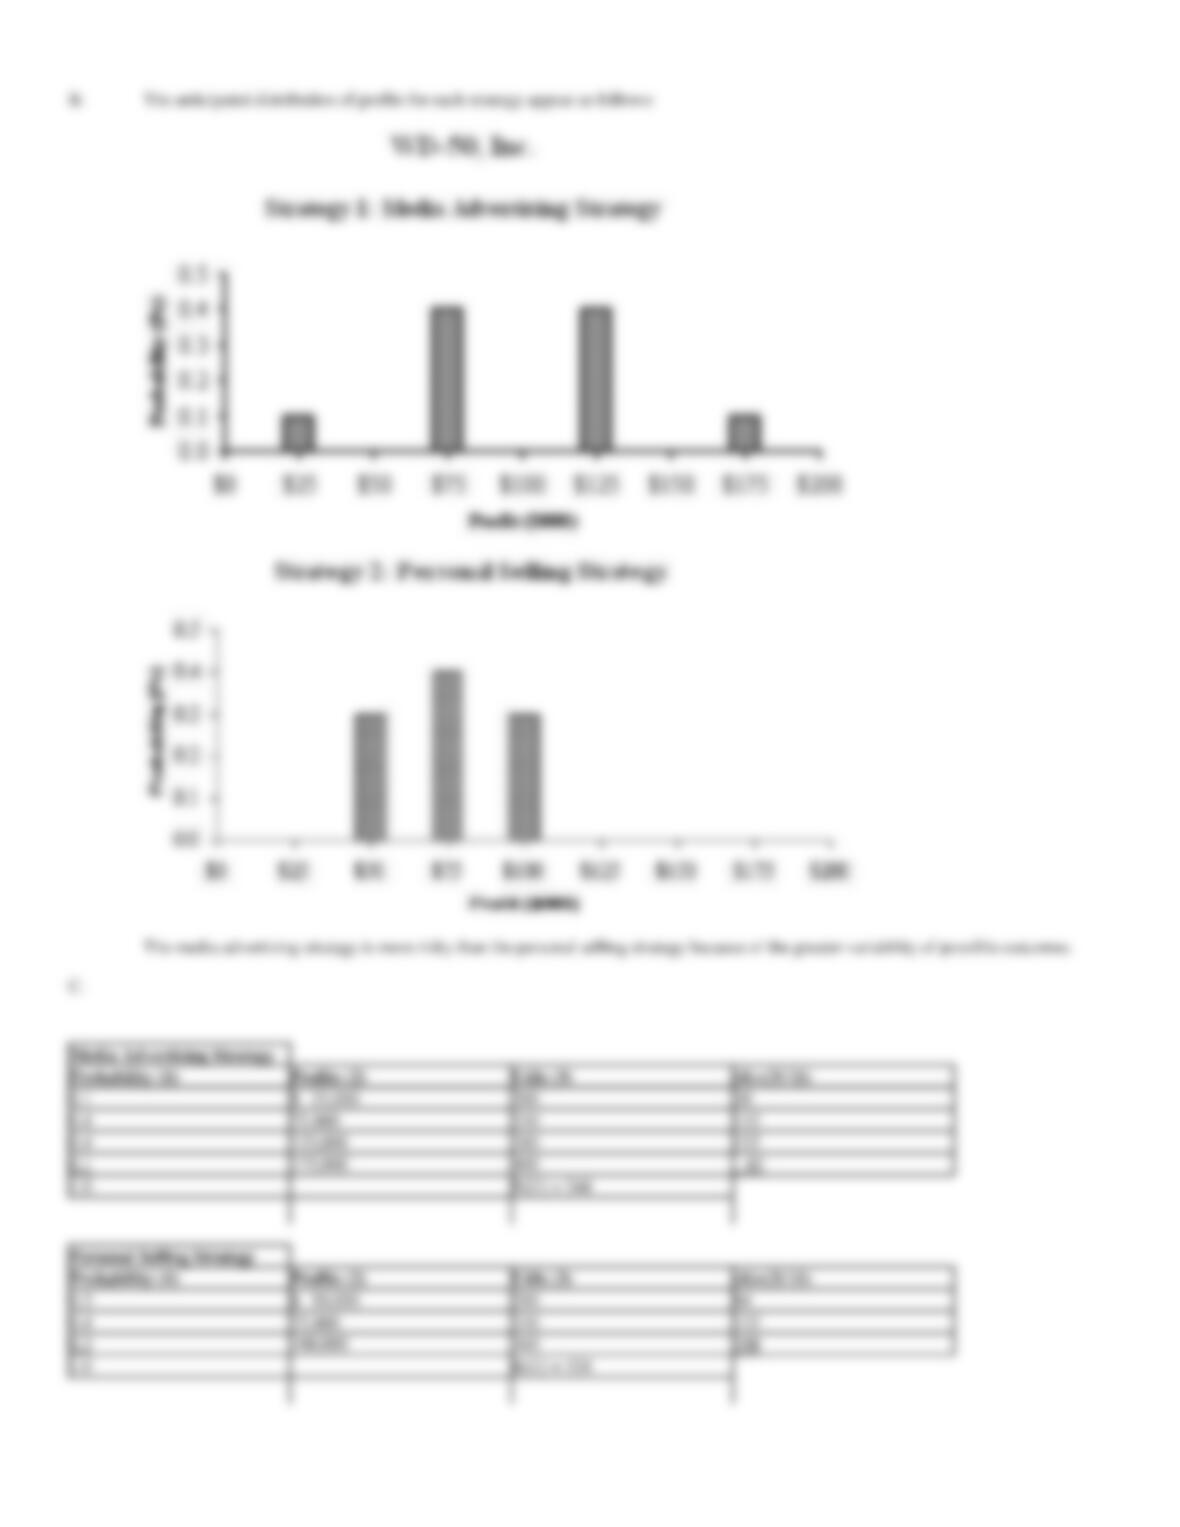
B.
Construct a simple bar graph of the possible profit outcomes for each plan. Which plan appears to be more risky?
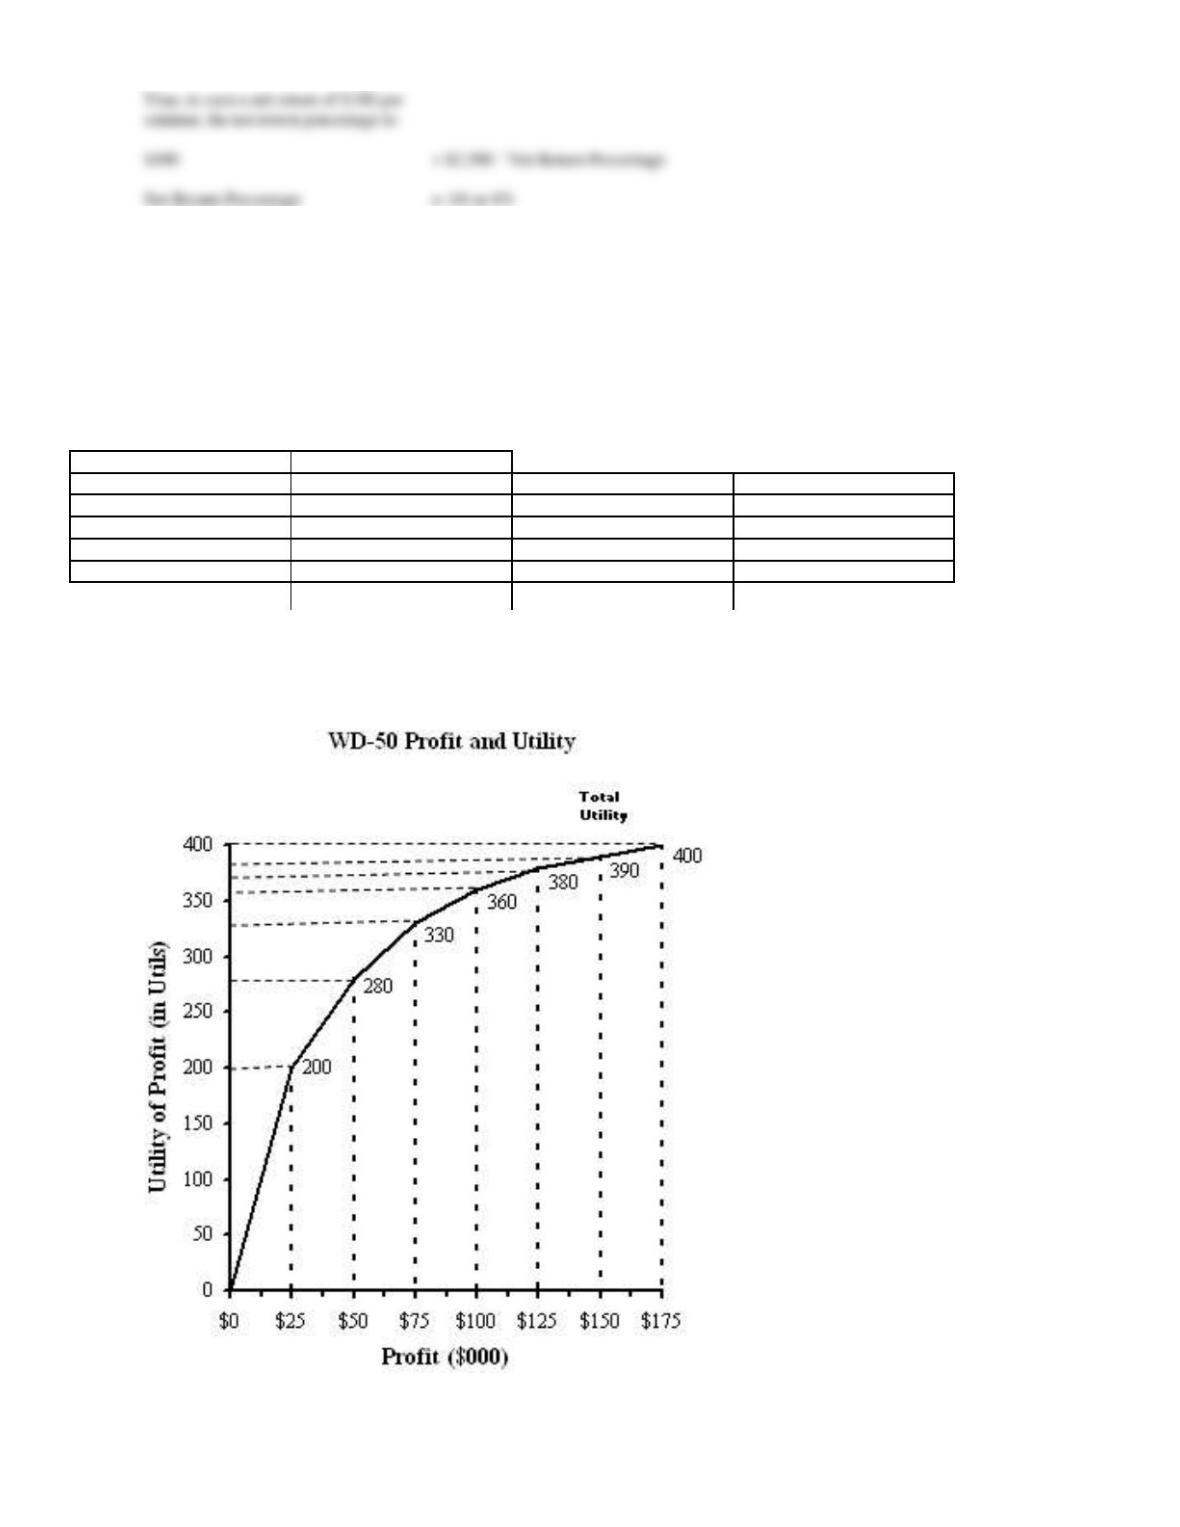
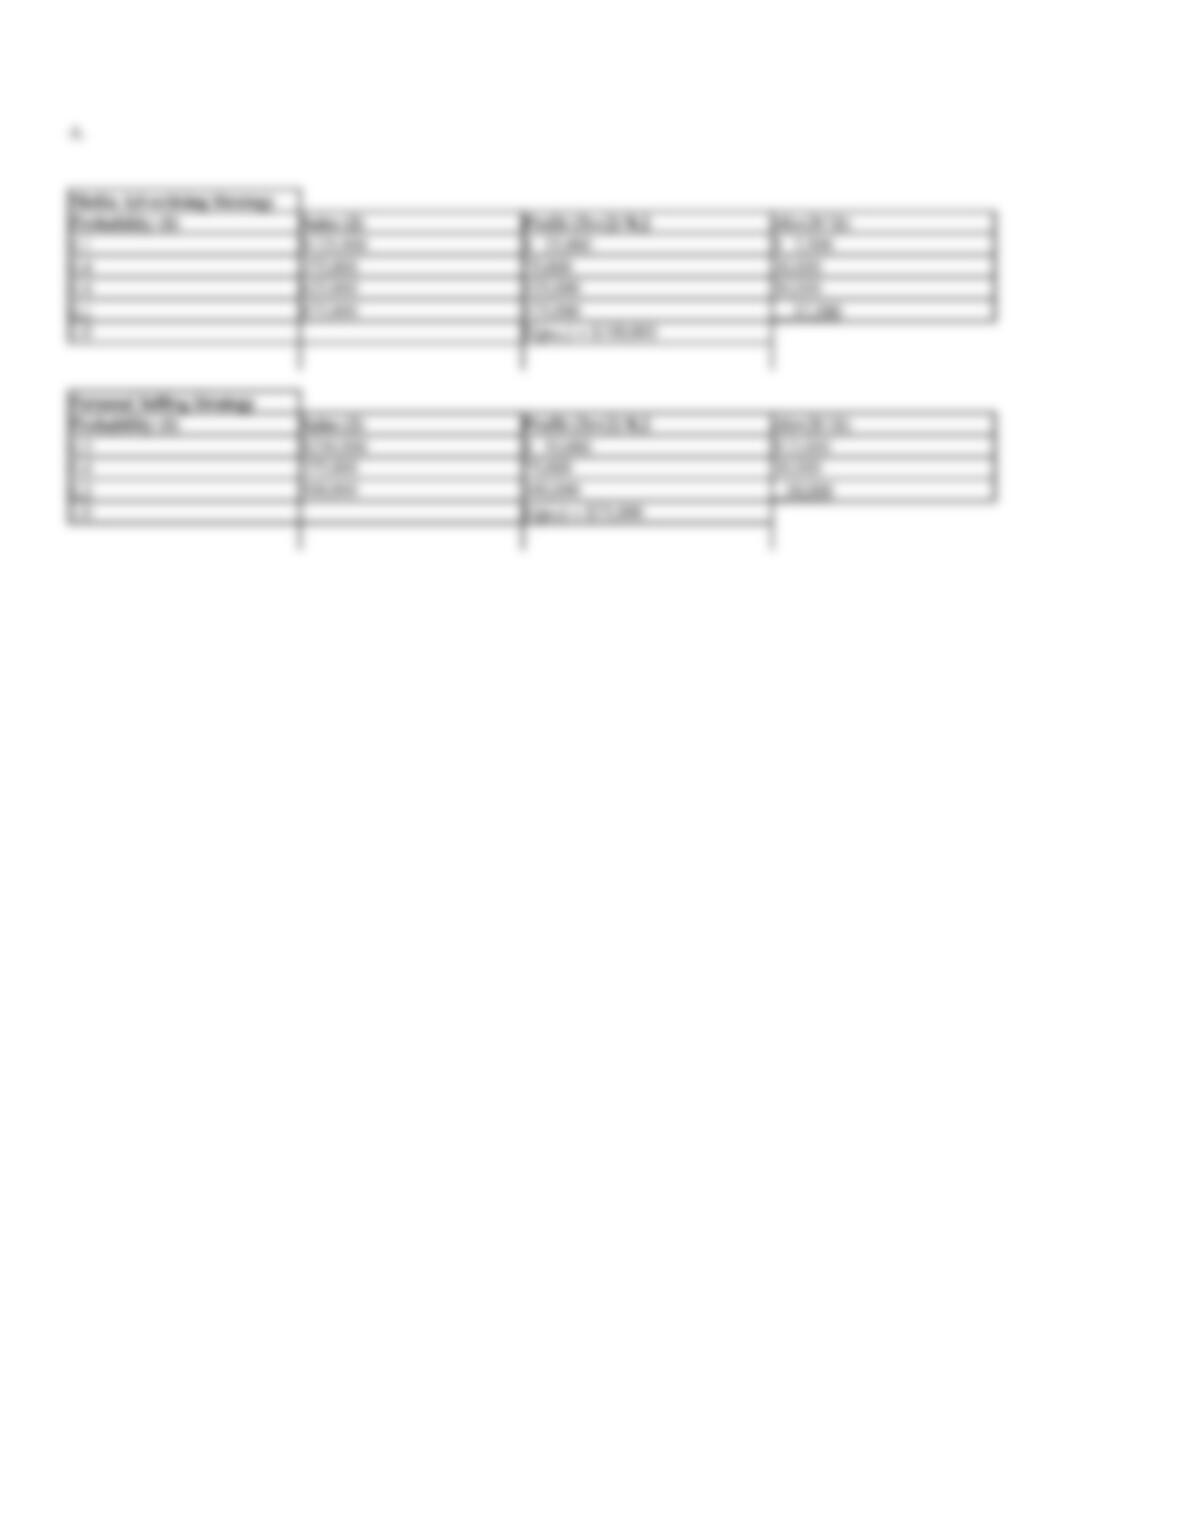
C.
Assume that management’s utility function resembles the one illustrated below. Which strategy should the marketing manager
recommend?
Thus, to earn a net return of $100 per
seminar, the net return percentage is:
$100
= $2,500 ´ Net Return Percentage
Net Return Percentage
= .04 or 4%
33. Probability Analysis. Ceramic Tile, Inc. wishes to adopt one of two feasible marketing strategies:
developing general consumer acceptance through media advertising, or developing distributor acceptance
through intensive personal selling by company representatives. The marketing manager has developed the
following estimates for sales under each alternative:
Media Advertising Strategy
Personal Selling Strategy
Probability
Sales
Probability
Sales
0.3
$ 2,500,000
0.2
$ 5,000,000
0.4
10,000,000
0.6
7,500,000
0.3
17,500,000
0.2
10,000,000
A.
Assume that the company has a 10% net profit margin on sales. Calculate expected profits for each plan.
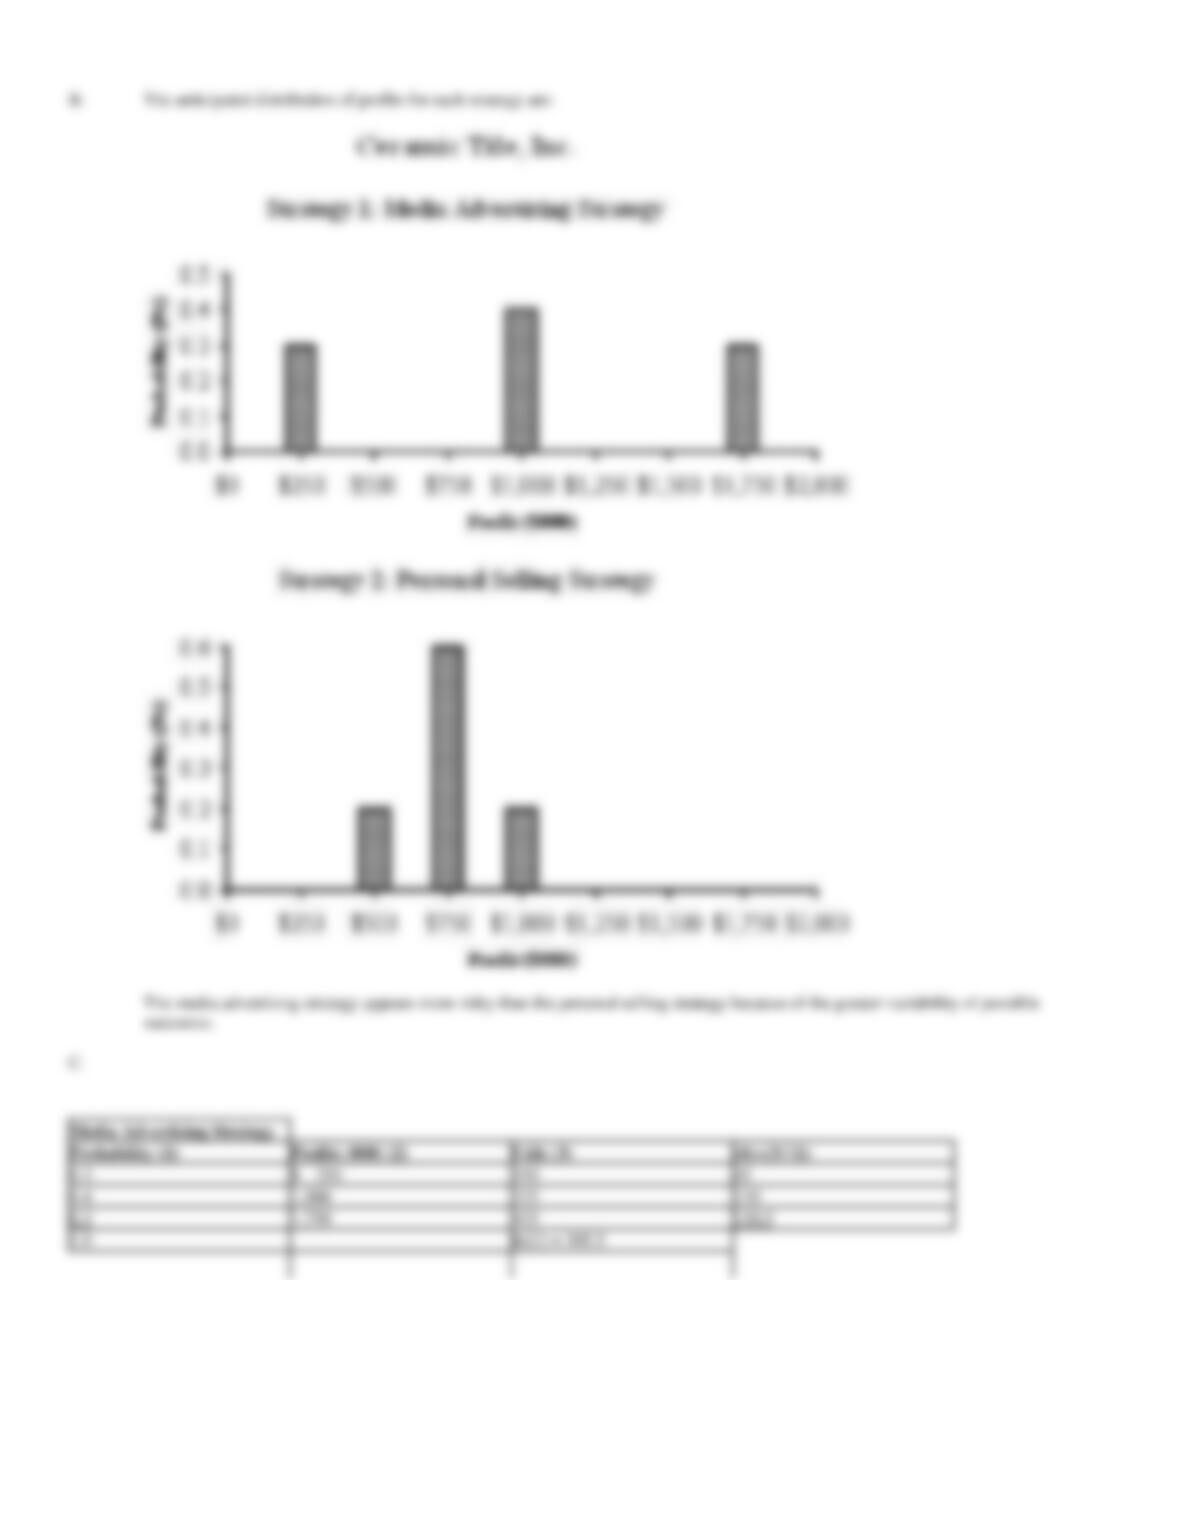
B.
Construct a simple bar graph of the possible profit outcomes for each plan. Which plan appears to be more risky?
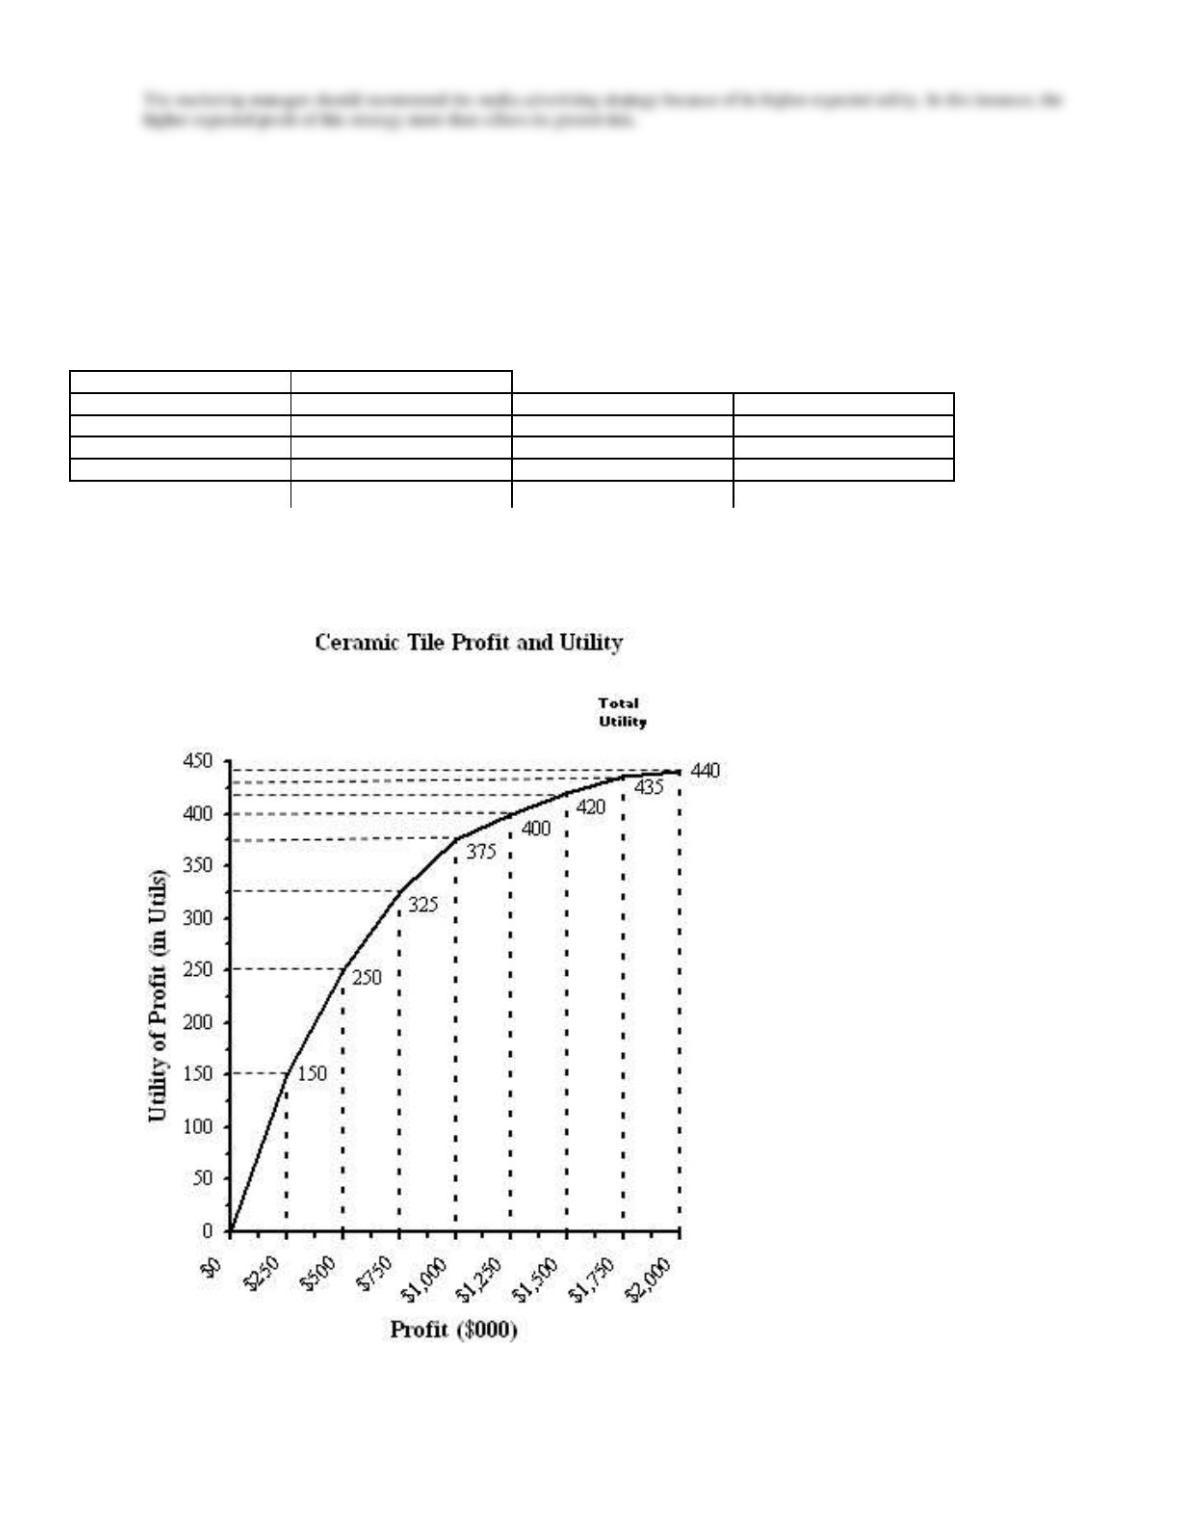
C.
Assume that management’s utility function resembles the one illustrated below. Which strategy should the marketing manager
recommend?


34. Probability Analysis. The Dental Clinic, Inc. is contemplating replacing an obsolete word processing
system with one of two innovative lines of equipment. Alternative 1 requires a current investment outlay of
$26,022, whereas alternative 2 requires an outlay of $31,048. The following cash flows (cost savings) will be
generated each year over the five-year useful lives of the new systems.
Probability
Cash Flow
Alternative 1
0.32
$ 7,000
0.36
10,000
0.32
13,000
Alternative 2
0.18
$ 7,500
0.64
10,000
0.18
12,500
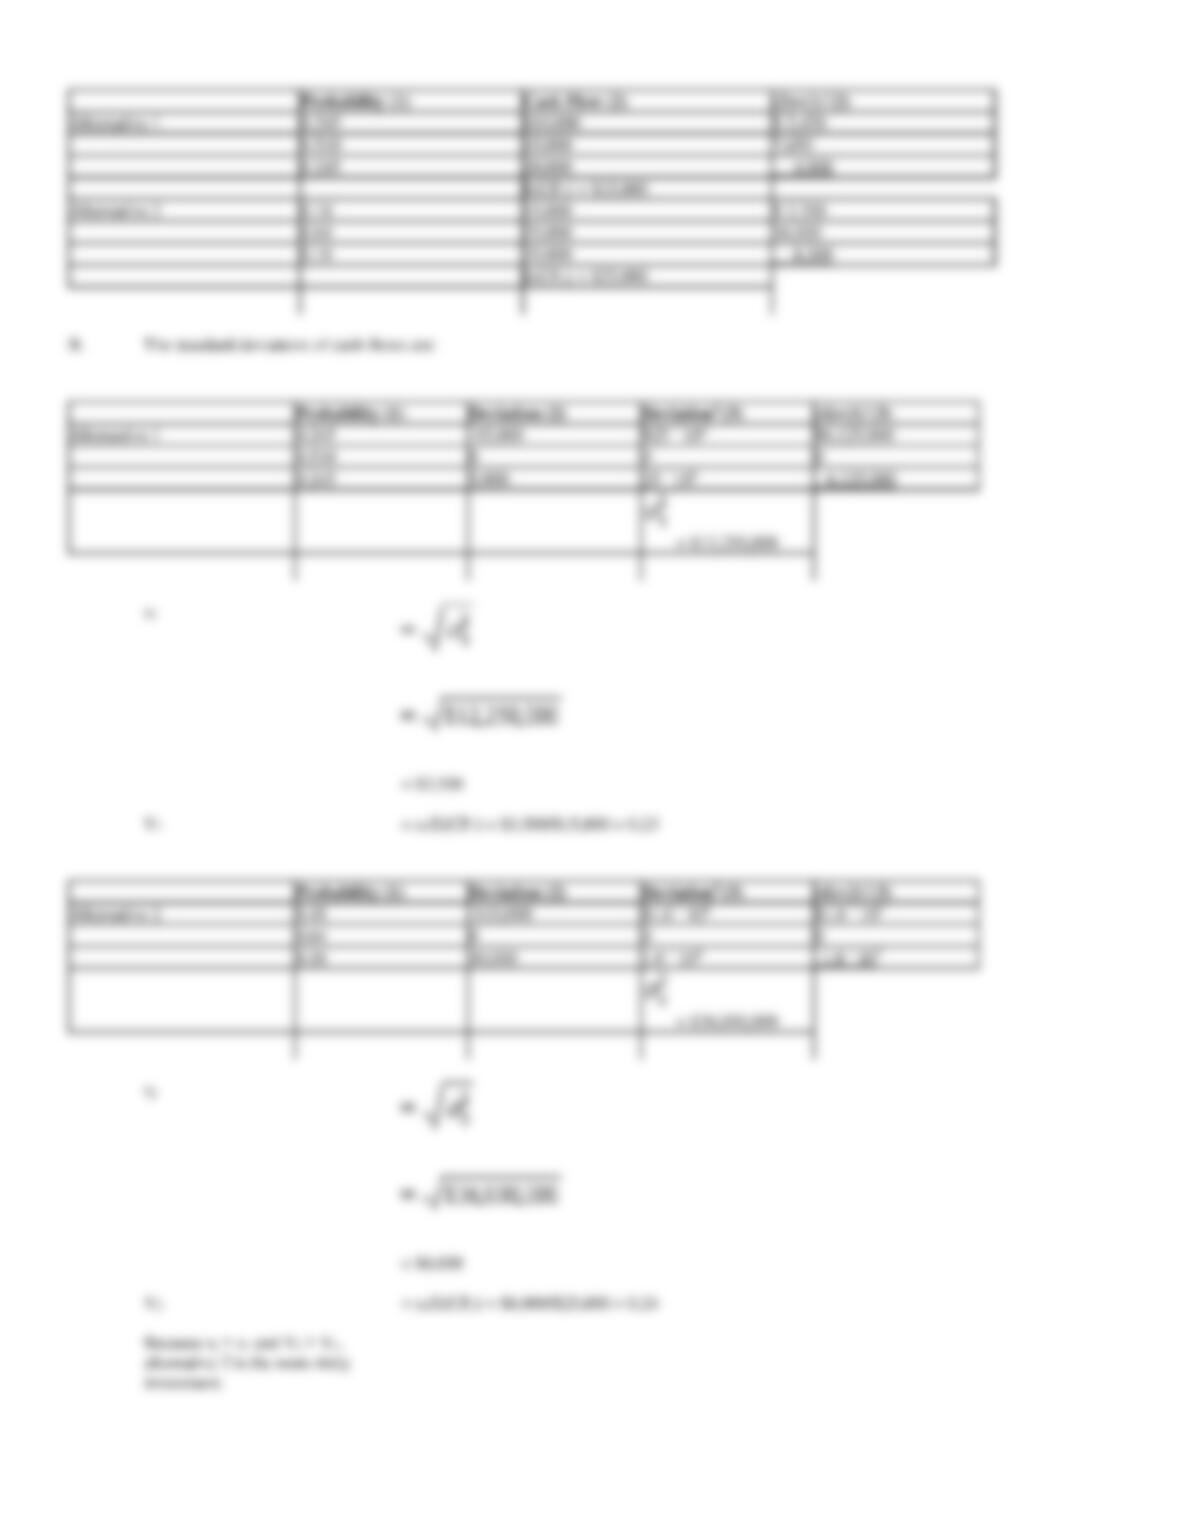
A.
Calculate the expected cash flow for each investment alternative.
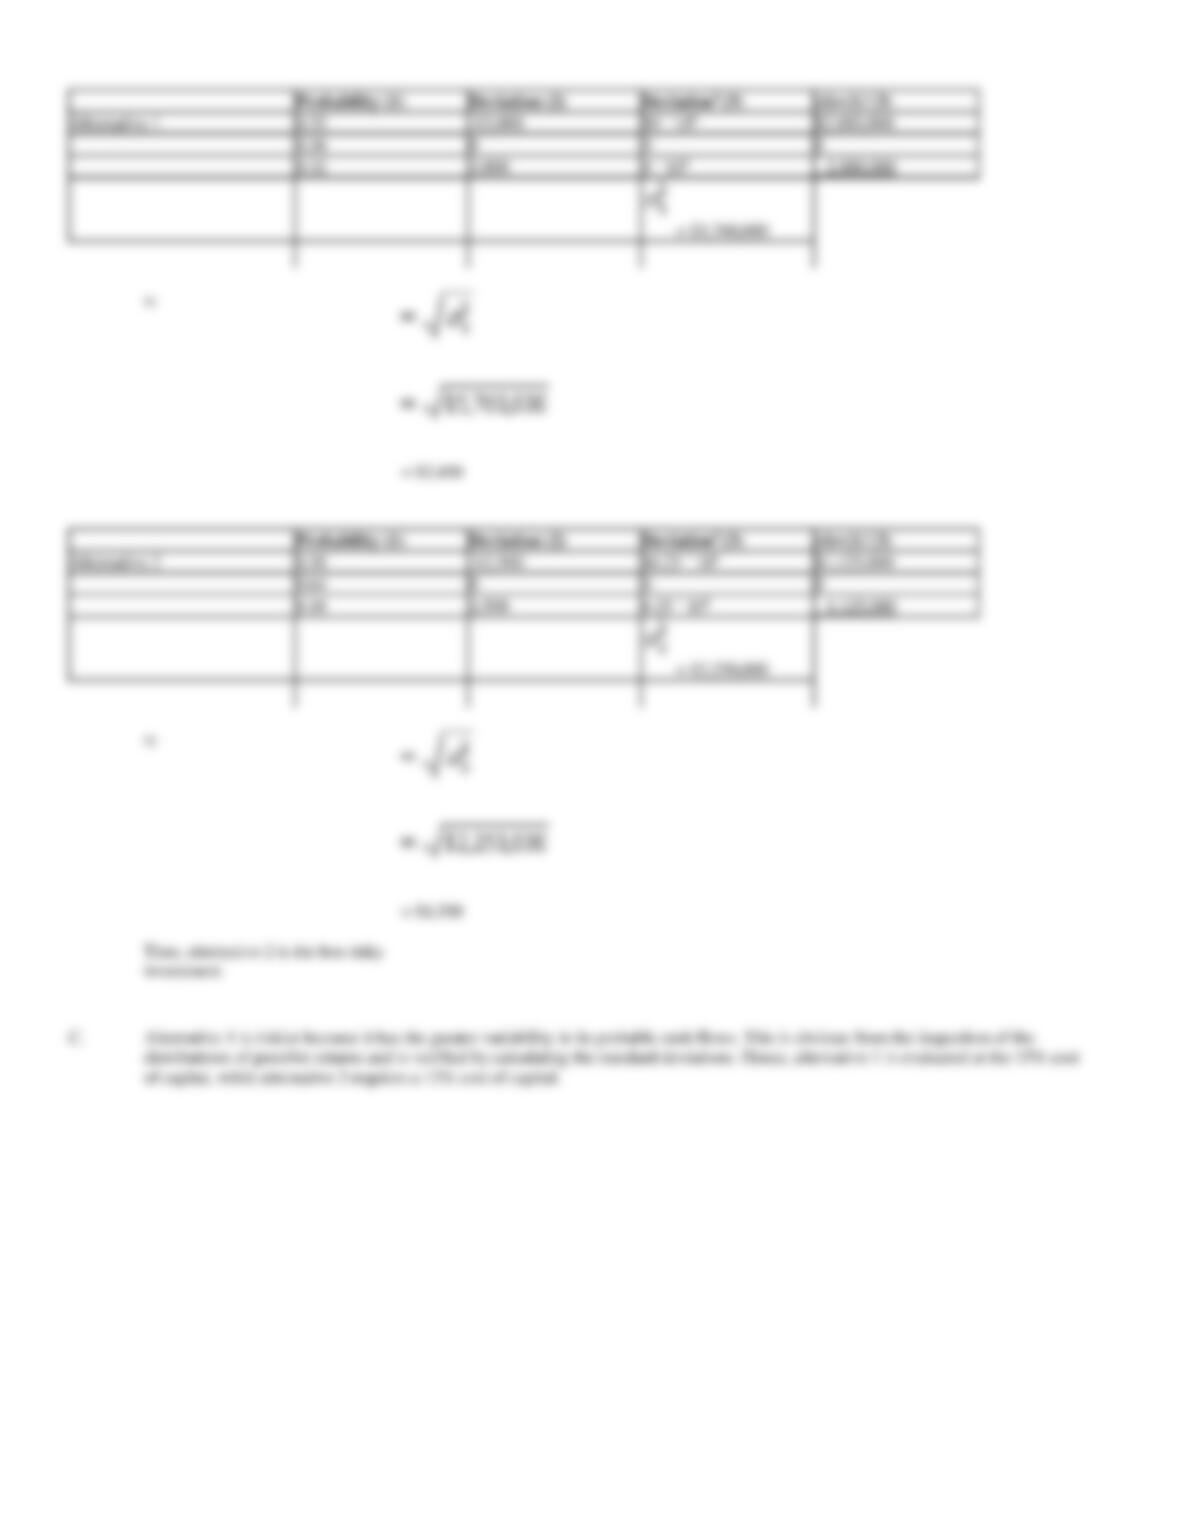
B.
Calculate the standard deviation of cash flows (risk) for each investment alternative.
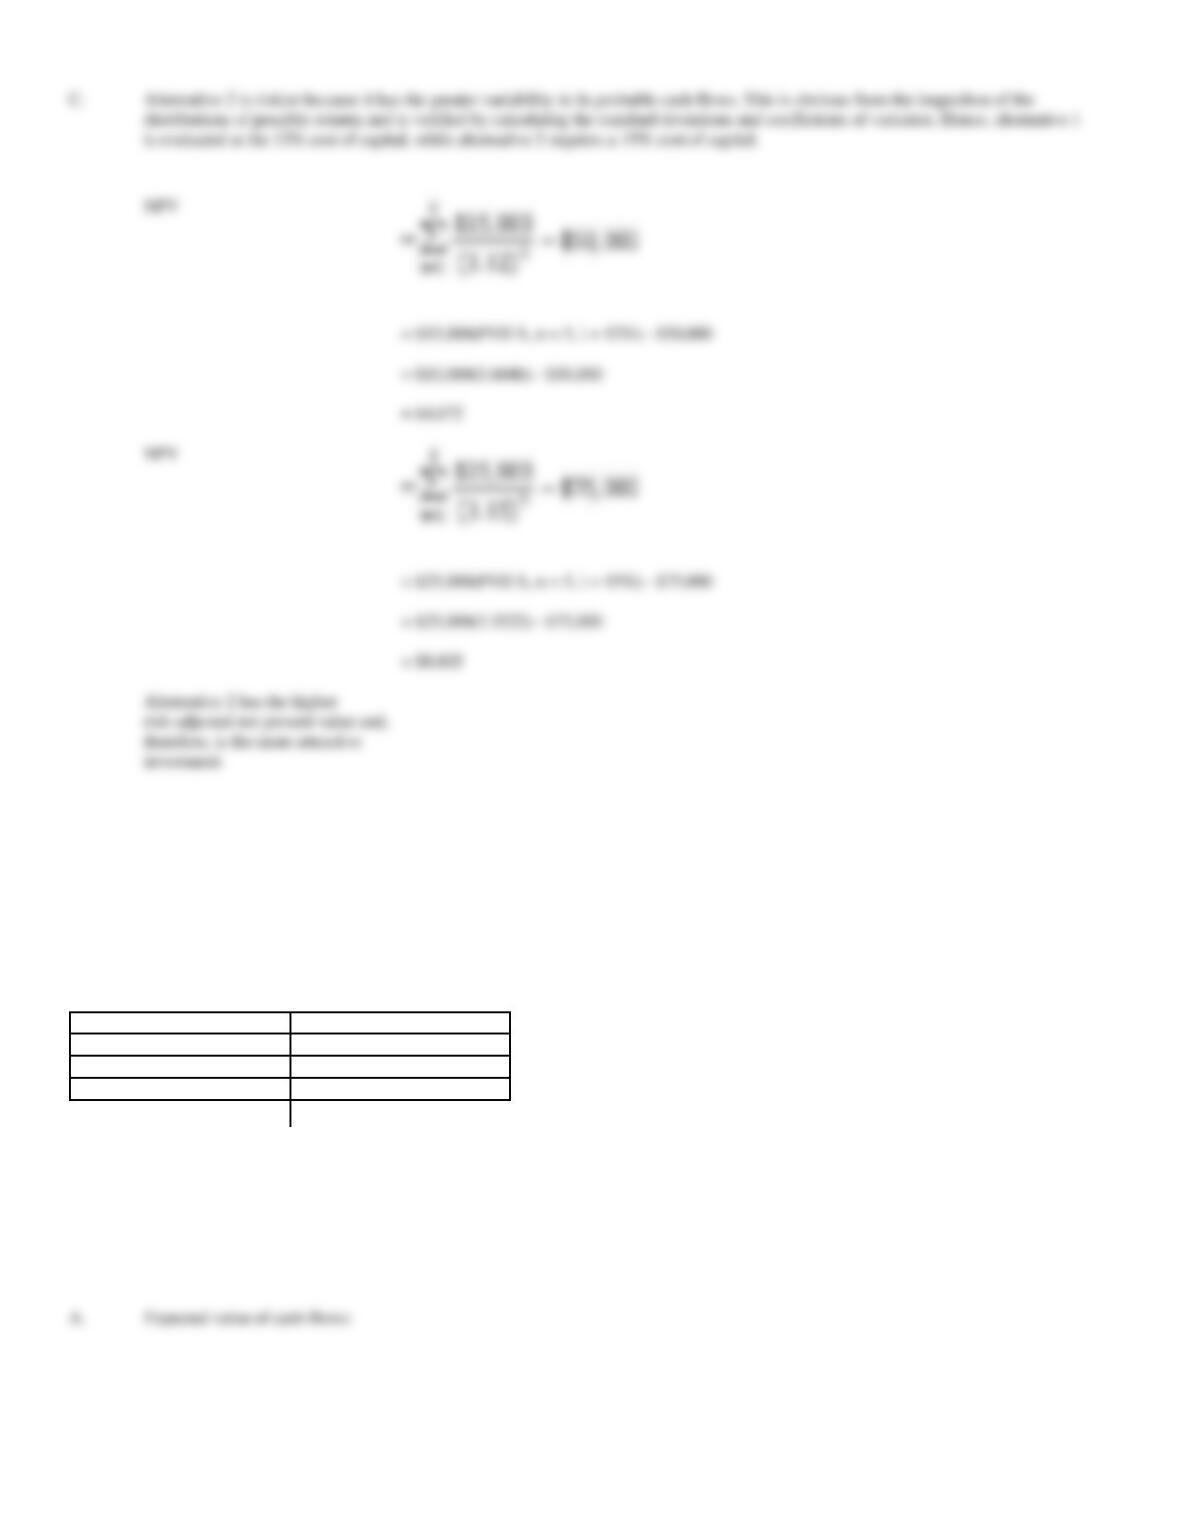
C.
The firm will use a discount rate of 15% for the cash flows with a higher degree of dispersion and a 12% rate for the less risky cash
flows, calculate the expected net present value for each investment. Which alternative should be chosen?
A.
Expected values of cash flows
Probability (1)
Cash Flow (2)
(3)=(1)´(2)
Alternative 1
0.32
$ 7,000
$ 2,240
0.36
10,000
3,600
0.32
13,000
4,160
Alternative 2
0.18
7,500
$ 1,350
0.18
12,500
2,250
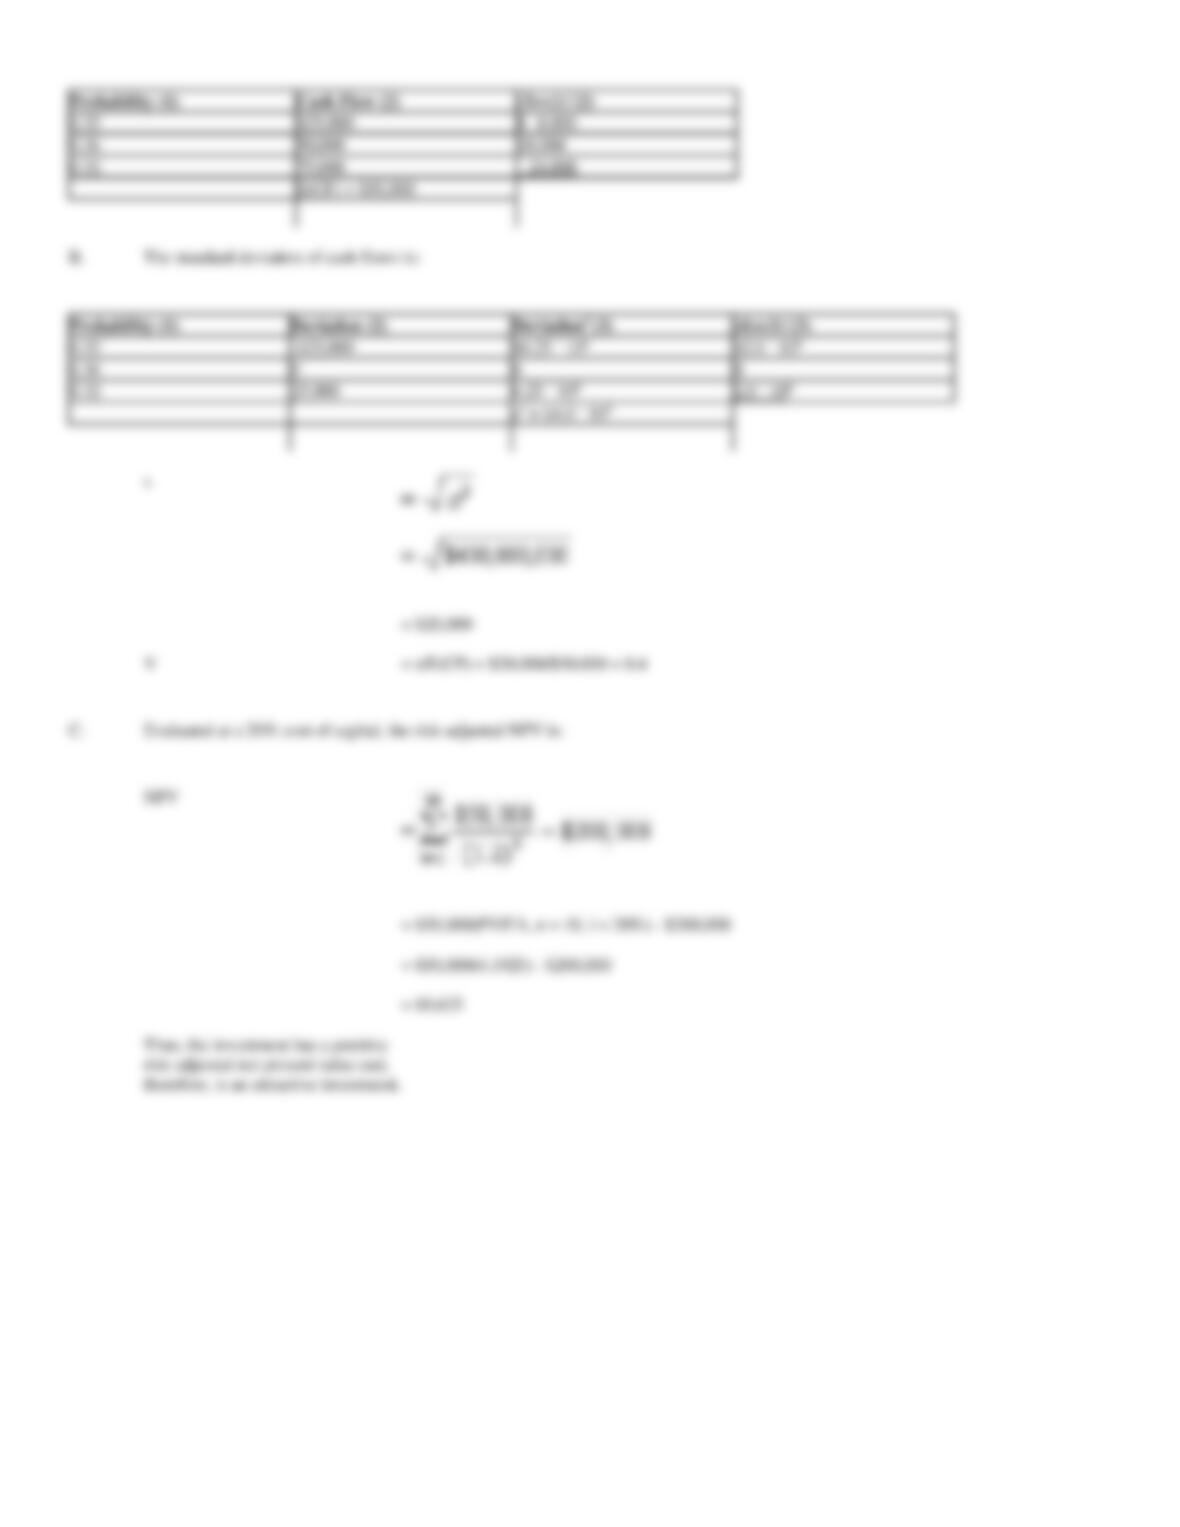
B.
The standard deviations of cash flows are:
Personal Selling Strategy
Probability (1)
Profits (000) (2)
Utils (3)
(4)=(3)´(1)
0.2
$ 500
0.6
0.2
1,000
75
1.0
E(U) = 320
35. Probability Analysis. The Medical Centre is considering taking on a new lease for additional office space
in alternative suburban shopping areas. Alternative 1 requires a current investment outlay of $50,000;
alternative 2 requires an outlay of $75,000. The following cash flows will be generated each year over an initial
five-year lease period.
Probability
Cash Flow
Alternative 1
0.245
$10,000
0.510
15,000
0.245
20,000
Alternative 2
0.18
$15,000
0.64
25,000
0.18
35,000
A.
Calculate the expected cash flow for each investment alternative.
B.
Calculate the standard deviation and coefficient of variation of cash flows (risk) for each investment alternative.
C.
The firm will use a discount rate of 15% for the cash flows with higher degree of dispersion and a 12% rate for the less risky cash flows,
calculate the expected net present value for each investment. Which alternative should be chosen?
A.
Expected values of cash flows:
= $10,000(PVIFA, n = 5, i = 15%) – $26,022
= $10,000(3.3522) – $26,022
= $7,500
= $10,000(3.6048) – $31,048
= $5,000
36. Probability Analysis. The Seattle HMO, Inc. is considering entering into a data processing contract with a
leading consulting firm. Entering into such an agreement would require a current investment outlay of
$200,000. The following net cash flows (cost savings) will be generated each year over the ten-year life of the
management contract:
Probability
Cash Flow
0.32
$25,000
0.36
50,000
0.32
75,000
A.
Calculate the expected cash flow.
B.
Calculate the standard deviation and coefficient of variation of cash flows (risk).
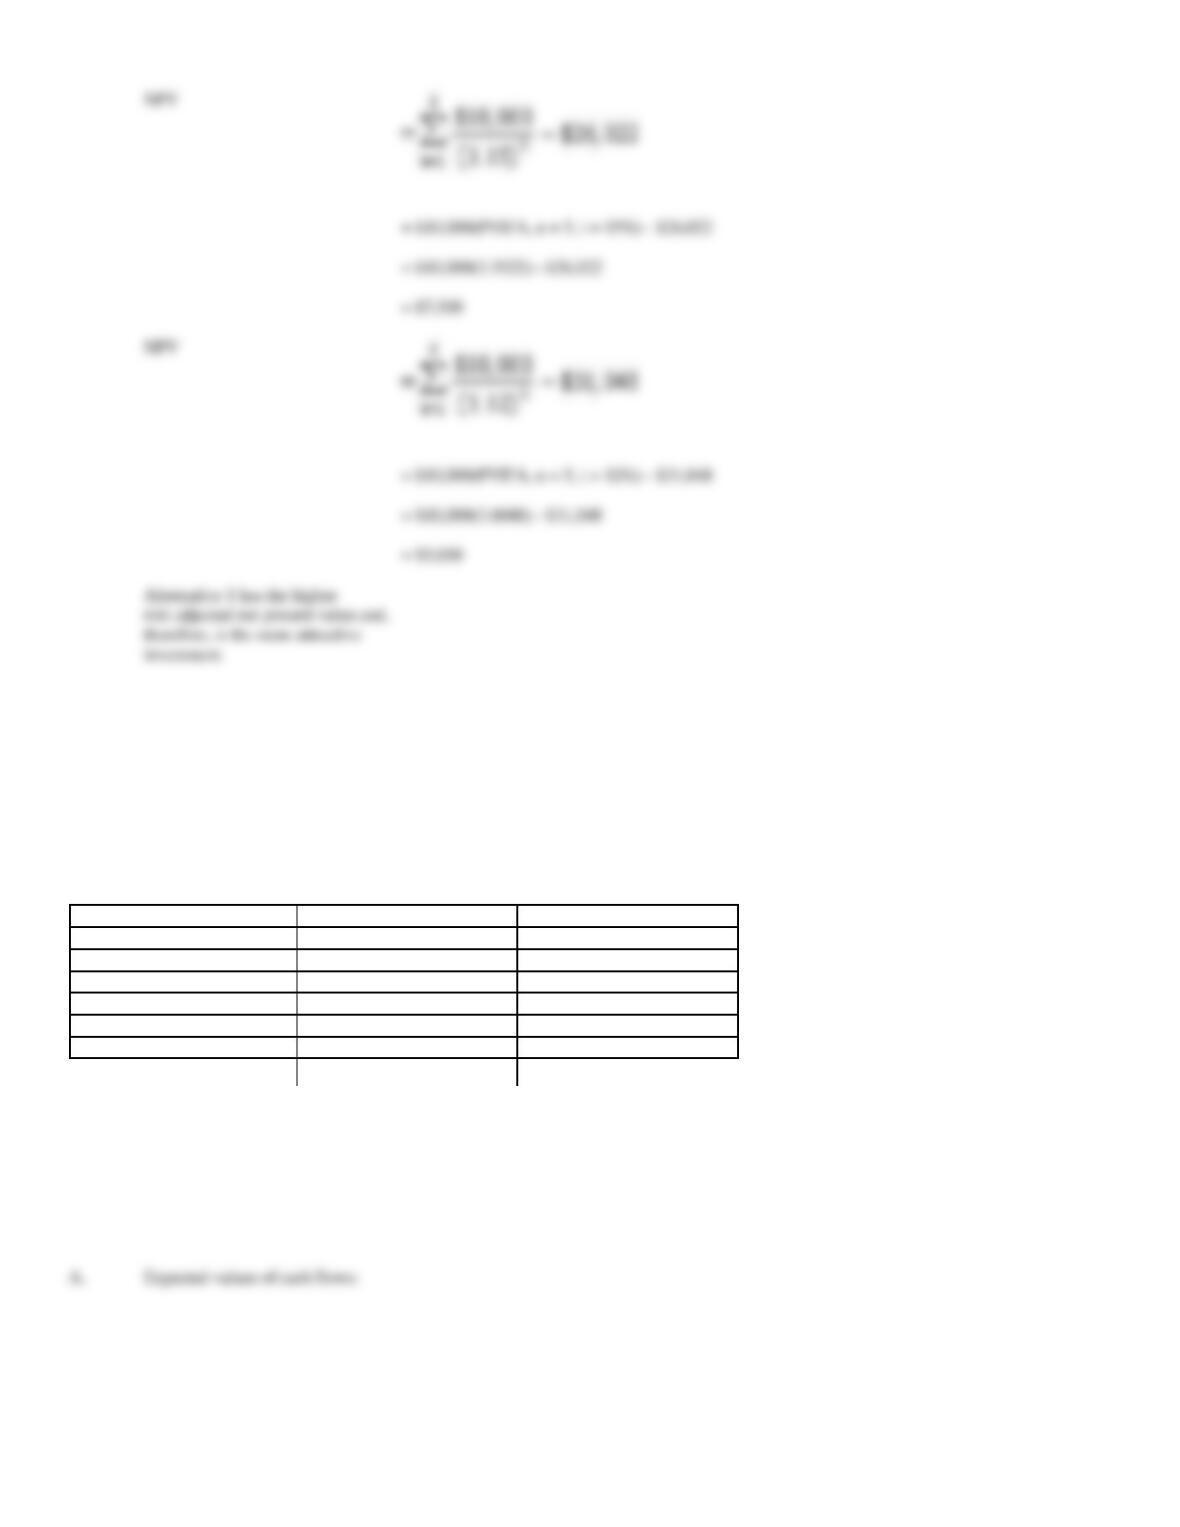
C.
Calculate the expected net present value for the investment if the firm uses a discount rate of 20%. Should the investment be
undertaken?
A.
Expected value of cash flows:
= $15,000(PVIFA, n = 5, i = 12%) – $50,000
= $15,000(3.6048) – $50,000
= $4,072
= $25,000(PVIFA, n = 5, i = 15%) – $75,000
= $25,000(3.3522) – $75,000
= $8,805