Chapter 15 – Natural Resource and Energy Economics
1. As of 2010, the world’s population is approximately:
2. Relative to 1800, the living standard of the average person today in the U.S. is about _____
times higher.
Chapter 15 – Natural Resource and Energy Economics
3. Relative to 1800, today in the world there are:
4. Whose An Essay on the Principle of Population argued that human living standards could
only temporarily rise above subsistence?
5. What is the relationship between living standards and birthrates?
Chapter 15 – Natural Resource and Energy Economics
6. The total fertility rate necessary to keep the population constant is approximately equal to:
7. The total fertility rate:
8. If a country has a total fertility rate of 1.8, then all else equal we would expect:
Chapter 15 – Natural Resource and Energy Economics
9. A total fertility rate of 1.0 will cause the:
10. A rising standard of living will:
11. Population will necessarily fall if the:
Chapter 15 – Natural Resource and Energy Economics
12. Many demographers expect world population to:
13. Rapid population growth since 1800 has occurred primarily because of:
14. Which of the following statements is true about falling birthrates?
Chapter 15 – Natural Resource and Energy Economics
15. Which of the following nations has a total fertility rate that would suggest that its next
generation will only be half the size of the current generation?
16. Since 1850, the:
17. Why have commodity prices fallen since 1850?
Chapter 15 – Natural Resource and Energy Economics
18. The Economist magazine’s Commodities Price Index tracks the prices of the most:
19. World commodity prices over the past 150 years have:
20. Resource demand has grown over time:
Chapter 15 – Natural Resource and Energy Economics
21. Global resource demand has:
22. Over the past decade, U.S. per capita consumption of water:
23. Over the past two decades, total and per capita water use in the United States have:
Chapter 15 – Natural Resource and Energy Economics
24. Over the past decade, total and per capita trash generated in the United States have:
25. Average per capita water consumption in the U.S. was approximately how many gallons
per day in 2005?
26. For the past couple of decades, approximately how much trash per person per day has
been generated in the United States?
Chapter 15 – Natural Resource and Energy Economics
27. If per capita trash generation is constant over time, this implies that:
28. In energy economics, “BTU” stands for:
29. A BTU is the amount of energy needed to:
Chapter 15 – Natural Resource and Energy Economics
30. Which of the following is true about U.S. energy consumption and per capita real GDP
since 1988?
31. In the United States in 2008, one million BTUs of energy yielded _______ worth of goods
and services (in year 2000 dollars).
32. Since 1950, the energy efficiency of the United States economy in terms of producing
goods and services has:
Chapter 15 – Natural Resource and Energy Economics
33. ACME Corporation used to produce $50 worth of goods (in year 2000 dollars) per million
BTUs used. Now it produces $60 worth of goods (in year 2000 dollars) per million BTUs.
Based on this, we can conclude:
34. To achieve economic efficiency in energy use, an economy:
35. Power plants with the lowest operating costs tend to:
Chapter 15 – Natural Resource and Energy Economics
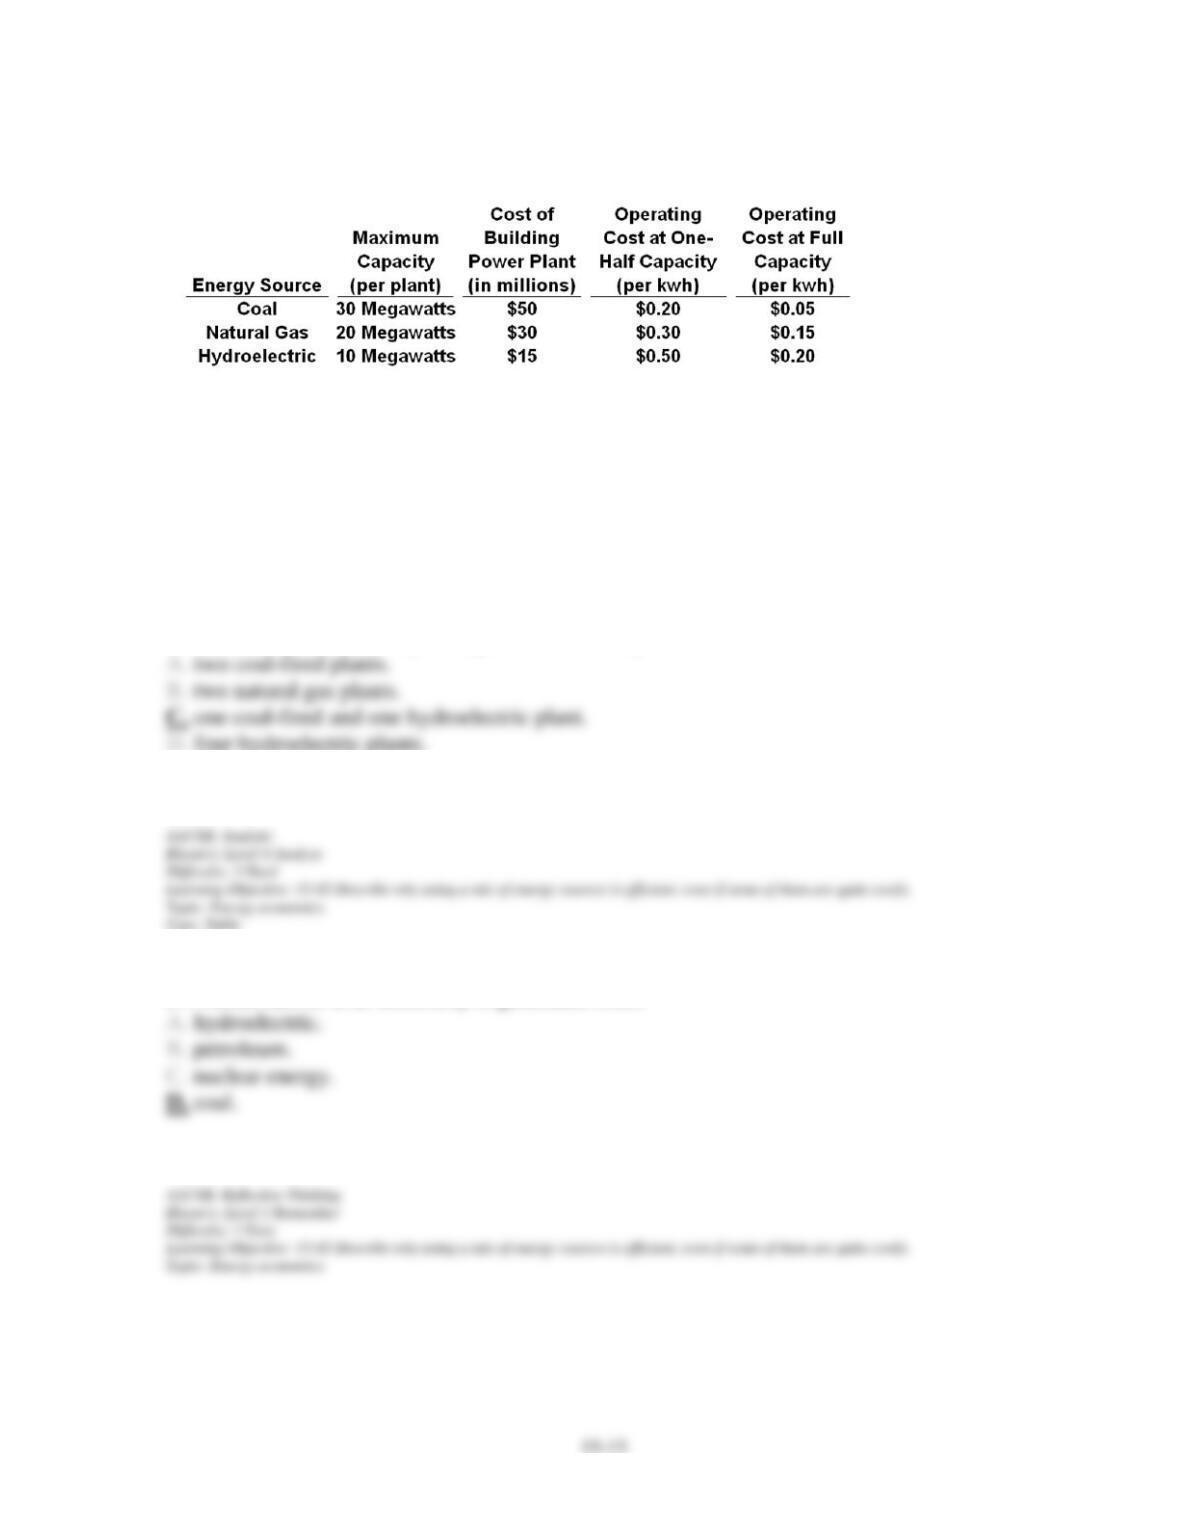
36. Suppose that a city’s energy demand is 30 megawatts during off-peak times, and 40
megawatts at its peak. The city has been purchasing electricity from an outside company but
has decided to build its own power plants to satisfy all of its energy demand. The city can
choose to build one or more plants to generate the needed electricity. There are three types of
plant: coal, natural gas, and hydroelectric. The three types of plants face the costs appearing in
the table above. Assuming the city’s power needs will not change in the foreseeable future, to
achieve the lowest cost of power generation the city should build:
37. About half of U.S. electricity is generated from:
Chapter 15 – Natural Resource and Energy Economics
38. In 2008, the primary sources of U.S. electricity generation, in order from largest to
smallest, were:
39. Other things equal, biodiesel becomes economically viable (as or less costly than using
oil) when oil prices reach _____ or more per barrel.
40. Other things equal, ethanol made from corn becomes economically viable (as or less
costly than using oil) when oil prices reach _____ or more per barrel.
Chapter 15 – Natural Resource and Energy Economics
41. Other things equal, extracting oil from shale becomes economically viable (as or less
costly than using conventionally extracted oil) when oil prices reach _____ or more per
barrel.
42. Alternative fuels become more economically viable as:
43. Which of the following is considered a renewable natural resource?

Chapter 15 – Natural Resource and Energy Economics
44. Which of the following is considered a renewable natural resource?
45. Which of the following is considered a non-renewable natural resource?
46. Which of the following is considered a non-renewable natural resource?
Chapter 15 – Natural Resource and Energy Economics
47. Productive inputs capable of replacing themselves if harvested at moderate rates are
known as:
48. Productive inputs that are actually or virtually fixed in supply are known as:
49. According to the concept of present value, a $50 barrel of oil today is worth:
Chapter 15 – Natural Resource and Energy Economics
50. Unless people can benefit from conservation, there is a temptation to:
51. When the benefits of conservation and future use are excluded from a cost-benefit
analysis, there is a tendency to:
52. The user cost of extracting a non-renewable resource is:
Chapter 15 – Natural Resource and Energy Economics
15–19
53. The user cost of extracting a non-renewable resource is:
54. The cost of not being able to extract and sell a non-renewable resource in the future
(because it is being extracted in the present) is known by natural resource economists as the:
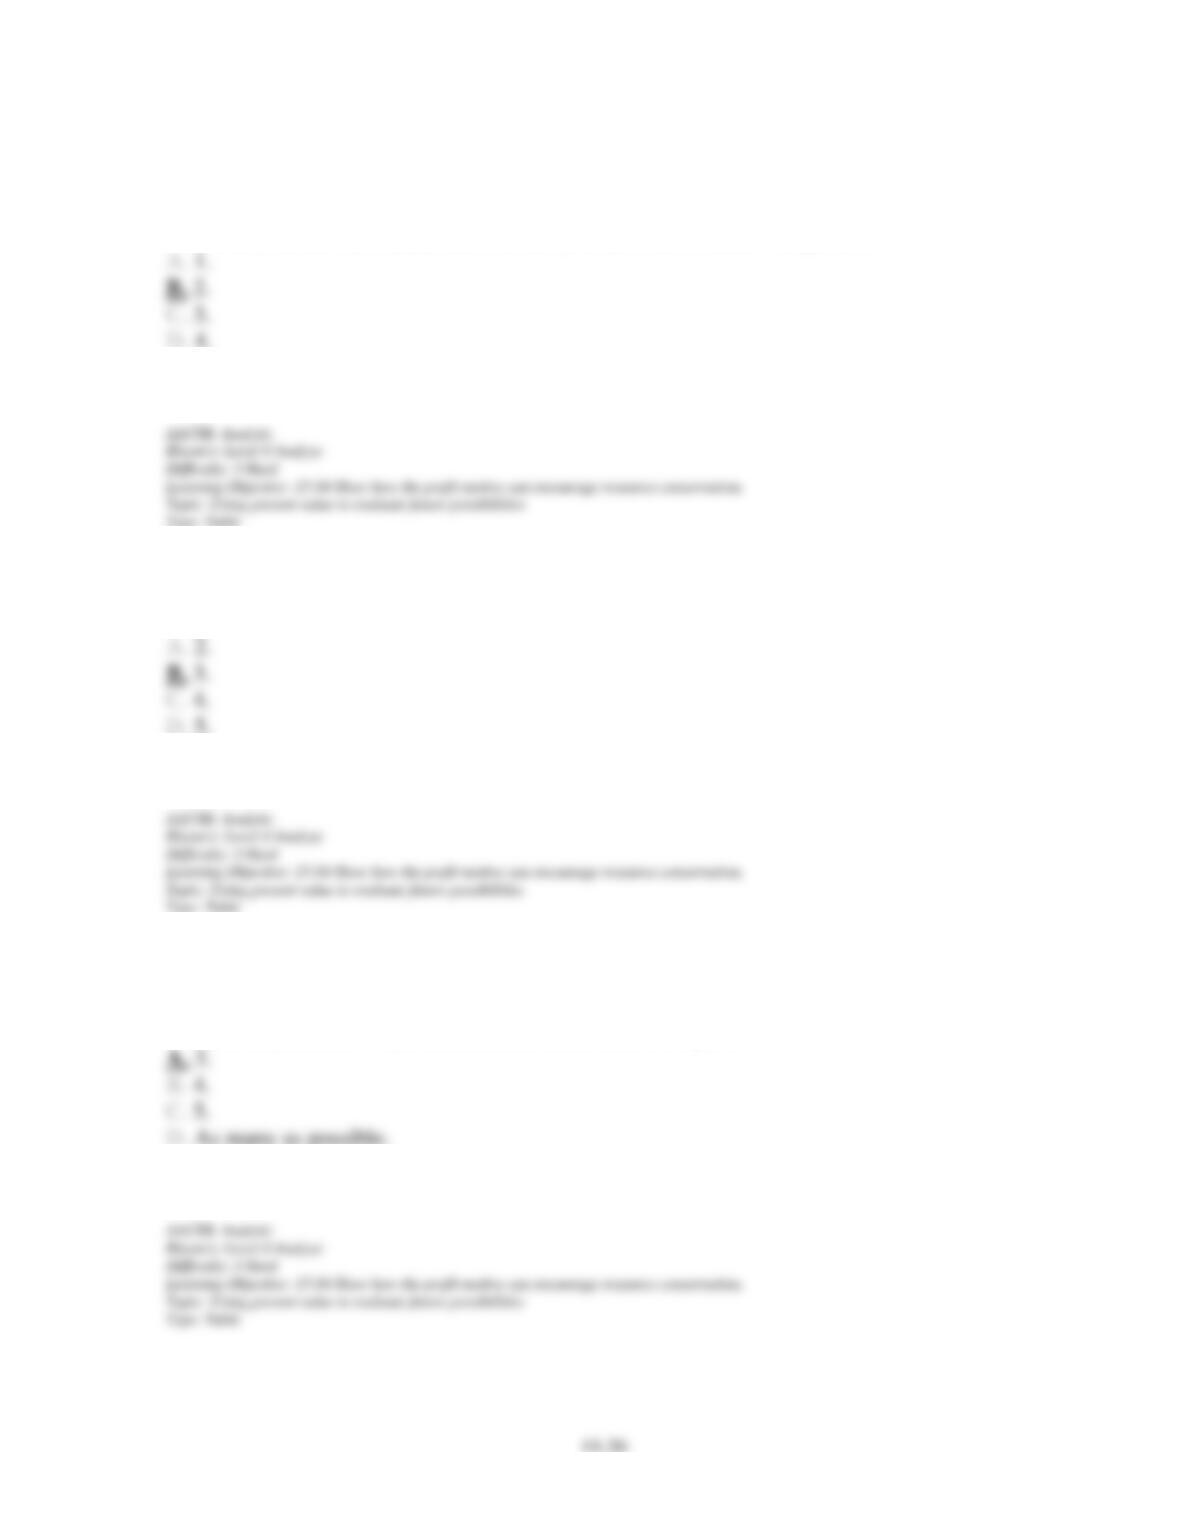
The table below shows the quantity of gold bars (Qb) in thousands, the extraction cost for
each thousand bars (in millions of dollars), and user cost of each thousand bars (in millions of
dollars) facing the OZ Mining Company this year.
Chapter 15 – Natural Resource and Energy Economics
55. Refer to the data above. If the current price of a bar of gold is $25,000, how many bars (in
thousands) should OZ extract and sell this year in order to maximize profits?
56. Refer to the data above. If the price of a bar of gold is $30,000 this year, how many bars
(in thousands) should OZ extract and sell?
57. Refer to the data above. Suppose that a new government regulation is going to shut down
OZ’s mining operation 1 year from now. If the current price per bar of gold is $25,000, how
many bars (in thousands) should OZ extract and sell this year?