71. Refer to Figure 15–3. Which panel could represent the demand curve facing a soybean farmer?
a.
Panel A
b.
Panel B
c.
Panel C
d.
Panel D
72. Refer to Figure 15–3. Which panel could represent the demand curve facing the soybean industry?
a.
Panel A
b.
Panel B
c.
Panel C
d.
Panel D
73. Refer to Figure 15–3. Which panel could represent the demand curve facing a local cable television provider if that
firm in a monopolist?
a.
Panel A
b.
Panel B
c.
Panel C
d.
Panel D
Figure 15-4
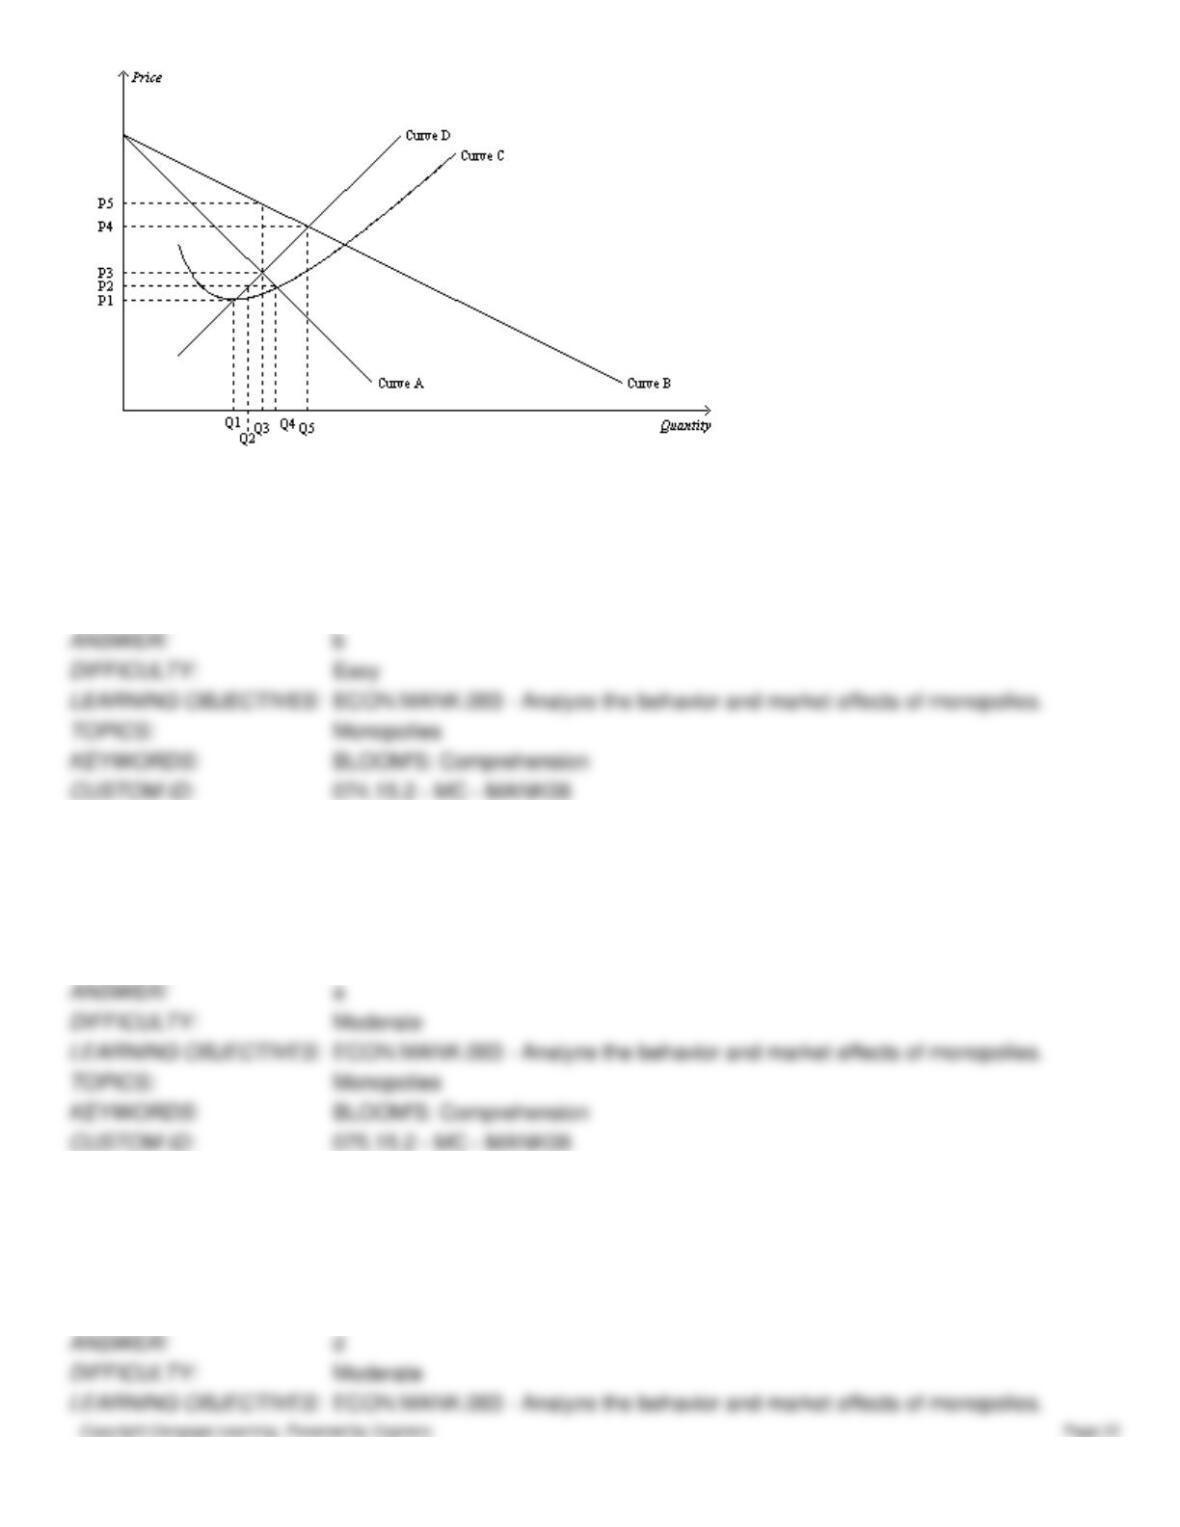
74. Refer to Figure 15-4. The demand curve for a monopoly firm is depicted by curve
a.
A.
b.
B.
c.
C.
d.
D.
75. Refer to Figure 15-4. The marginal revenue curve for a monopoly firm is depicted by curve
a.
A.
b.
B.
c.
C.
d.
D.
76. Refer to Figure 15-4. The marginal cost curve for a monopoly firm is depicted by curve
a.
A.
b.
B.
c.
C.
d.
D.
77. Refer to Figure 15-4. The average total cost curve for a monopoly firm is depicted by curve
a.
A.
b.
B.
c.
C.
d.
D.
78. Refer to Figure 15-4. If the monopoly firm is currently producing Q4 units of output, then a decrease in output will
necessarily cause profit to
a.
remain unchanged.
b.
decrease.
c.
increase as long as the new level of output is at least Q2.
d.
None of the above is correct. The monopolist currently maximizing profits at Q4.
79. Refer to Figure 15-4. If the monopoly firm is currently producing Q3 units of output, then a decrease in output will
necessarily cause profit to
a.
remain unchanged.
b.
decrease.
c.
increase as long as the new level of output is at least Q2.
d.
increase as long as the new level of output is at least Q1.
80. Refer to Figure 15-4. Profit can always be increased by increasing the level of output by one unit if the monopolist is
currently operating at
(i)
Q1.
(ii)
Q2.
(iii)
Q3.
(iv)
Q4.
a.
(ii) only
b.
(i) or (ii) only
c.
(i) only
d.
(i), (ii), or (iii) only
81. Refer to Figure 15-4. If the monopoly firm wants to maximize its profit, it should operate at a level of output equal to
a.
Q1.
b.
Q2.
c.
Q3.
d.
Q4.
82. Refer to Figure 15-4. Profit will be maximized by charging a price equal to
a.
P5.
b.
P4.
c.
P3.
d.
P1.
83. Refer to Figure 15-4. A profit-maximizing monopoly’s total revenue is equal to
a.
P5 x Q3.
b.
P4 x Q5.
c.
(P5-P3) x Q3.
d.
(P5-P4) x Q3.
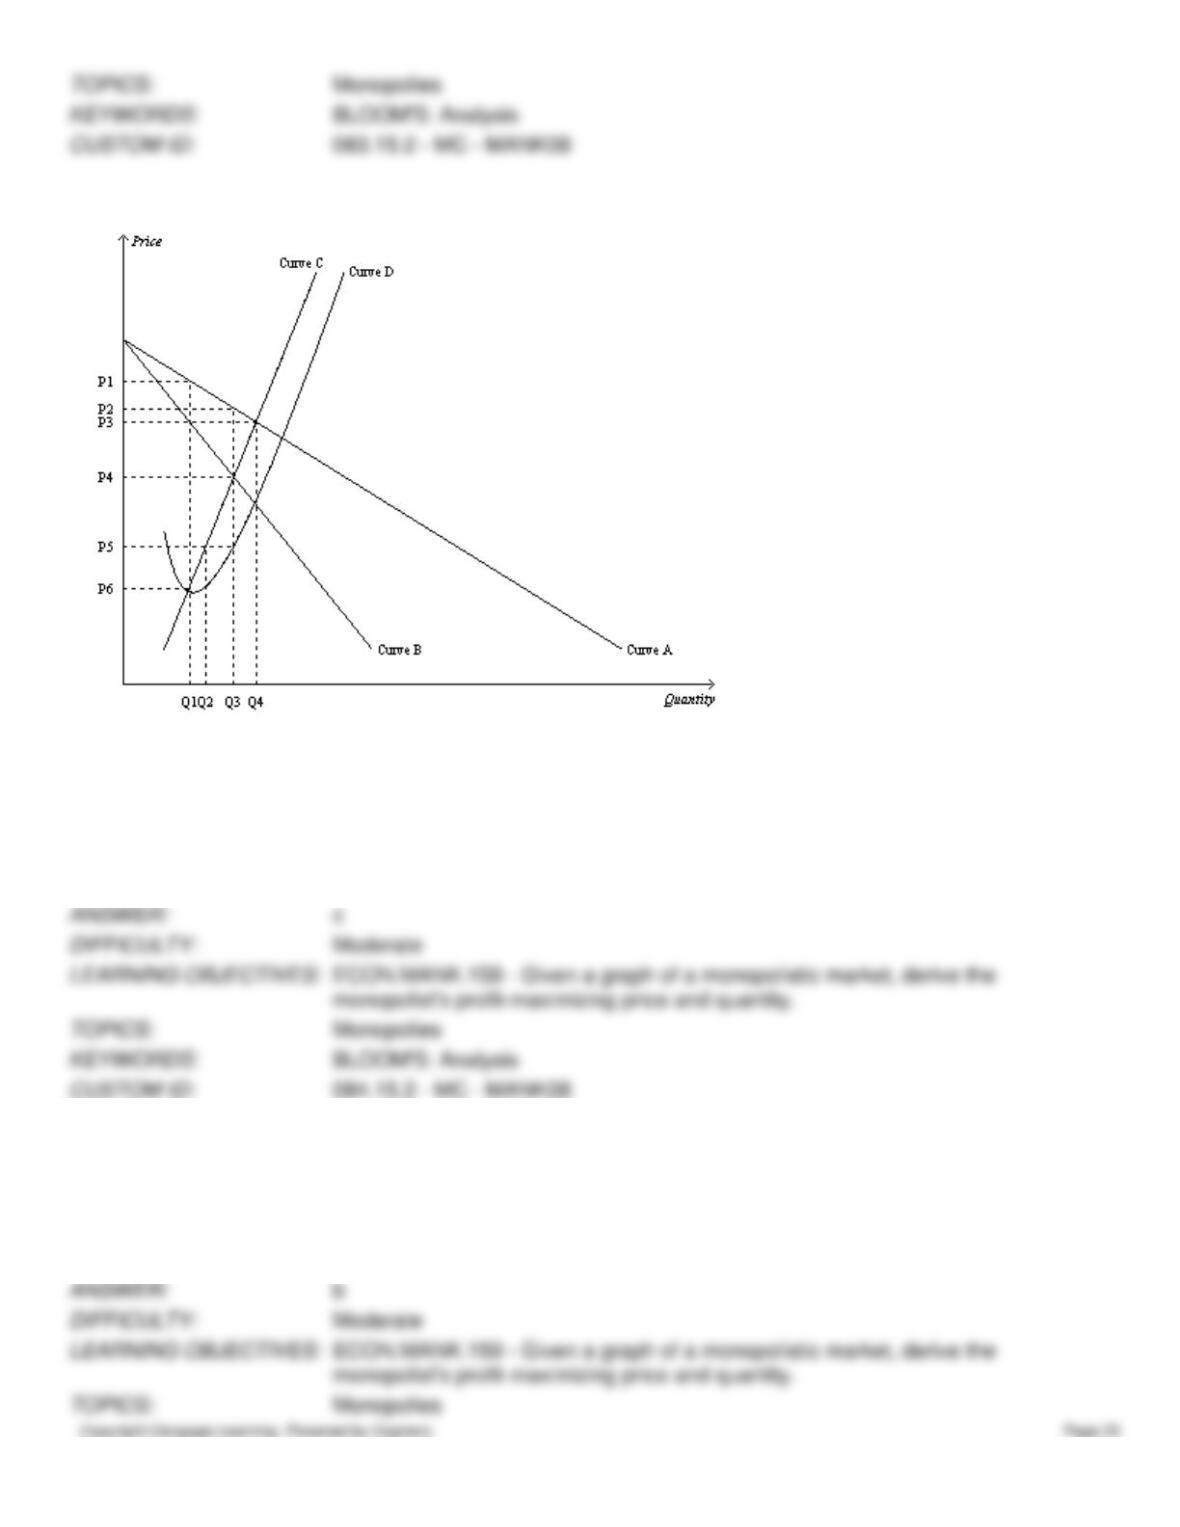
Figure 15-5
84. Refer to Figure 15-5. A profit-maximizing monopoly will produce an output level of
a.
Q1.
b.
Q2.
c.
Q3.
d.
Q4.
85. Refer to Figure 15-5. A profit-maximizing monopoly will charge a price of
a.
P1.
b.
P2.
c.
P3.
d.
P4.
86. Refer to Figure 15-5. A profit-maximizing monopoly’s total revenue is equal to
a.
P1 x Q1.
b.
P2 x Q3.
c.
P3 x Q4.
d.
(P2-P4) x Q3.
87. Refer to Figure 15-5. A profit-maximizing monopoly’s total cost is equal to
a.
P2 x Q3.
b.
P4 x Q3.
c.
P5 x Q3.
d.
(P2-P5) x Q3.
88. Refer to Figure 15-5. A profit-maximizing monopoly’s profit is equal to
a.
P2 x Q3.
b.
(P2-P4) x Q3.
c.
(P2-P5) x Q3.
d.
(P1-P6) x Q1.
89. Refer to Figure 15-5. Profit on a typical unit sold for a profit-maximizing monopoly would equal
a.
P1-P6.
b.
P2-P4.
c.
P2-P5.
d.
P2-P3.
90. Refer to Figure 15-5. At the profit-maximizing level of output,
a.
marginal revenue is equal to P3.
b.
marginal cost is equal to P3.
c.
average revenue is equal to P2.
d.
average total cost is equal to P6.
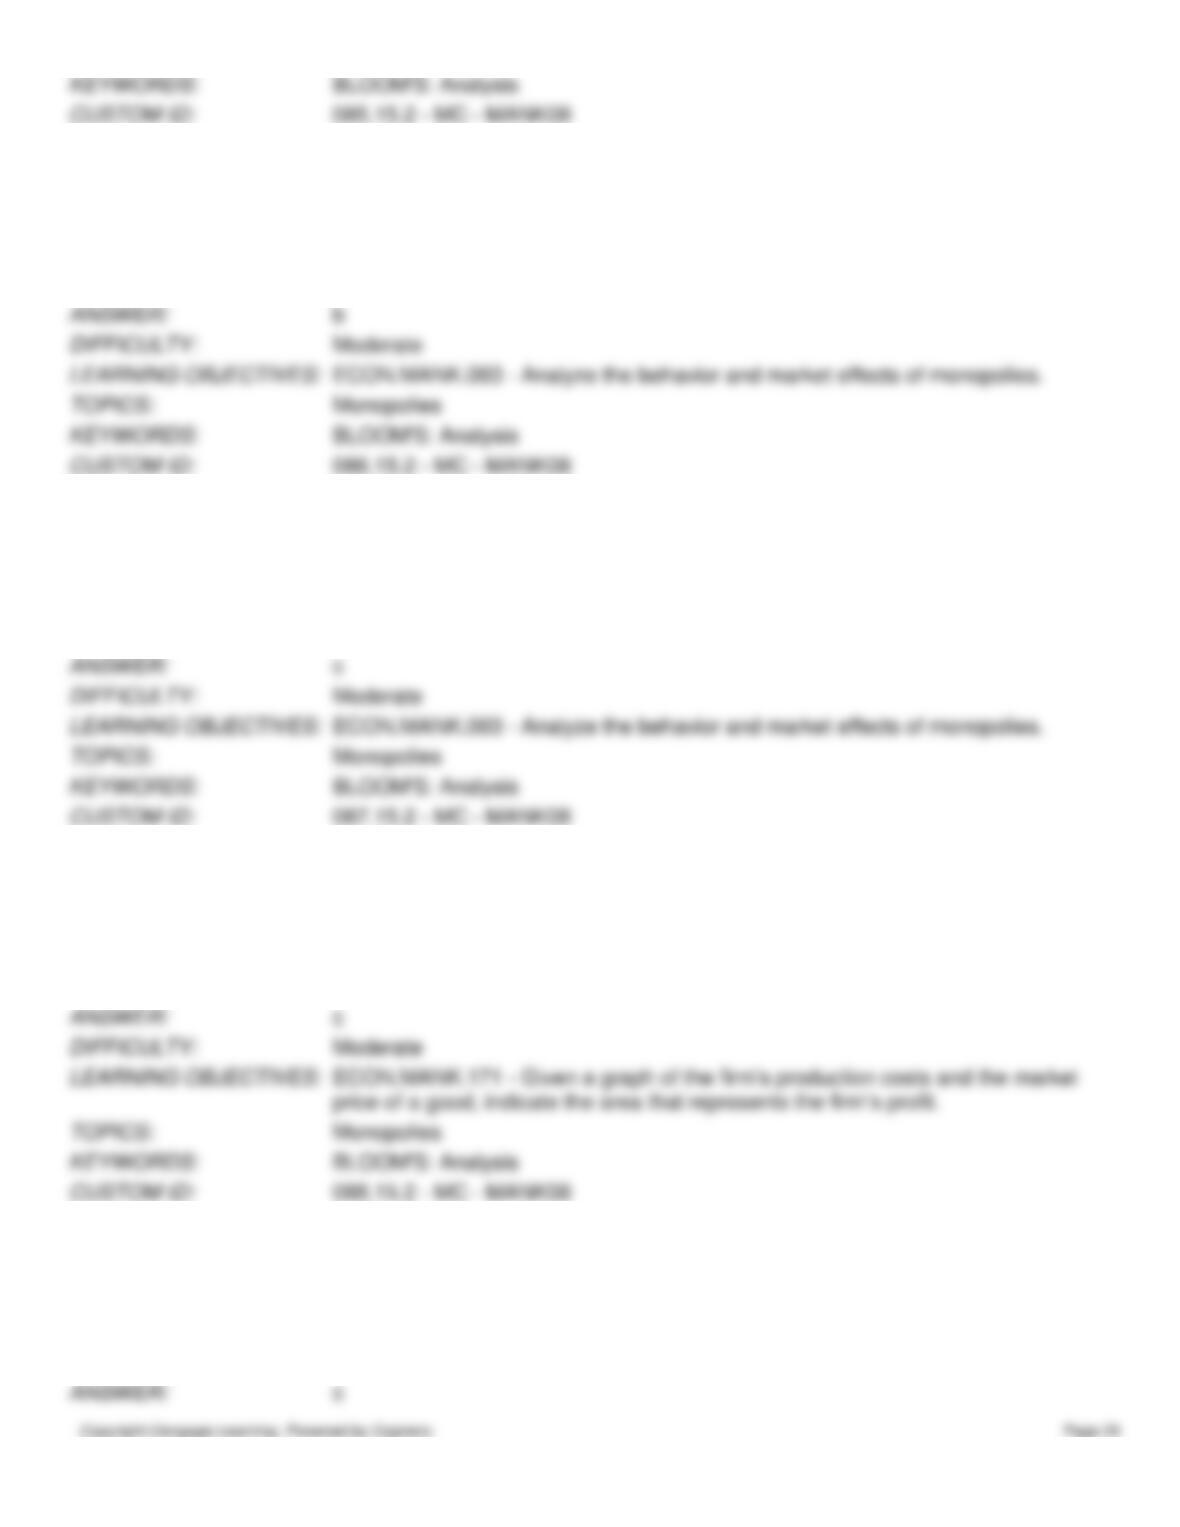
Figure 15-6
91. Refer to Figure 15–6. What price will the monopolist charge?
a.
A
b.
C
c.
K
d.
L
92. Refer to Figure 15–6. How much output will the monopolist produce?
a.
O
b.
T
c.
W
d.
Z
93. Refer to Figure 15–6. What area measures the monopolist’s profit?
a.
(K-C)*W
b.
(L-A)*T
c.
(K-B)*W
d.
0.5[(K-C)*(Z-T)]
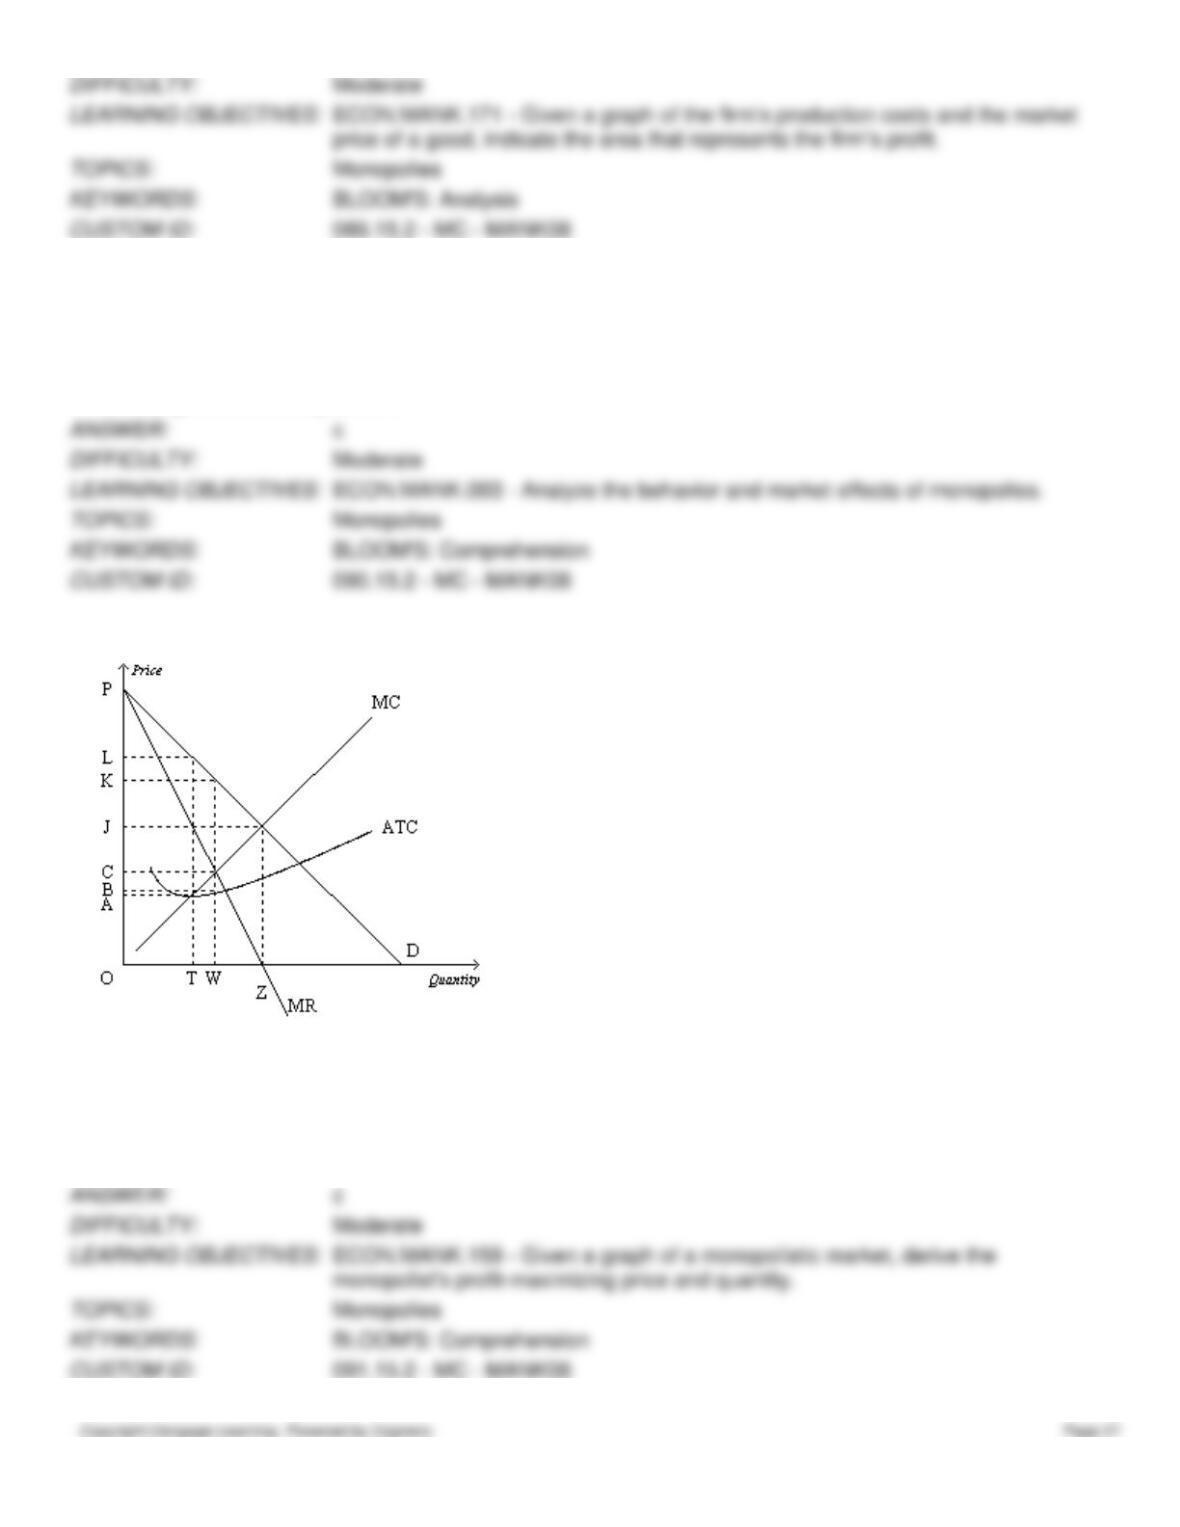
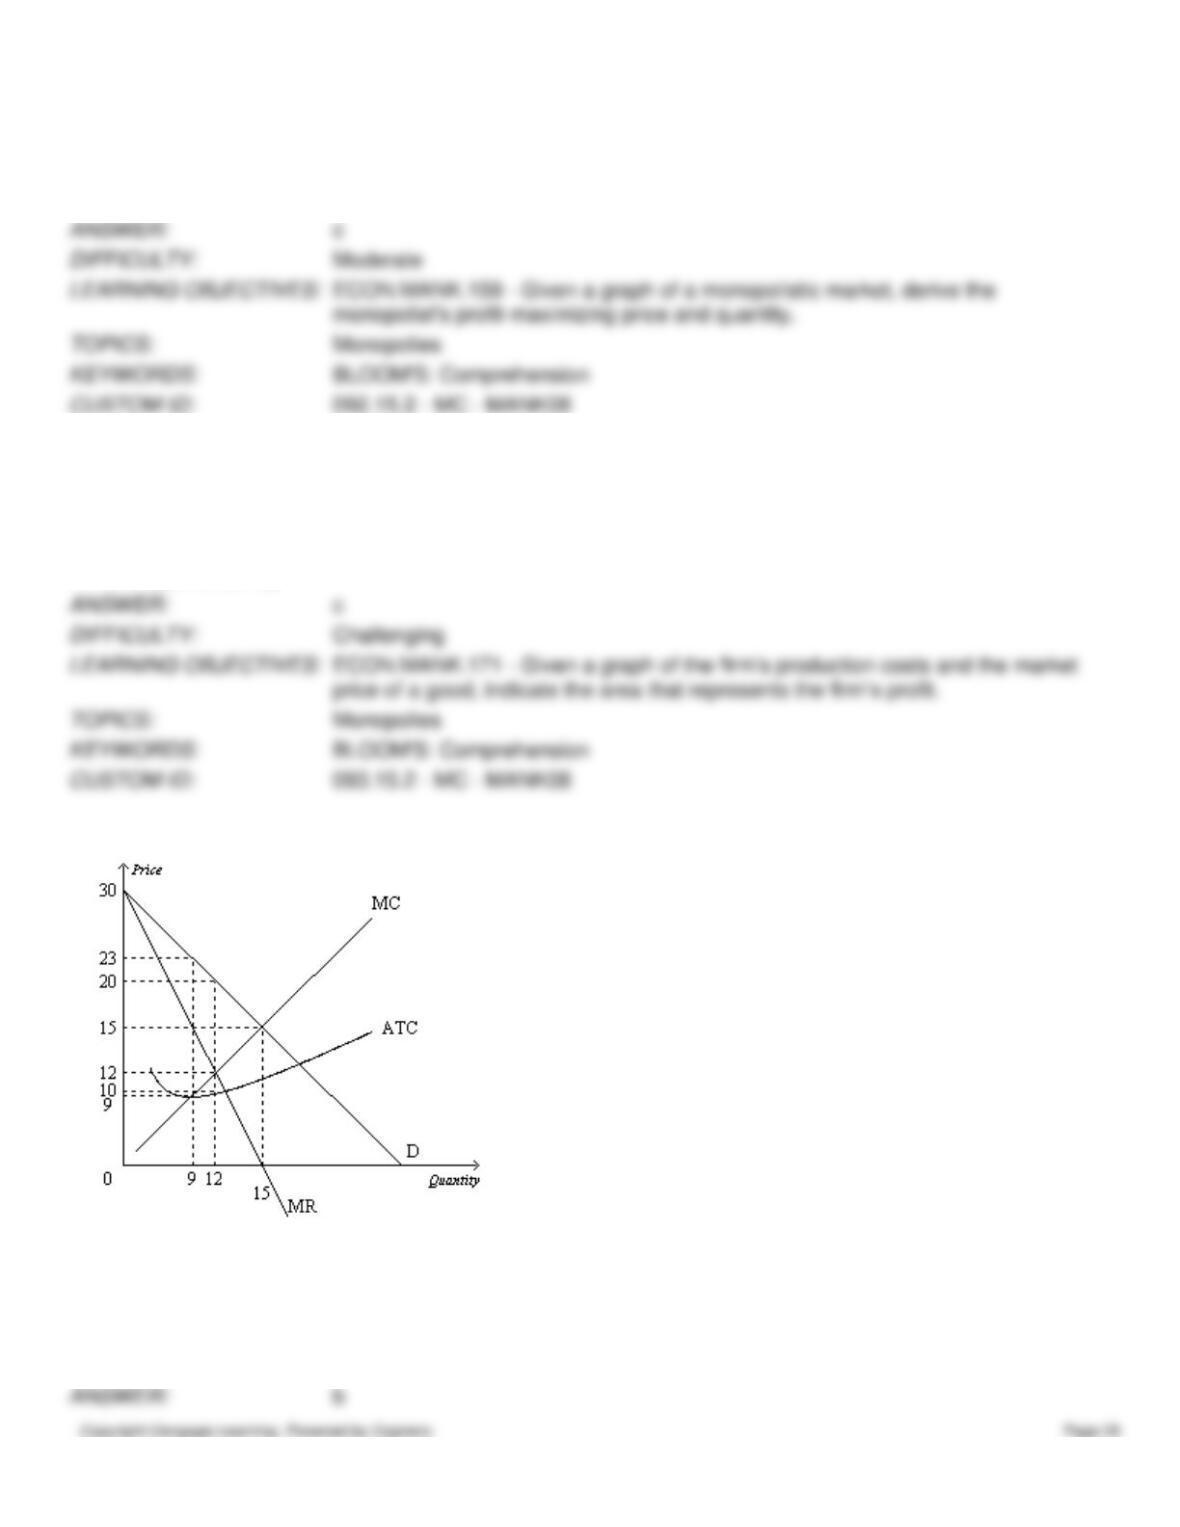
Figure 15-7
94. Refer to Figure 15–7. In order to maximize profits, the monopolist should produce
a.
9 units.
b.
12 units.
c.
15 units.
d.
more than 15 units.
95. Refer to Figure 15–7. In order to maximize profits, the monopolist should charge a price of
a.
$9.
b.
$12.
c.
$20.
d.
$23.
96. Refer to Figure 15–7. A profit-maximizing monopolist would earn total revenues of
a.
$81.
b.
$144.
c.
$225.
d.
$240.
97. Refer to Figure 15–7. A profit-maximizing monopolist would incur total costs of
a.
$81.
b.
$120.
c.
$144.
d.
$240.
98. Refer to Figure 15–7. A profit-maximizing monopolist would earn profits of
a.
$96.
b.
$117.
c.
$120.
d.
$126.
Table 15-1
Quantity
Price
Total
Revenue
Average
Revenue
Marginal
Revenue
1
$35
$35
2
$64
$32
$29
3
$29
4
$17
5
$23
$11
6
$120
7
$17
$-1
8
$-7
9
$99
$11
$-13
10
$80
$8
99. Refer to Table 15-1. If the monopolist sells 8 units of its product, how much total revenue will it receive from the
sale?
a.
$14
b.
$40
c.
$112
d.
$164
100. Refer to Table 15-1. If the monopolist wants to maximize its revenue, how many units of its product should it sell?
a.
4
b.
5
c.
6
d.
8
101. Refer to Table 15-1. When 4 units of output are produced and sold, what is average revenue?
a.
$17
b.
$21
c.
$23
d.
$26
102. Refer to Table 15-1. What is the marginal revenue for the monopolist for the sixth unit sold?
a.
$3
b.
$5
c.
$11
d.
$17
103. Refer to Table 15-1. Assume this monopolist’s marginal cost is constant at $12. What quantity of output (Q) will it
produce and what price (P) will it charge?
a.
Q = 4, P = $29
b.
Q = 4, P = $26
c.
Q = 5, P = $23
d.
Q = 7, P = $17
Table 15-2
Tanya has the following demand curve for selling taffy. Assume that Tanya has a marginal cost of $3 per unit.
Price
Quantity
$10
1
$8
2
$6
3
$4
4
$2
5
104. Refer to Table 15-2. What is Tanya’s profit-maximizing level of output?
a.
1
b.
2
c.
3
d.
4
105. Refer to Table 15-2. What is Tanya’s profit-maximizing price?
a.
$2
b.
$4
c.
$6
d.
$8
Table 15-3
Consider the following demand and cost information for a monopoly.
Quantity
Price
Total Cost
0
$30
$3
1
$25
$7
2
$20
$12
3
$15
$18
4
$10
$25
106. Refer to Table 15-3. The marginal revenue of the 2nd unit is
a.
$10.
b.
$15.
c.
$20.
d.
$25.
107. Refer to Table 15-3. The marginal cost of the 4th unit is
a.
$7.
b.
$12.
c.
$25.
d.
$60.
108. Refer to Table 15-3. The maximum profit this monopolist can earn is
a.
$5.
b.
$15.
c.
$16.
d.
$28.
109. Refer to Table 15-3. To maximize profit, the monopolist sets price at
a.
$10.
b.
$15.
c.
$20.
d.
$25.
Table 15-4
A monopolist faces the following demand curve:
Price
Quantity
$30
0
$25
2.5
$20
5
$15
7.5
$10
10
$5
12.5
$0
15
110. Refer to Table 15–4. If the monopolist produces 10 units, what is its average revenue?
a.
$100
b.
$15
c.
$10
d.
$1
111. Refer to Table 15–4. If the monopolist produces 5 units, what is its average revenue?
a.
$100
b.
$20
c.
$5
d.
$4
112. Refer to Table 15–4. If the monopolist increases production from 7.5 to 10 units, what is its marginal revenue?
a.
$12.50
b.
$5
c.
–$5
d.
-$12.50
113. Refer to Table 15–4. If the monopolist increases production from 2.5 to 5 units, what is its marginal revenue?
a.
$100
b.
$37.5
c.
$15
d.
$2.50
114. Refer to Table 15–4. The monopolist will not produce
a.
5 units or fewer under any circumstances.
b.
7.5 units or fewer under any circumstances.
c.
7.5 units or more under any circumstances.
d.
10 units or more under any circumstances.
115. Refer to Table 15–4. In order to maximize total revenues, the monopolist should produce
a.
5 units.
b.
7.5 units.
c.
10 units.
d.
12.5 units.
116. Refer to Table 15–4. In order to maximize profits, the monopolist should produce
a.
7.5 units.
b.
10 units.
c.
where marginal revenue equals marginal cost.
d.
Both a and c are correct.
Table 15-5
A monopolist faces the following demand curve:
Price
Quantity
$51
1
$47
2
$42
3
$36
4
$29
5
$21
6
$12
7
117. Refer to Table 15–5. The monopolist has total fixed costs of $60 and has a constant marginal cost of $15. What is
the profit-maximizing level of production?
a.
2 units
b.
3 units
c.
4 units
d.
5 units
118. Refer to Table 15–5. The monopolist has total fixed costs of $60 and has a constant marginal cost of $15. What is
the profit-maximizing price?
a.
$4
b.
$39
c.
$36
d.
$42
Table 15-6
A monopolist faces the following demand curve:
Quantity
Price
1
$15
2
$12
3
$9
4
$6
5
$3
119. Refer to Table 15–6. What is the marginal revenue from the sale of the 2nd unit?
a.
–$3
b.
$3
c.
$9
d.
$24
120. Refer to Table 15–6. What is the marginal revenue from the sale of the 3rd unit?
a.
–$3
b.
$3
c.
$9
d.
$24
121. Refer to Table 15–6. What is the marginal revenue from the sale of the 4th unit?
a.
–$3
b.
$3
c.
$9
d.
$24
122. Refer to Table 15–6. If the monopolist has a constant marginal cost for her product equal to $7, what is her profit-
maximizing price?
a.
$6
b.
$9
c.
$12
d.
$15
123. Refer to Table 15–6. Suppose the monopolist has total fixed costs equal to $5 and a variable cost equal to $4 per unit
for all units produced. What is the profit-maximizing price?
a.
$6
b.
$9
c.
$12
d.
$15
124. Refer to Table 15–6. Suppose the monopolist has total fixed costs equal to $5 and a variable cost equal to $4 per unit
for all units produced. What is the total profit if she operates at her profit-maximizing price?
a.
$1
b.
$7
c.
$9
d.
$11
125. Refer to Table 15–6. Suppose the monopolist has total fixed costs equal to $5 and a variable cost equal to $4 per unit
for all units produced. What would the total profit be if she charged $6 per unit for her product?
a.
$1
b.
$3
c.
$8
d.
$15
Table 15-7
Sally owns the only shoe store in town. She has the following cost and revenue information.
COSTS
REVENUES
Quantity
Produced
(pairs)
Total Cost
($)
Marginal
Cost
Quantity
Demanded
Price
($/unit)
Total
Revenue
Marginal
Revenue
0
100
—
0
170
—
1
140
1
160
2
184
2
150
3
230
3
140
4
280
4
130
5
335
5
120
6
395
6
110
7
475
7
100
8
565
8
90
126. Refer to Table 15-7. What is the marginal cost of the 6th pair of shoes?
a.
$44
b.
$46
c.
$55
d.
$60
127. Refer to Table 15-7. What is the marginal cost of the 8th pair of shoes?
a.
$50
b.
$60
c.
$90
d.
$110
128. Refer to Table 15-7. What is the total revenue from selling 6 pairs of shoes?
a.
$100
b.
$600
c.
$625
d.
$660

129. Refer to Table 15-7. What is the total revenue from selling 8 pairs of shoes?
a.
$90
b.
$695
c.
$720
d.
$800
130. Refer to Table 15-7. What is the marginal revenue from selling the 2nd pair of shoes?
a.
$140
b.
$150
c.
$160
d.
$170
131. Refer to Table 15-7. What is the marginal revenue from selling the 8th pair of shoes?
a.
$10
b.
$20
c.
$40
d.
$90
132. Refer to Table 15-7. What is the average revenue when Sally sells 7 pairs of shoes?
a.
$40
b.
$90
c.
$100
d.
$700