76. The Earned Income Tax Credit
a.
tends to increase income inequality.
b.
is a program that provides additional income to workers with above-average incomes.
c.
tends to reduce income inequality.
d.
is both a and b.
77. Which of the following is true of the tax and transfer programs of the United States?
a.
Tax-transfer programs persistently redistribute income from the rich to the poor.
b.
Social Security, the largest transfer program, redirects income toward the elderly, a group
with above-average levels of both income and wealth.
c.
The bulk of agriculture subsidies go to large farmers with above-average incomes.
d.
Taxes generally take a larger share of the income of the poor than is true for those with
higher incomes.
e.
Both b and c are true.
78. Which of the following is true?
a.
The size of the economic pie to be divided among a country’s residents is fixed.
b.
Government tax and transfer programs have exerted a strong equalizing impact on the
distribution of income in the United States.
c.
The method of allocating income is relevant to the issue of fairness as well as the pattern
of income distribution.
d.
The optimal distribution of income can be determined by objective economic criteria.
79. Which of the following is true?
a.
The best distribution of income can be determined objectively.
b.
The transfer of income from one group to another is costly; it will generally reduce total
output.
c.
Positive economics can determine the variation in incomes that would be best for an
economy.
d.
The fairness of an income distribution is determined by its pattern (the measured degree of
income inequality).
e.
All of the above are true.
Figure 15-1
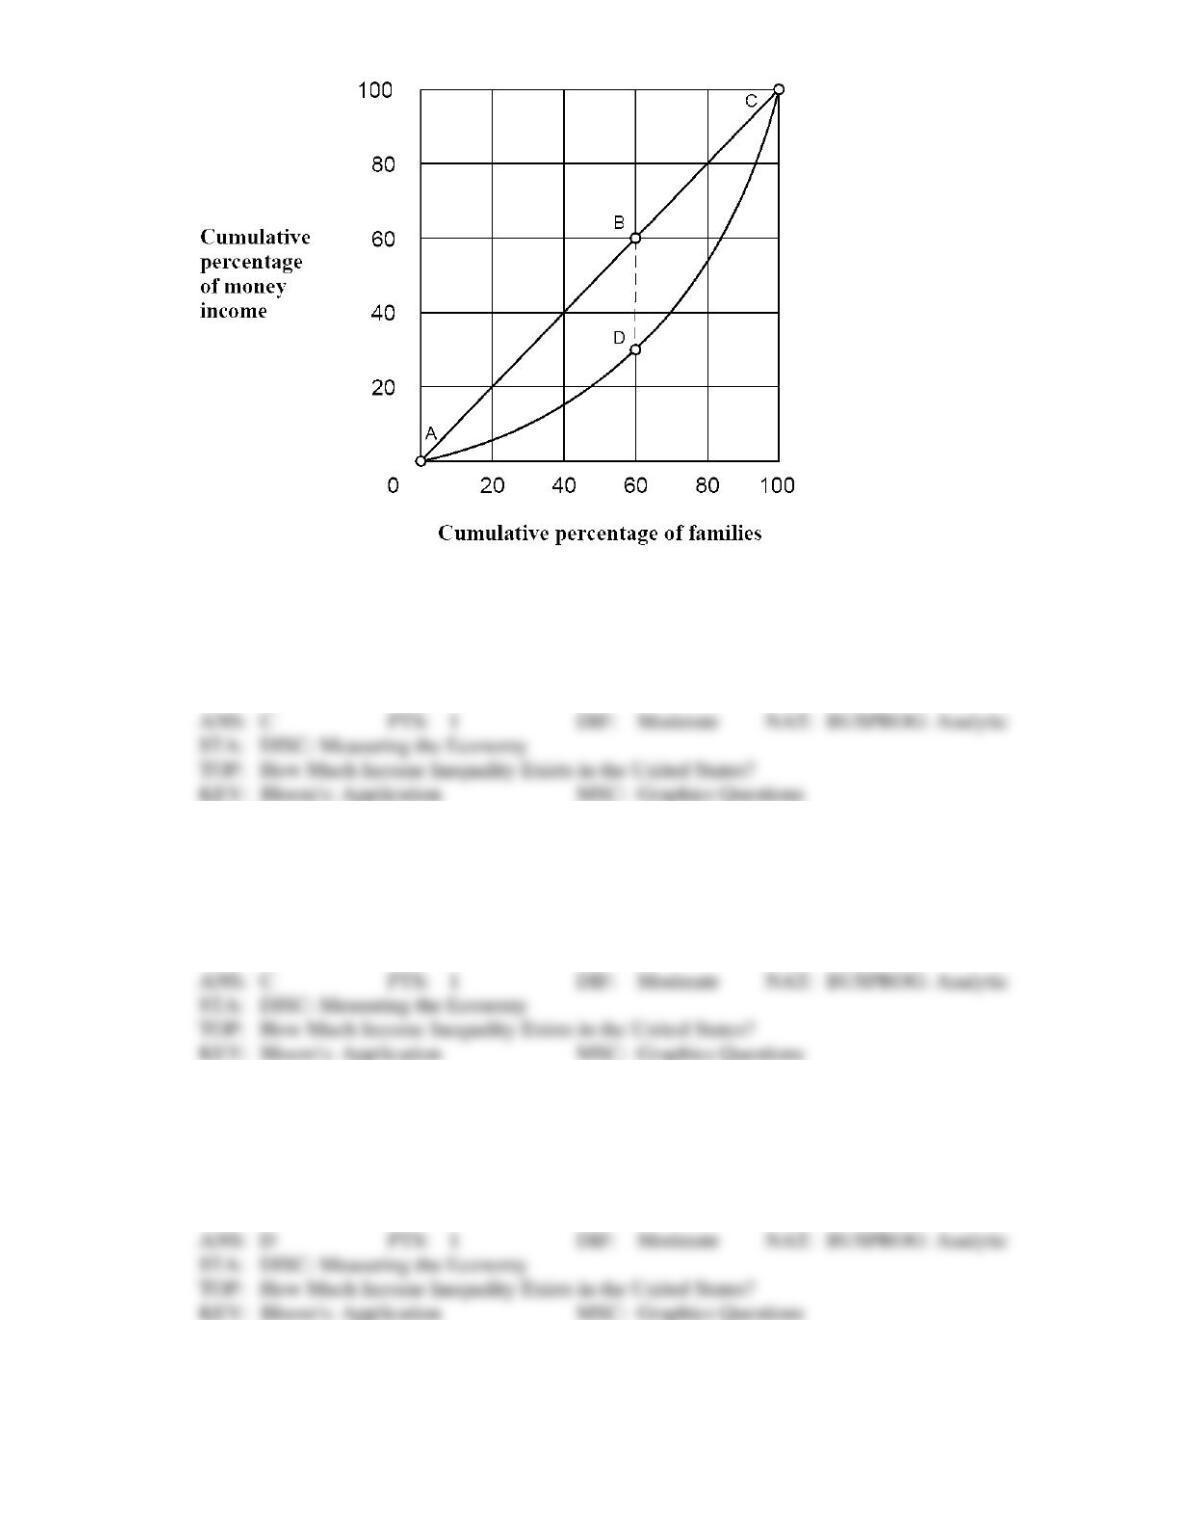
80. As shown in Figure 15-1, the perfect equality line is drawn between points
a.
A and B.
b.
B and D.
c.
A and C along the straight line.
d.
A and C along the curve.
81. As shown in Figure 15-1, 60 percent of families earned a cumulative share of about ____ of income.
a.
5 percent
b.
15 percent
c.
30 percent
d.
50 percent
82. As shown in Figure 15-1, 80 percent of families earned a cumulative share of about ____ of income.
a.
5 percent
b.
15 percent
c.
30 percent
d.
50 percent
83. As shown in Figure 15-1, the distance between points B and D means that 60 percent of families earn
less of total income than required for perfect equality.
a.
30 percent
b.
60 percent
c.
90 percent
d.
insufficient information to answer question.
84. As shown in Figure 15-1, the degree of unequal income distribution is measured by the area between
the
a.
Lorenz curve and the horizontal axis.
b.
Lorenz curve and the vertical axis.
c.
Perfect equality line and the origin.
d.
Perfect equality line and the Lorenz curve.
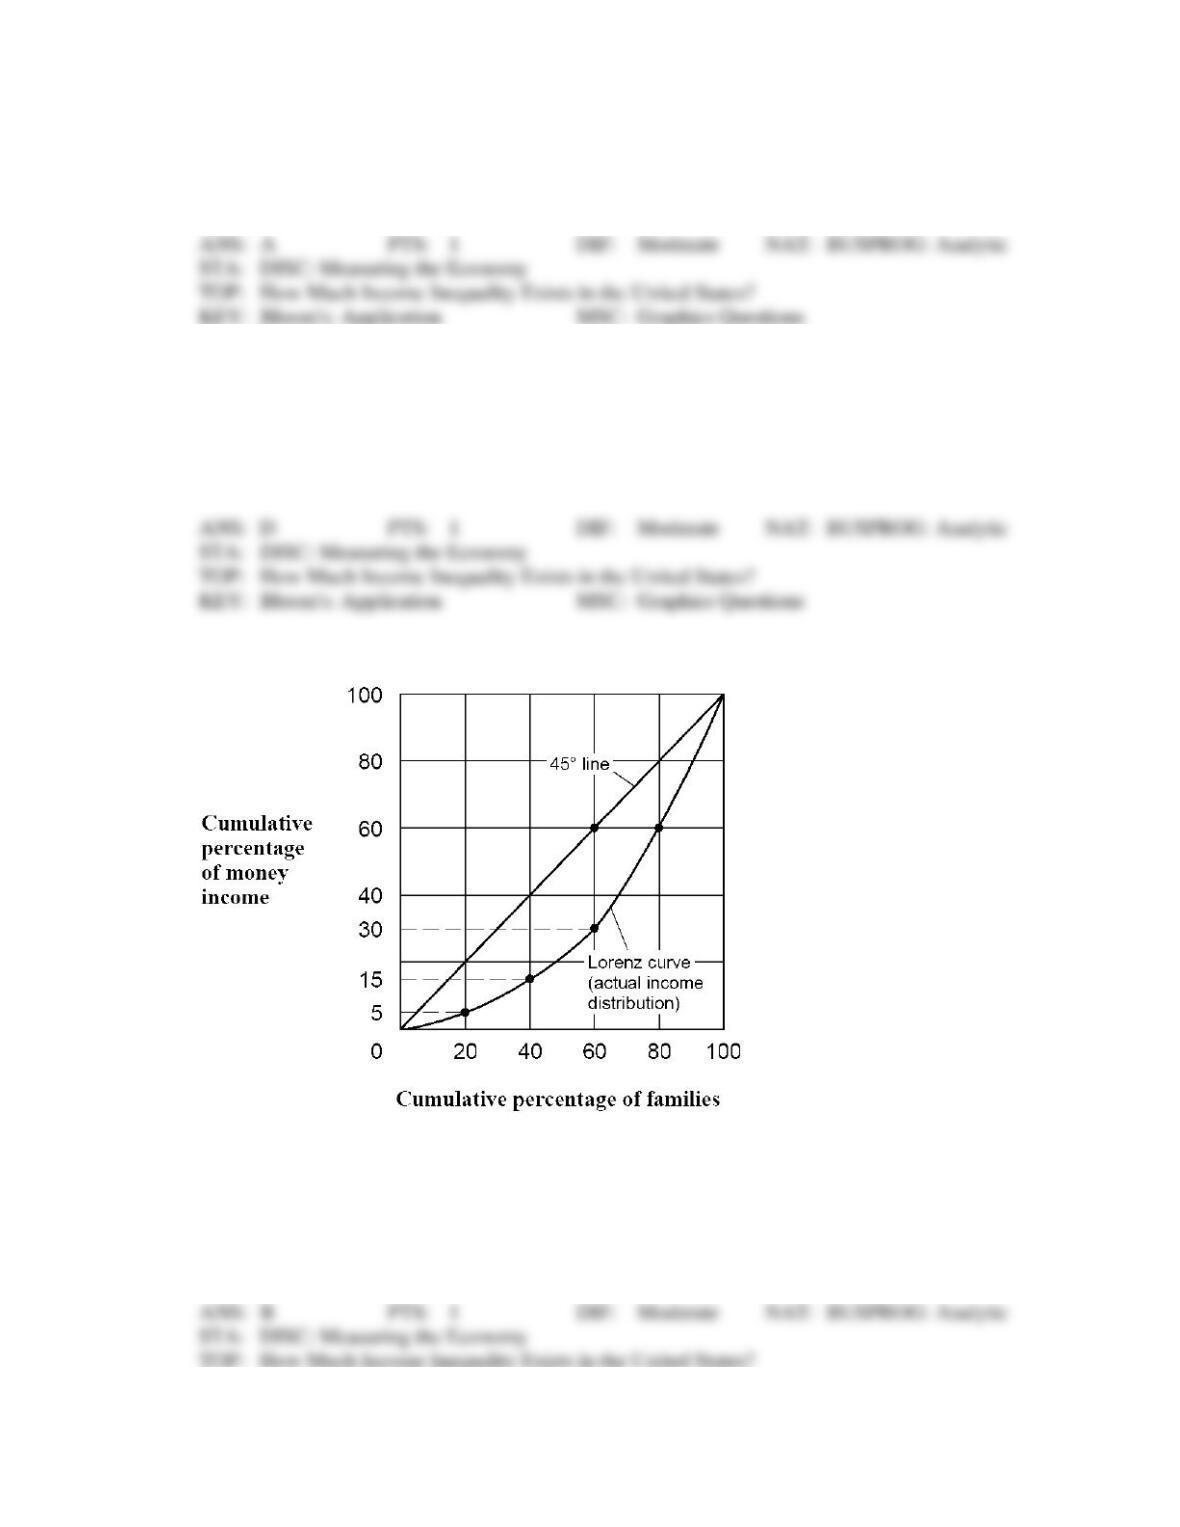
Figure 15-2
85. According to the Lorenz curve shown in Figure 15-2, what percentage of total income is earned by the
richest 20 percent of families?
a.
20 percent.
b.
40 percent.
c.
60 percent.
d.
80 percent.
86. If this economy’s distribution of income becomes more equal, then the Lorenz curve shown in Figure
15-2 will
a.
move closer to the 45 line.
b.
become more bowed outward.
c.
lie above the 45 line.
d.
shift down and to the right.
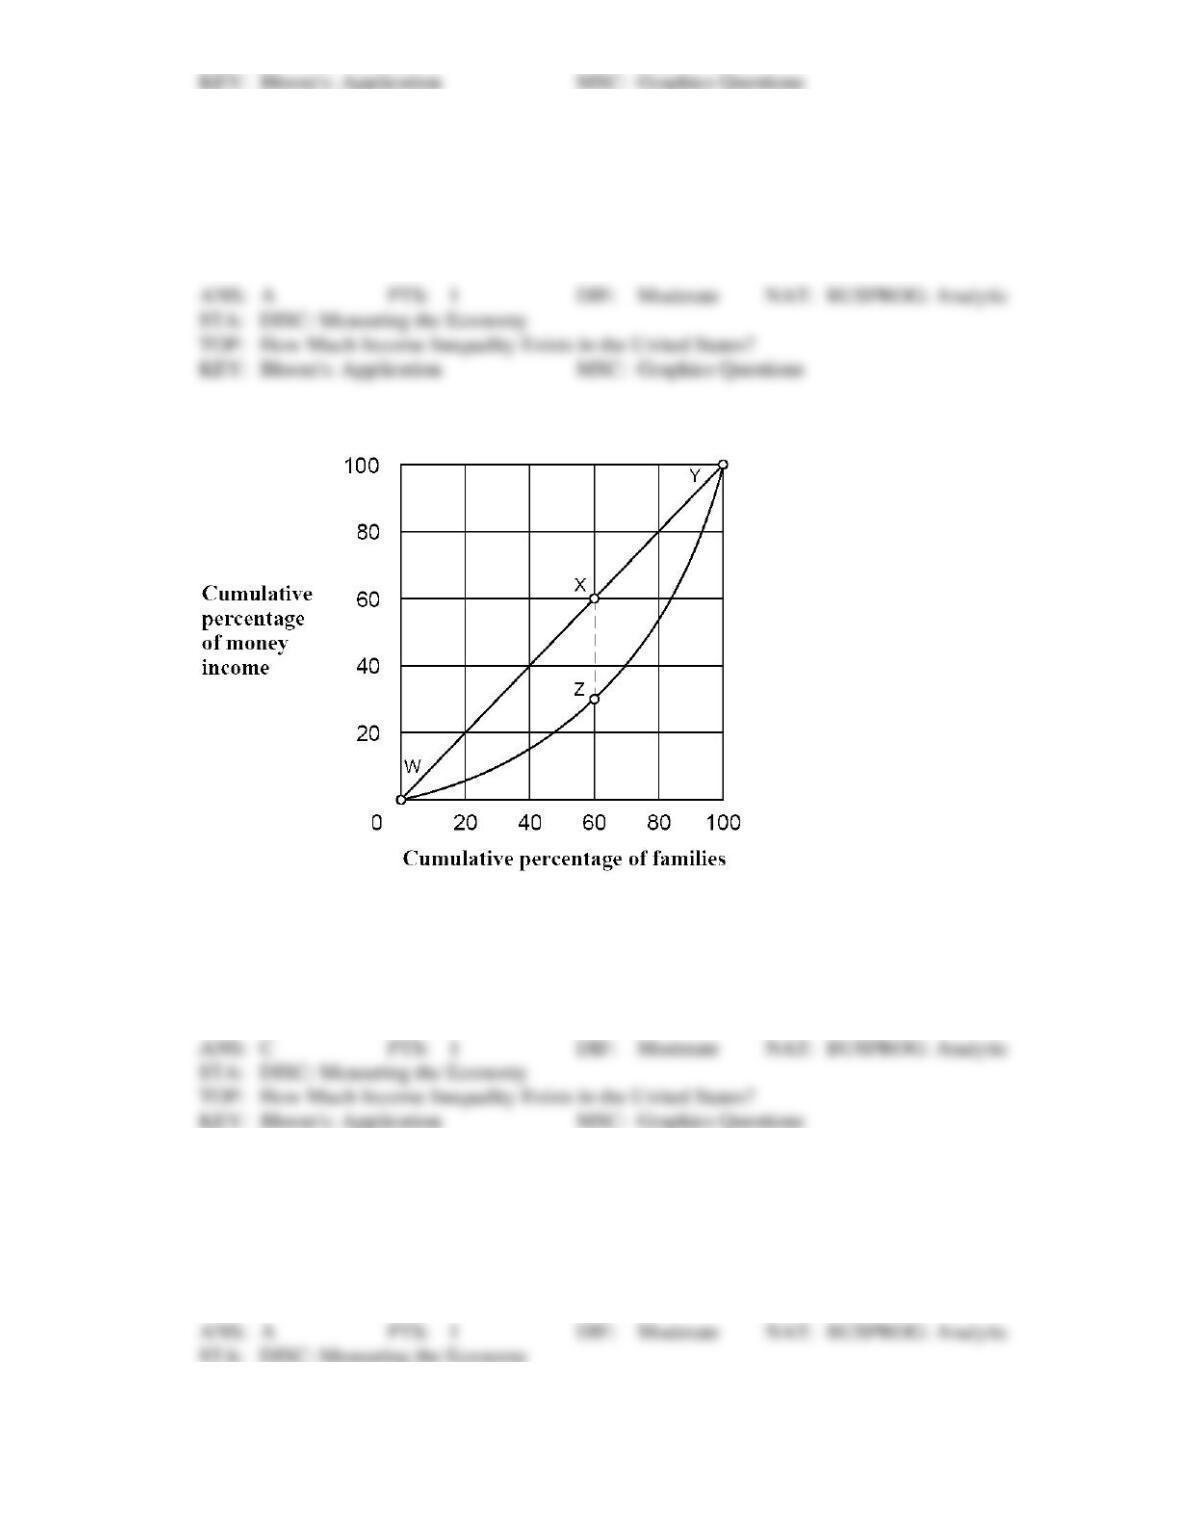
Figure 15-3
87. As shown in Figure 15-3, the perfect equality line is drawn between points
a.
W and Y along the curve.
b.
X and Z.
c.
W and Y along the straight line.
d.
W and X.
88. As shown in Figure 15-3, 20 percent of families earned a cumulative share of about ____ percent of
income.
a.
5
b.
10
c.
30
d.
50
89. As shown in Figure 15-3, 40 percent of families earned a cumulative share of about ____ percent of
income.
a.
5
b.
15
c.
30
d.
50
Figure 15-4
90. Figure 15-4 shows the Lorenz Curve for three countries, I, II, and III. Which of the following
statements is true?
a.
Country I has the most unequal income distribution.
b.
Country II has the most unequal income distribution.
c.
Country I has the most equal income distribution.
d.
Country III has the most equal income distribution.
e.
Country II has a more equal income distribution than Country I.
91. Figure 15-4 shows the Lorenz Curve for three countries, I, II, and III. Of the three countries shown,
a.
country III has the most unequal income distribution.
b.
country II has the most unequal income distribution.
c.
country I has the most unequal income distribution.
d.
country III has the most equal income distribution.
e.
country II has a more equal income distribution than Country I.
92. Over the past several decades, family incomes in the United States have
a.
become less equal.
b.
become more equal.
c.
maintained the same level of inequality.
d.
declined substantially for all families.
93. Which of the following is false about data on the inequality of annual family (or household) incomes?
a.
The degree of inequality is reduced when transfers and taxes are considered.
b.
The inequality in annual income data understates the true degree of inequality in lifetime
income.
c.
Differences in age and family characteristics contribute to the degree of inequality.
d.
The inequality in consumption spending across households is smaller than the inequality
in annual income.
94. Because the United States has a progressive tax system, the distribution of income after taking into
account the effects of taxes and transfers is
a.
less equal than the distribution of before-tax income.
b.
more equal than the distribution of before-tax income.
c.
exactly the same as the distribution of before-tax income.
d.
none of the above.
95. Which of the following has contributed to the rising income inequality in the United States?
a.
The proportion of single-parent families has increased.
b.
The proportion of dual-earner families has increased.
c.
Earnings differentials between skilled and less-skilled workers have increased.
d.
all of the above
96. Use the following two statements to answer this question.
(I) In a market system, resource prices both provide incentives for the efficient allocation of resources
and determine income distribution.
(II) Income and wealth are neither created nor destroyed, they are just fixed-sized pies to be allocated
among individuals.
a.
Both I and II are true.
b.
Both I and II are false.
c.
I is true; II is false.
d.
I is false; II is true.
97. (I) High implicit marginal tax rates reduce the incentive of the poor to earn.
(II) The Samaritan’s dilemma is that transfer programs lower the opportunity cost of activities that
lead to poverty.
a.
Both I and II are true.
b.
Both I and II are false.
c.
I is true; II is false.
d.
II is true; I is false.
98. Even if lifetime incomes were equal, there still might be substantial inequality in annual income data
because
a.
wage rates might differ substantially.
b.
some might have inherited their wealth.
c.
some might have retired, whereas others are prime-age earners.
d.
educational levels might differ substantially.
99. When deciding whether to classify a family as in poverty, official figures
a.
count all transfer and welfare benefits received by the family as income.
b.
do not count in-kind benefits in the calculation of the family’s income.
c.
do not count cash benefits in the calculation of the family’s income.
d.
do not count any transfer or welfare benefits as income.
100. (I) In 2009, a family of four making $22,050 would be considered living in poverty.
(II) The poverty threshold level of income is adjusted for family size and for inflation (price level
changes) through time.
a.
Both I and II are true.
b.
Both I and II are false.
c.
I is true; II is false.
d.
II is true; I is false.
101. Imagine two countries, Lebos and Egap, that have identical average annual incomes. In Lebos, the
poorest families one year almost always end up as the richest families the next year and become
middle-income families the year after that. In Egap, however, the poor remain poor and rich remain
rich. Which of the following is true about the two countries?
a.
The measured distribution of annual income in any given year is more equal in Lebos than
in Egap.
b.
The measured distribution of annual income in any given year is more equal in Egap than
in Lebos.
c.
The measured distribution of annual income in any given year will be the same in Lebos
and Egap.
d.
The distribution of lifetime income is more equal in Egap than in Lebos.
102. In a market economy,
a.
there is not a fixed economic pie to be divided among individuals, but rather income is
created by the individuals who earn it.
b.
differences in incomes provide individuals with an incentive to supply resources that are
highly valued by others.
c.
a person’s income is determined by the quantity and value of the resources that they supply
to the market.
d.
all of the above are true.
103. Compared to low-income families, high-income families tend to
a.
have smaller family sizes (fewer persons per family).
b.
have more workers per family.
c.
be headed by a person who has not completed high school.
d.
supply fewer weeks of work per year.
104. Since 1970, income inequality in the United States has
a.
decreased.
b.
increased.
c.
remained the same.
d.
increased throughout the 1970s and 1980s but fell during the 1990s.
105. Which of the following is true?
a.
The distribution of income after taxes and transfers is considered more equal than when
they are excluded.
b.
The distribution of lifetime income tends to be more unequal than the distribution of
annual income.
c.
The distribution of income has become more equal in recent years.
d.
Developed, industrialized countries generally tend to have higher income inequality than
less-developed countries.
106. Data on income inequality in the United States indicate that
a.
rich families stay rich and poor families stay poor through time.
b.
there is substantial movement among income groupings in the United States through time.
c.
most poor families never significantly rise above the poverty level, but rich families tend
to become less wealthy over time.
d.
most rich families remain rich, but most poor families move up in the income distribution
through time.
107. Which of the following is accurate regarding income statistics?
a.
Current annual income is also an accurate indicator of relative economic status over a
longer period, such as a decade or lifetime.
b.
Inequalities of income observed at one point in time with annual income data overstate the
degree of true income inequality in lifetime income.
c.
Recent studies indicate that the relative income position of a family generally determines
the relative income position of their children and grandchildren.
d.
High-income earners generally maintain their status year after year, whereas those with
low current incomes tend to stay poor year after year.
108. Transfers that are limited to persons or families with an income below a certain cut-off point are
referred to as
a.
means-tested income transfers.
b.
poverty transfers.
c.
Social Security transfers.
d.
cash income transfers.
109. How do the high implicit marginal tax rates that often occur when transfer payments are inversely
linked to earnings affect the incentive of poor people to work and earn?
a.
A poor person’s incentive to earn is increased.
b.
A poor person’s incentive to earn is reduced.
c.
The incentive of the poor to earn is unaffected.
d.
The incentive of the poor to earn reported income is increased, but the incentive to earn
unreported income is reduced.
110. If a family earned an additional $6,000 of income from work and as a result their welfare benefits were
reduced by $3,000, the implicit marginal tax rate for this family would be
a.
zero.
b.
30 percent.
c.
50 percent.
d.
100 percent.
111. The idea that transfer benefits to the poor encourage behavior that increases the risk of poverty is
known as the
a.
Samaritan’s dilemma.
b.
rule of inverse benefits.
c.
implicit marginal tax law.
d.
Smith paradox.
112. Data suggest that the large increase in government spending on income transfers over the past three
decades has been accompanied by
a.
a reduced poverty rate for the nonelderly.
b.
a more equal distribution of income.
c.
fewer single-parent families because a married couple receives benefits twice as large.
d.
none of the above.
113. (I) Opponents to government action to reduce income inequality argue that the pattern of economic
outcomes is more important than the process that generates the outcomes.
(II) Opponents of government action to reduce income inequality argue that the proposed solutions
will retard economic growth.
a.
Both I and II are true.
b.
Both I and II are false.
c.
I is true; II is false.
d.
I is false; II is true.
114. In a market economy, differences in incomes will
a.
reflect the relative scarcity of resources.
b.
provide individuals with an incentive to supply resources that are valued by others.
c.
determine the income distribution among market participants.
d.
do all of the above.
115. When there is only a weak link between work effort and reward
a.
individuals will undertake fewer projects that create income.
b.
taxing the rich and distributing the money to the poor becomes the best way to increase the
size of the economic pie.
c.
corporations will profit more.
d.
individuals have a strong incentive to undertake projects that generate income.
116. “There is considerable movement up and down the economic ladder. Relative income positions often
change over time.” This statement is
a.
true; at different points in time people tend to change position in the income distribution
b.
only true for industrialized countries
c.
false; people tend to stay in the same place within the income distribution
d.
false; people tend to stay in the same quintile that their parents were in
117. In the United States the degree of individual income mobility (that is, the degree to which people move
from higher to lower or lower to higher income groupings) is
a.
rigid in both directions.
b.
flexible in both directions.
c.
flexible upward but rigid downward since high income perpetuates itself from generation
to generation.
d.
flexible downward but rigid upward since most low-income people never rise significantly
above the poverty level.
118. The poverty threshold income level is
a.
adjusted annually for increases in real per capita income.
b.
adjusted annually for changes in prices.
c.
invariant to differences in the size and composition of families.
d.
the highest income level that would leave one in the bottom quintile of income recipients.
119. Evaluate this sentence, “The best way to get rid of poverty is to increase government expenditures on
welfare programs.”
a.
This sentence is inherently true. By providing the poor with more money they will no
longer remain in poverty.
b.
This sentence is true. Everyone would be better off if we increased government transfer
programs.
c.
This sentence is false. Increasing transfer benefits like welfare will lower the opportunity
cost of making decisions that can lead to poverty
d.
This sentence is false. Increasing government expenditures will only be harmful to those
in poverty.
120. Assume that Peter is a single parent who is in poverty. He receives food stamps and Medicaid. For
every $100 that he earns, Peter loses $35 in food stamps and $20 in Medicaid benefits. Also, Peter’s
income is taxed at a rate of 10%. Then, Peter’s total tax rate is
a.
45 percent
b.
55 percent
c.
65 percent
d.
70 percent
121. This year Bill earned $3,000 more than last year. As a result, he received $2,500 less in government
transfers. Therefore, Bill’s implicit marginal tax rate is about
a.
16 percent
b.
25 percent
c.
66 percent
d.
83 percent
122. Annual income data would be a better index of economic inequality if
a.
all households filed tax returns revealing their real income.
b.
households were more different with regard to age and size characteristics.
c.
all households were more similar with regard to size, age, education, and other major
factors that are linked to income.
d.
mathematicians could grasp the complexities of the calculations.
123. The Samaritan’s dilemma describes the problem that exists when transfer programs, designed to help
the poor, encourage choices that can promote or perpetuate
a.
poverty.
b.
healthier lifestyles.
c.
reduced birth rates.
d.
increased life expectancy.
124. Which one of the following groups has a below-average incidence of poverty?
a.
divorced or separated persons
b.
African Americans and other minorities
c.
families headed by a female
d.
persons between the ages of 35 and 54
125. A valid argument against redistributing income to achieve complete equality is that
a.
income equality would destroy the social cohesiveness that exists among different income
groupings.
b.
this would eliminate the monetary incentives to work and produce.
c.
the cost of obtaining the equality would be so deflationary as to promote economic
instability.
d.
income equality would imply class segregation based on factors such as sex or race since
income would be constant.
126. In 2007, the poorest 20 percent of families in the United States population earned approximately ____
percent of the before-tax total income. (Fill in the blank.)
a.
1
b.
4
c.
9
d.
12
127. “Annual income during the prime working years may overstate the economic well-being of most
households over their lifetime.” This statement is
a.
false
b.
true
c.
only true for single-earner families
d.
indeterminate; averages can’t be composed here—we must know more about the
individuals and their earnings patterns
128. When determining whether an income places a family or individual in poverty, the official poverty rate
excludes
a.
money income derived from sources other than labor.
b.
money income received from transfer programs.
c.
noncash benefits derived from programs supplying recipients with food, housing, and
medical benefits.
d.
noncash benefits that are provided the non-elderly, but it counts these benefits when they
are supplied to the elderly.
ESSAY
129. Suppose you had the choice of attending two universities. University A pays all of its professors the
same wage and awards the same raises. University B pays each professor according to market wages
and productivity. Which university would you rather attend and why?
130. Why don’t we divide the economic pie evenly so that each person receives the same income?
ANS:
131. Some people inherit money and wealth that they did nothing to earn. Why don’t we tax inheritance at
100 percent?
ANS:
132. Andy observes that the income distribution between the richest and poorest people in the population
has remained fixed for decades. He concludes that the rich stay rich and the poor stay poor. Is this a
valid conclusion, or has Andy missed something?
133. Why does the government provide benefits in-kind? Why don’t we just give money to low-income
people?
134. The mythical country of Quitar has just established a policy to give very generous in-kind benefits to
the nation’s poor, currently defined as those earning less than $10,000 a year. Several years later, the
poverty rate has not fallen. Why not?
135. Why not designate the poorest 10 percent of the population as the official measure of poverty?
ANS:
136. Income inequality exists in the United States. Is this necessarily a bad thing? Explain how our
assessment of income inequality depends crucially on the source of that inequality.