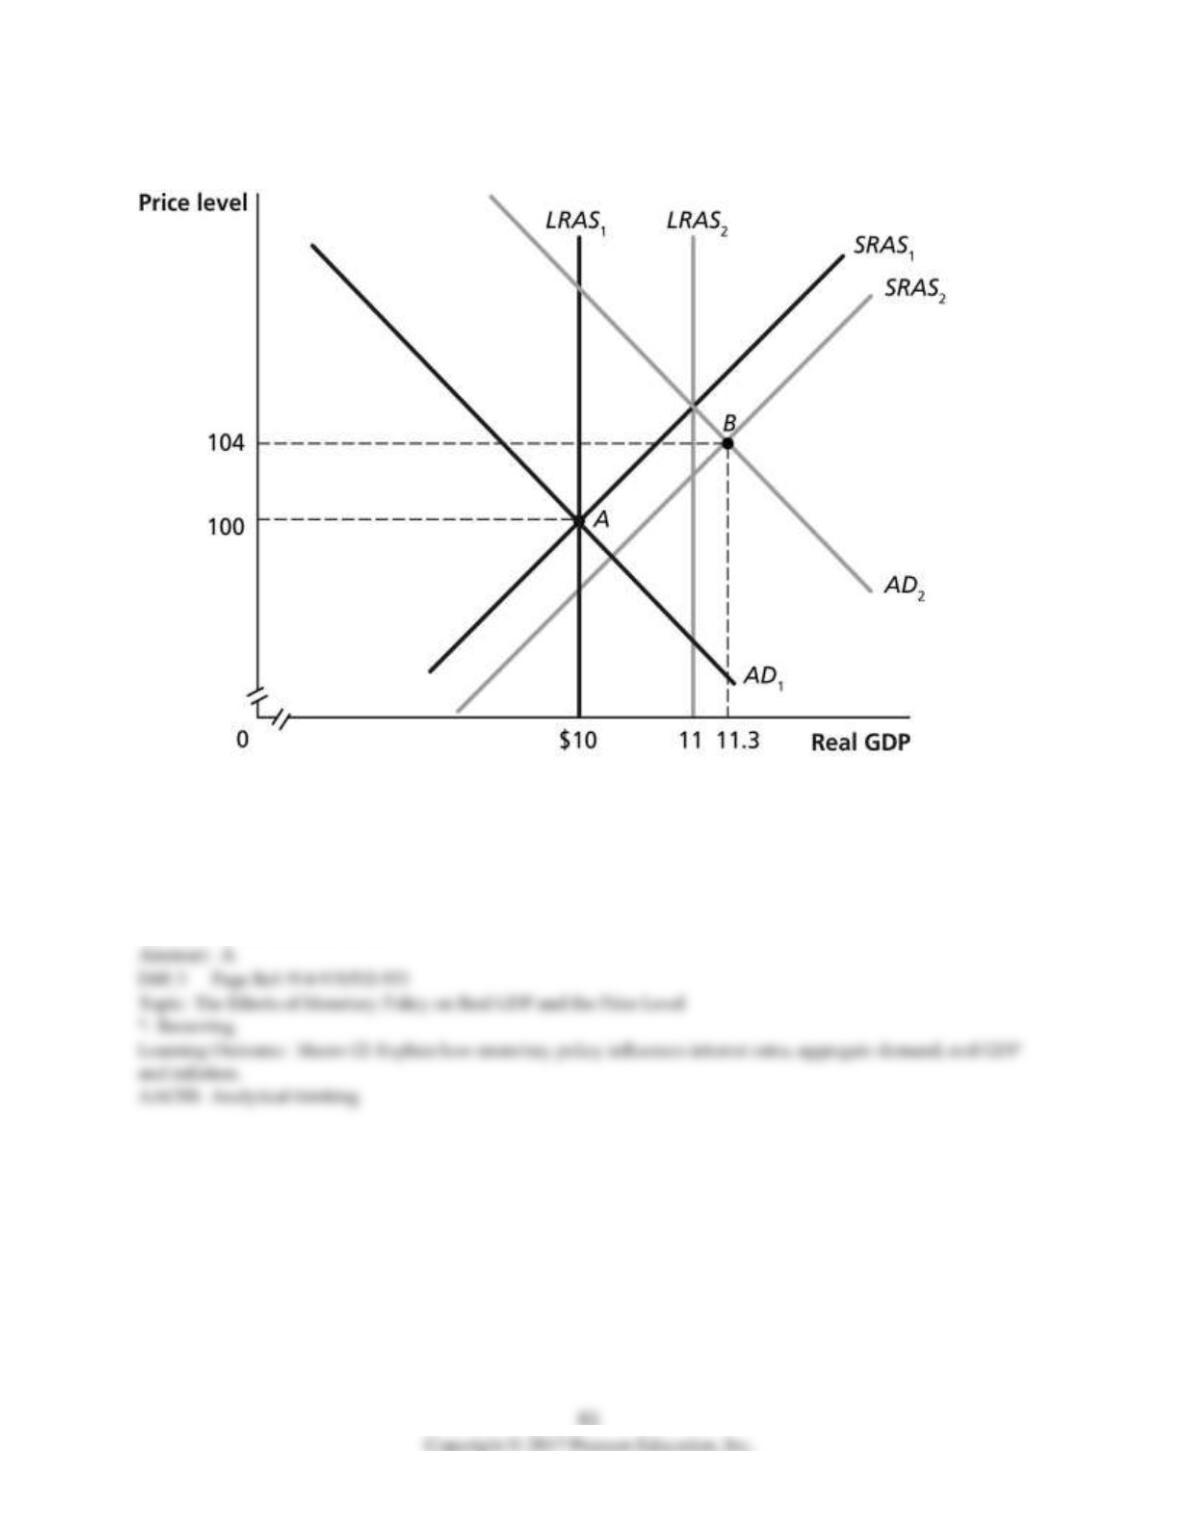
Figure 15-12
4) Refer to Figure 15-12. In the dynamic AD–AS model, if the economy is at point A in year 1 and is
expected to go to point B in year 2, the Federal Reserve would most likely
A) increase interest rates.
B) decrease interest rates.
C) not change interest rates.
D) increase the inflation rate.
5) Refer to Figure 15-12. In the dynamic AD–AS model, if the economy is at point A in year 1 and is
expected to go to point B in year 2, and the Federal Reserve pursues no policy, then at point B
A) firms are producing above capacity.
B) there is pressure on wages and prices to fall.
C) the unemployment rate is greater than the natural rate of unemployment.
D) incomes and profits are falling.
6) Refer to Figure 15-12. In the dynamic AD–AS model, the economy is at point A in year 1 and is
expected to go to point B in year 2, and the Federal Reserve pursues policy. This will result in
A) unemployment rates higher than what would occur if no policy had been pursued.
B) inflation rates higher than what would occur if no policy had been pursued.
C) potential real GDP levels lower than what would occur if no policy had been pursued.
D) real GDP levels higher than what would occur if no policy had been pursued.
7) From an initial long-run macroeconomic equilibrium, if the Federal Reserve anticipated that next year
aggregate demand would grow significantly faster than long-run aggregate supply, then the Federal
Reserve would most likely
A) increase income tax rates.
B) decrease income tax rates.
C) increase interest rates.
D) decrease interest rates.
8) Contractionary monetary policy to prevent real GDP from rising above potential real GDP would
cause the inflation rate to be ________ and real GDP to be ________.
A) higher; higher
B) higher; lower
C) lower; higher
D) lower; lower
Table 15-1
Year
Potential Real GDP
Real GDP
Price Level
2016
$18.2 trillion
$18.2 trillion
145
2017
18.6 trillion
18.5 trillion
147
9) Refer to Table 15-1. The hypothetical information in the table shows what the values for real GDP
and the price level will be in 2017 if the Fed does not use monetary policy. Which of the following
policies makes sense if the Fed wants to keep real GDP at its potential level in 2017?
A) The trading desk should sell Treasury securities.
B) The Fed should lower the target for the federal funds rate.
C) The Fed should pursue contractionary policy.
D) The Fed should lower capital gains taxes.
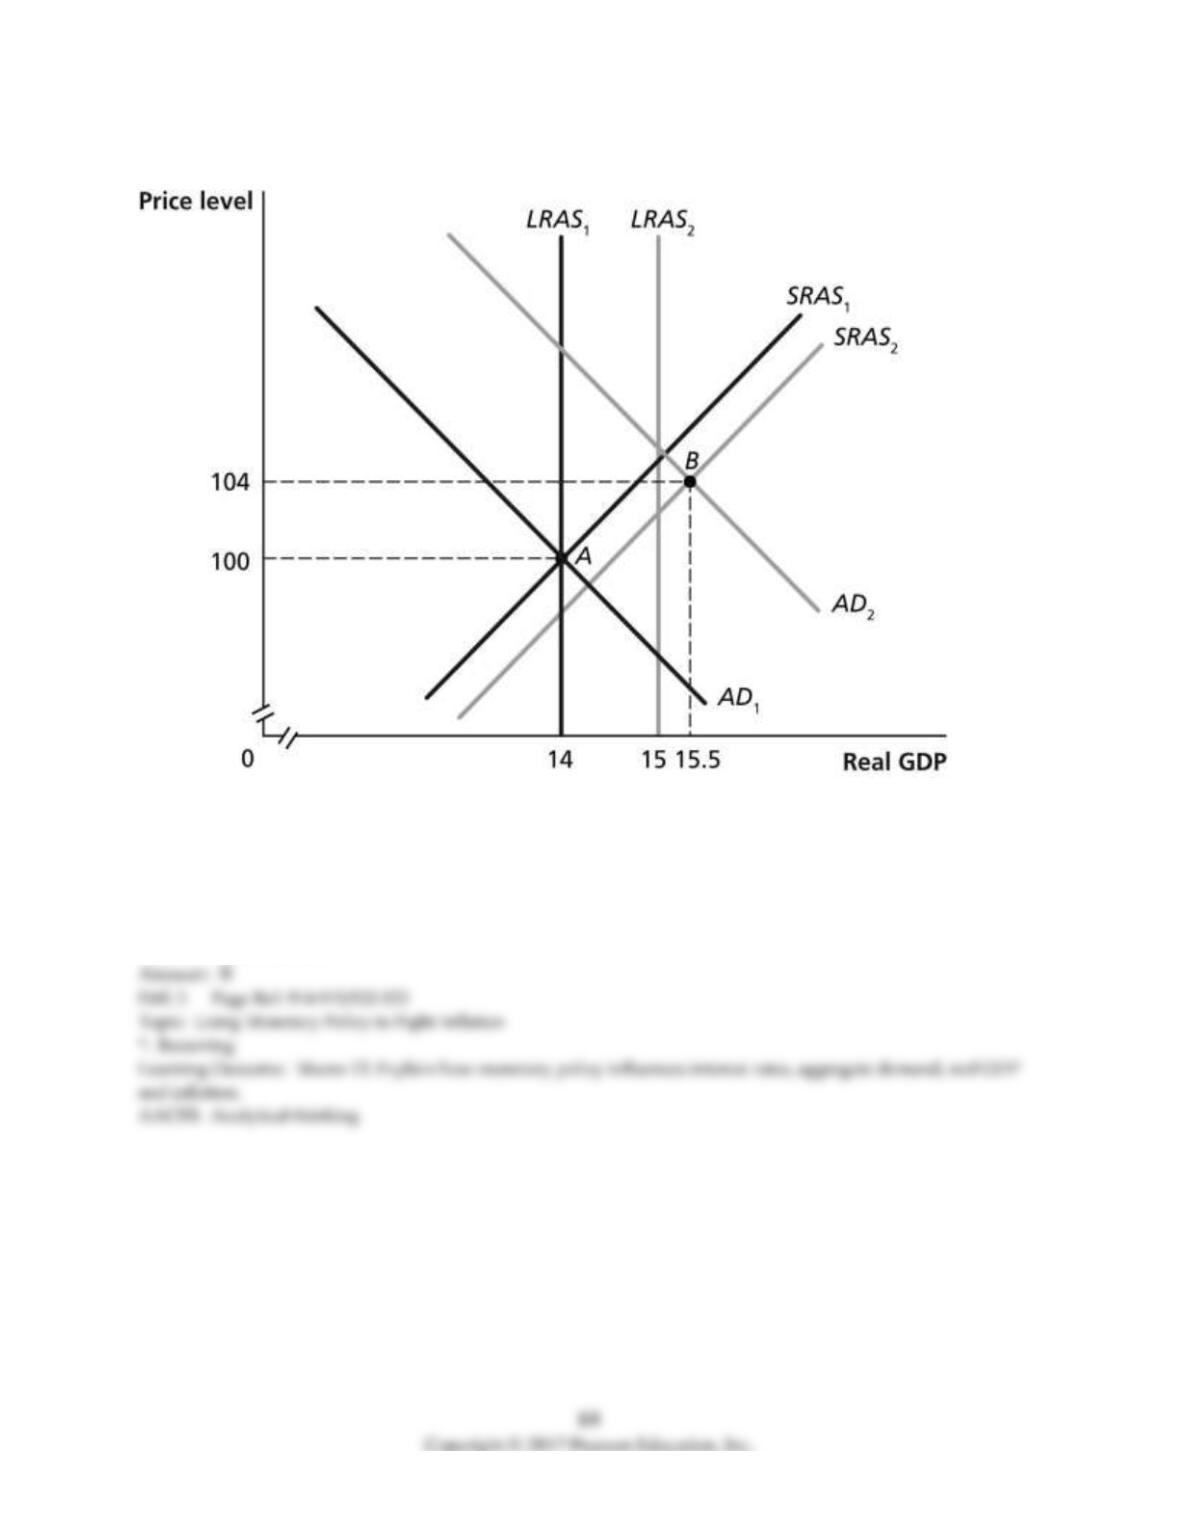
Figure 15-13
10) Refer to Figure 15-13. In the figure above, if the economy in Year 1 is at point A and is expected in
Year 2 to be at point B, then the appropriate monetary policy by the Federal Reserve would be to
A) lower interest rates.
B) raise interest rates.
C) lower income taxes.
D) raise income taxes.
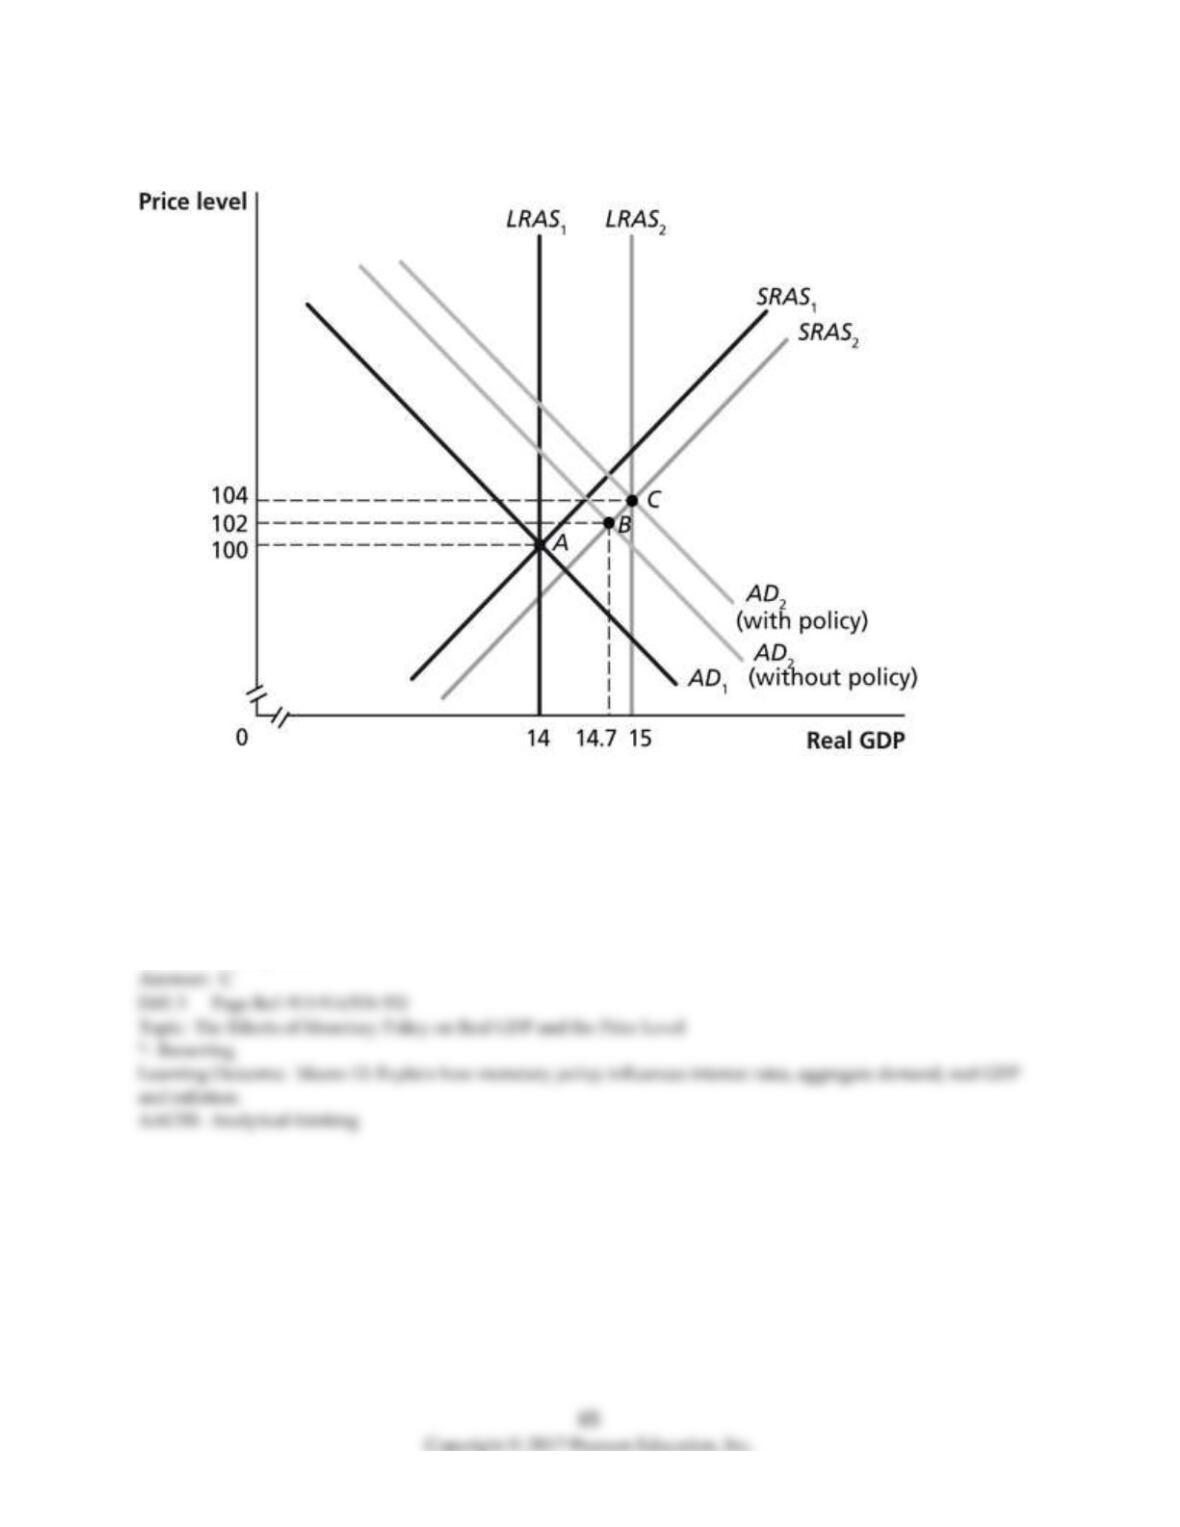
Figure 15-14
11) Refer to Figure 15-14. In the figure above, suppose the economy in Year 1 is at point A and is
expected in Year 2 to be at point B. Which of the following policies could the Federal Reserve use to
move the economy to point C?
A) decrease income taxes
B) increase the required-reserve ratio
C) buy Treasury bills
D) sell Treasury bills
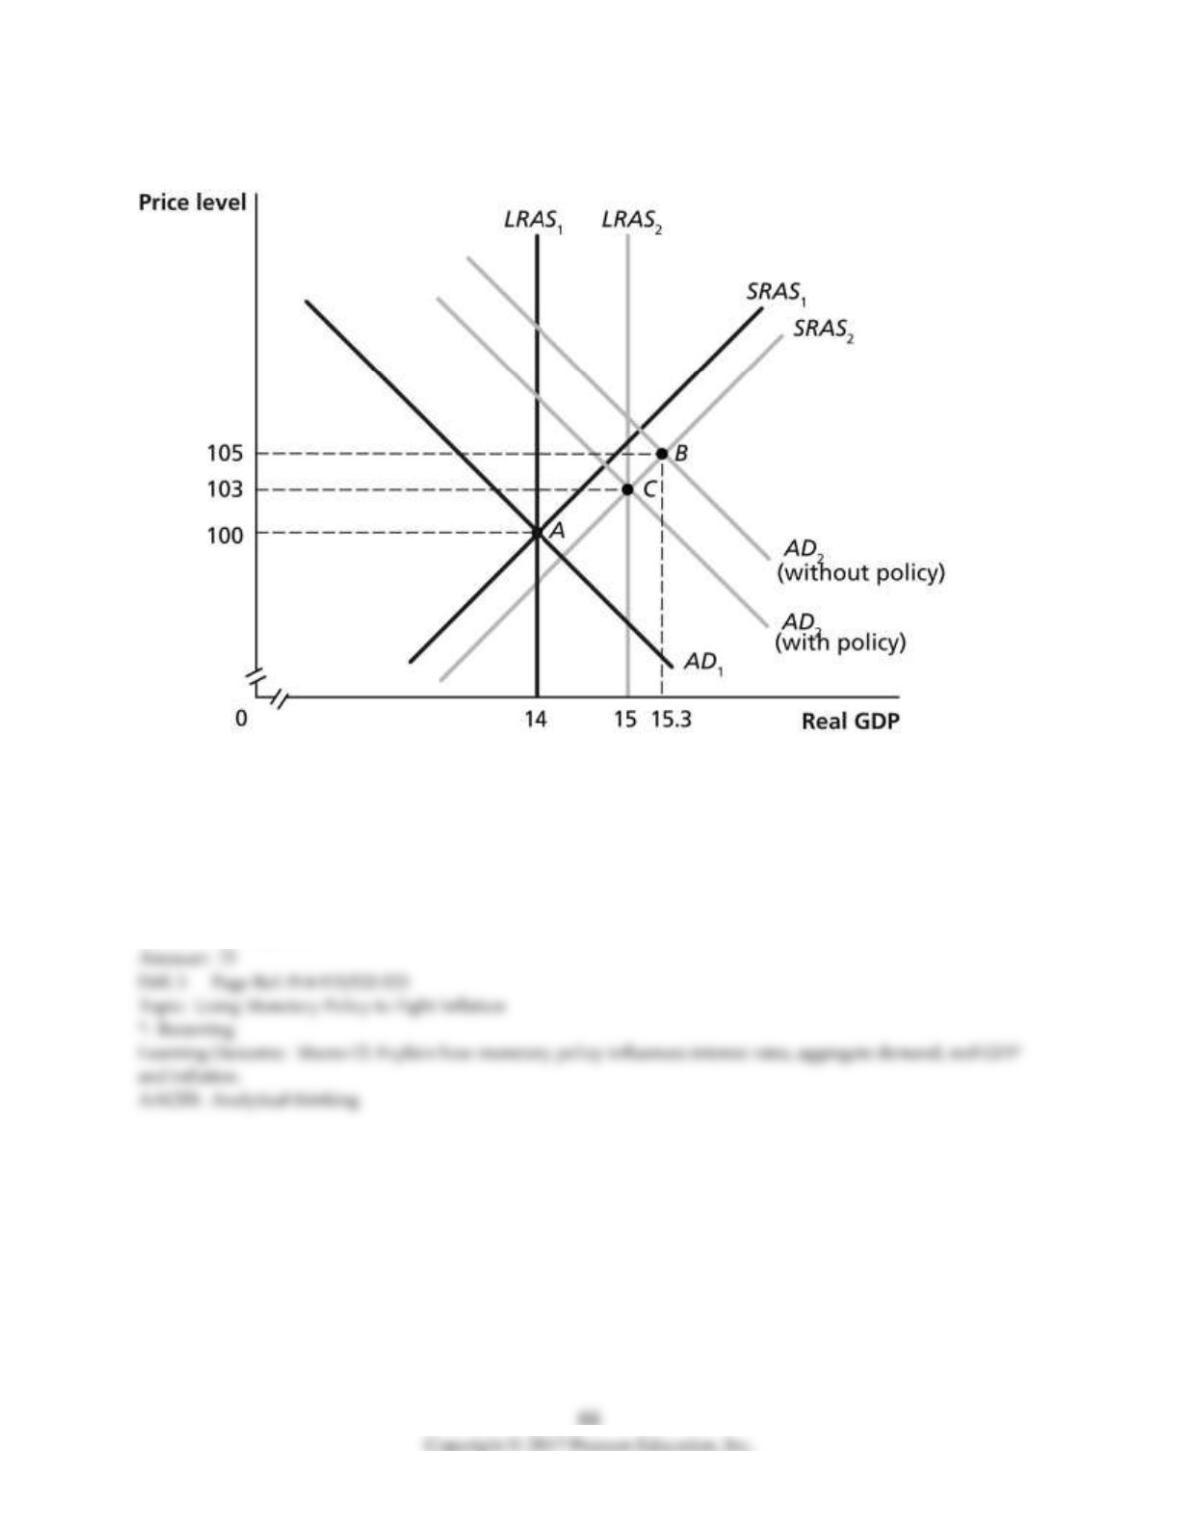
Figure 15-15
12) Refer to Figure 15-15. In the figure above, suppose the economy in Year 1 is at point A and is
expected in Year 2 to be at point B. Which of the following policies could the Federal Reserve use to
move the economy to point C?
A) decrease income taxes
B) decrease the required-reserve ratio
C) buy Treasury bills
D) sell Treasury bills
13) From an initial long-run macroeconomic equilibrium, if the Federal Reserve anticipated that next
year aggregate demand would grow significantly slower than long-run aggregate supply, then the
Federal Reserve would most likely
A) increase income tax rates.
B) decrease income tax rates.
C) increase interest rates.
D) decrease interest rates.
14) Expansionary monetary policy to prevent real GDP from falling below potential real GDP would
cause the inflation rate to be ________ and real GDP to be ________.
A) higher; higher
B) higher; lower
C) lower; higher
D) lower; lower
Table 15-2
Year
Potential Real GDP
Real GDP
Price Level
2016
$18.0 trillion
$18.0 trillion
150
2017
18.5 trillion
18.2 trillion
152
15) Refer to Table 15-2. Consider the hypothetical information in the table above for potential real GDP,
real GDP, and the price level in 2016 and in 2017 if the Federal Reserve does not use monetary policy. If
the Fed wants to keep real GDP at its potential level in 2017, it should
A) buy Treasury securities.
B) sell Treasury securities.
C) increase the required reserve ratio.
D) increase income taxes.
16) Refer to Table 15-2. Consider the hypothetical information in the table above for potential real GDP,
real GDP, and the price level in 2016 and in 2017 if the Federal Reserve does not use monetary policy. If
the Fed uses monetary policy successfully to keep real GDP at its potential level in 2017, which of the
following will be higher than if the Fed had taken no action?
A) real GDP and the unemployment rate
B) real GDP and the inflation rate
C) real GDP and potential GDP
D) potential GDP and the inflation rate
Table 15-3
Year
Potential Real GDP
Real GDP
Price Level
2016
$18.0 trillion
$18.0 trillion
150
2017
18.5 trillion
18.8 trillion
154
17) Refer to Table 15-3. Consider the hypothetical information in the table above for potential real GDP,
real GDP, and the price level in 2016 and in 2017 if the Federal Reserve does not use monetary policy. If
the Fed wants to keep real GDP at its potential level in 2017, it should
A) buy Treasury securities.
B) sell Treasury securities.
C) decrease the required reserve ratio.
D) decrease income taxes.
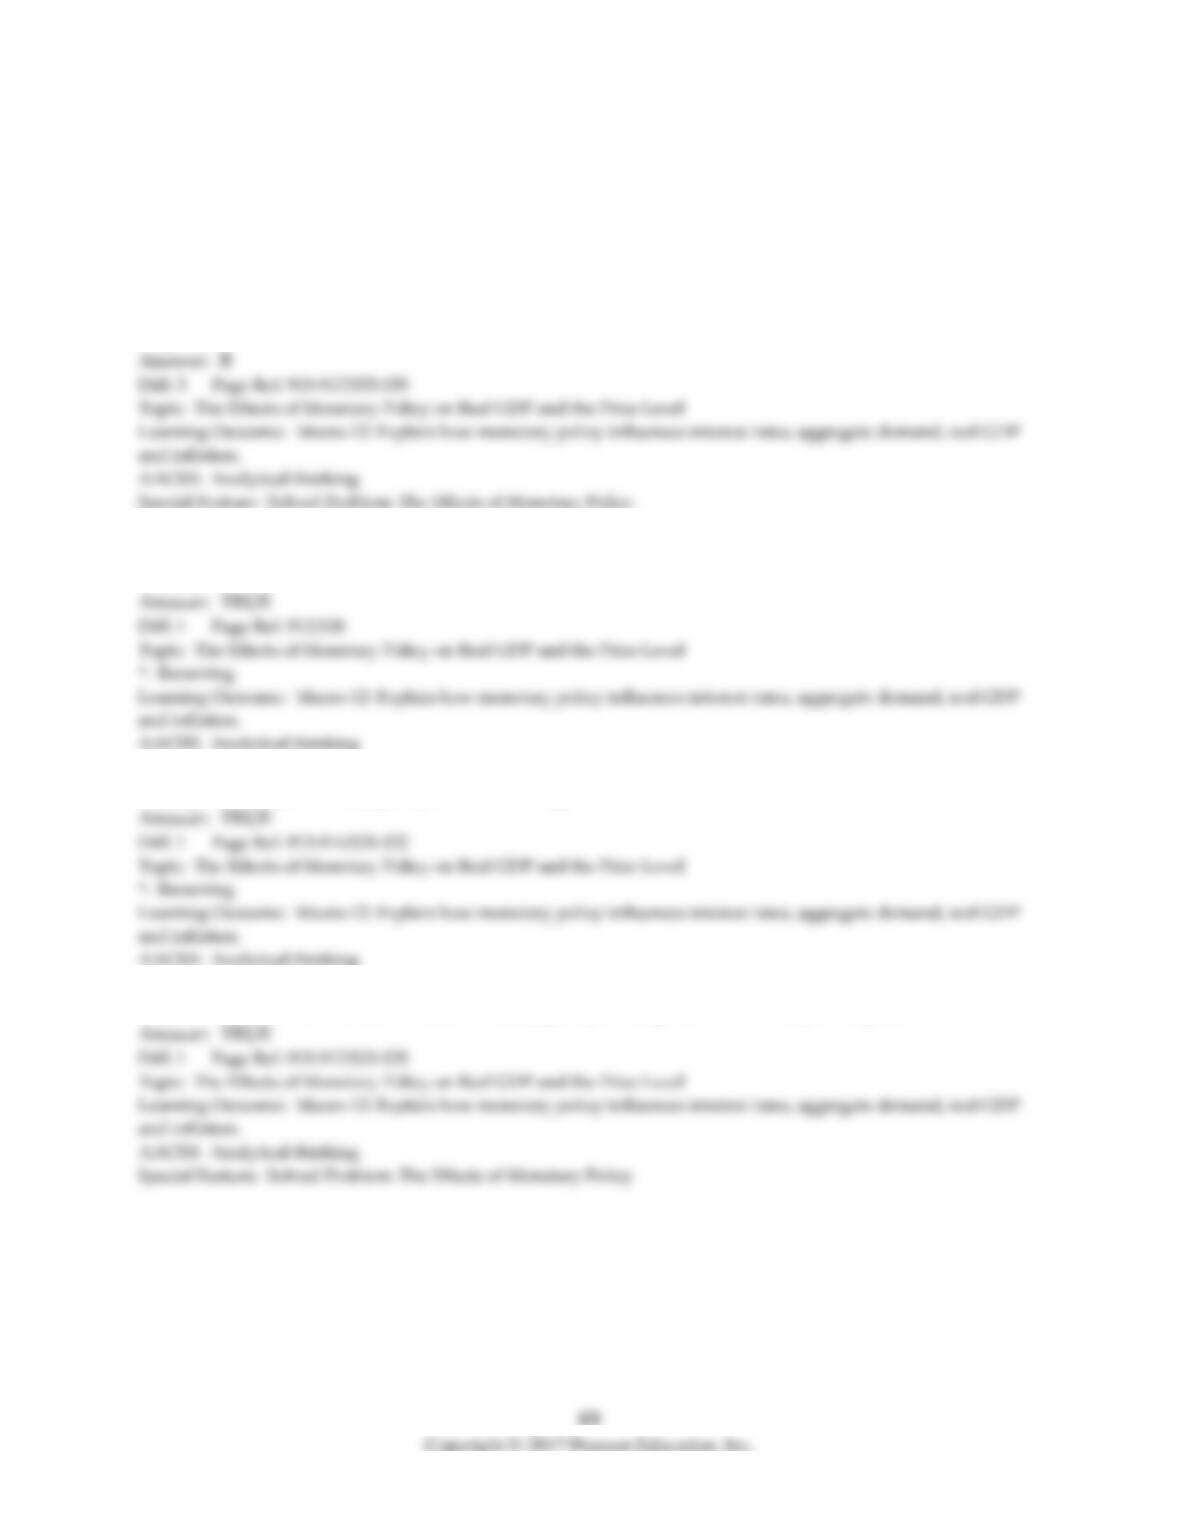
18) Refer to Table 15-3. Consider the hypothetical information in the table above for potential real GDP,
real GDP, and the price level in 2016 and in 2017 if the Federal Reserve does not use monetary policy. If
the Fed uses monetary policy successfully to keep real GDP at its potential level in 2017, which of the
following will be lower than if the Fed had taken no action?
A) real GDP and the unemployment rate
B) real GDP and the inflation rate
C) real GDP and potential GDP
D) potential GDP and the inflation rate
19) The dynamic aggregate demand and aggregate supply model accounts for the price level rising
every year.
20) Expansionary monetary policy enacted during a recession will cause the inflation rate to increase.
21) In reality, the Fed is unable to use monetary policy to keep real GDP exactly at its potential level.
22) The Fed can use contractionary monetary policy in an attempt to keep inflation from increasing.
23) The Fed can use expansionary monetary policy to lower interest rates to stimulate aggregate
demand.
24) Would the Federal Reserve respond more aggressively with interest rate cuts in a recession caused
by a decrease in spending, as in the 2001 recession, than in a recession caused by an increase in oil
prices, as in the 1974-75 recession?
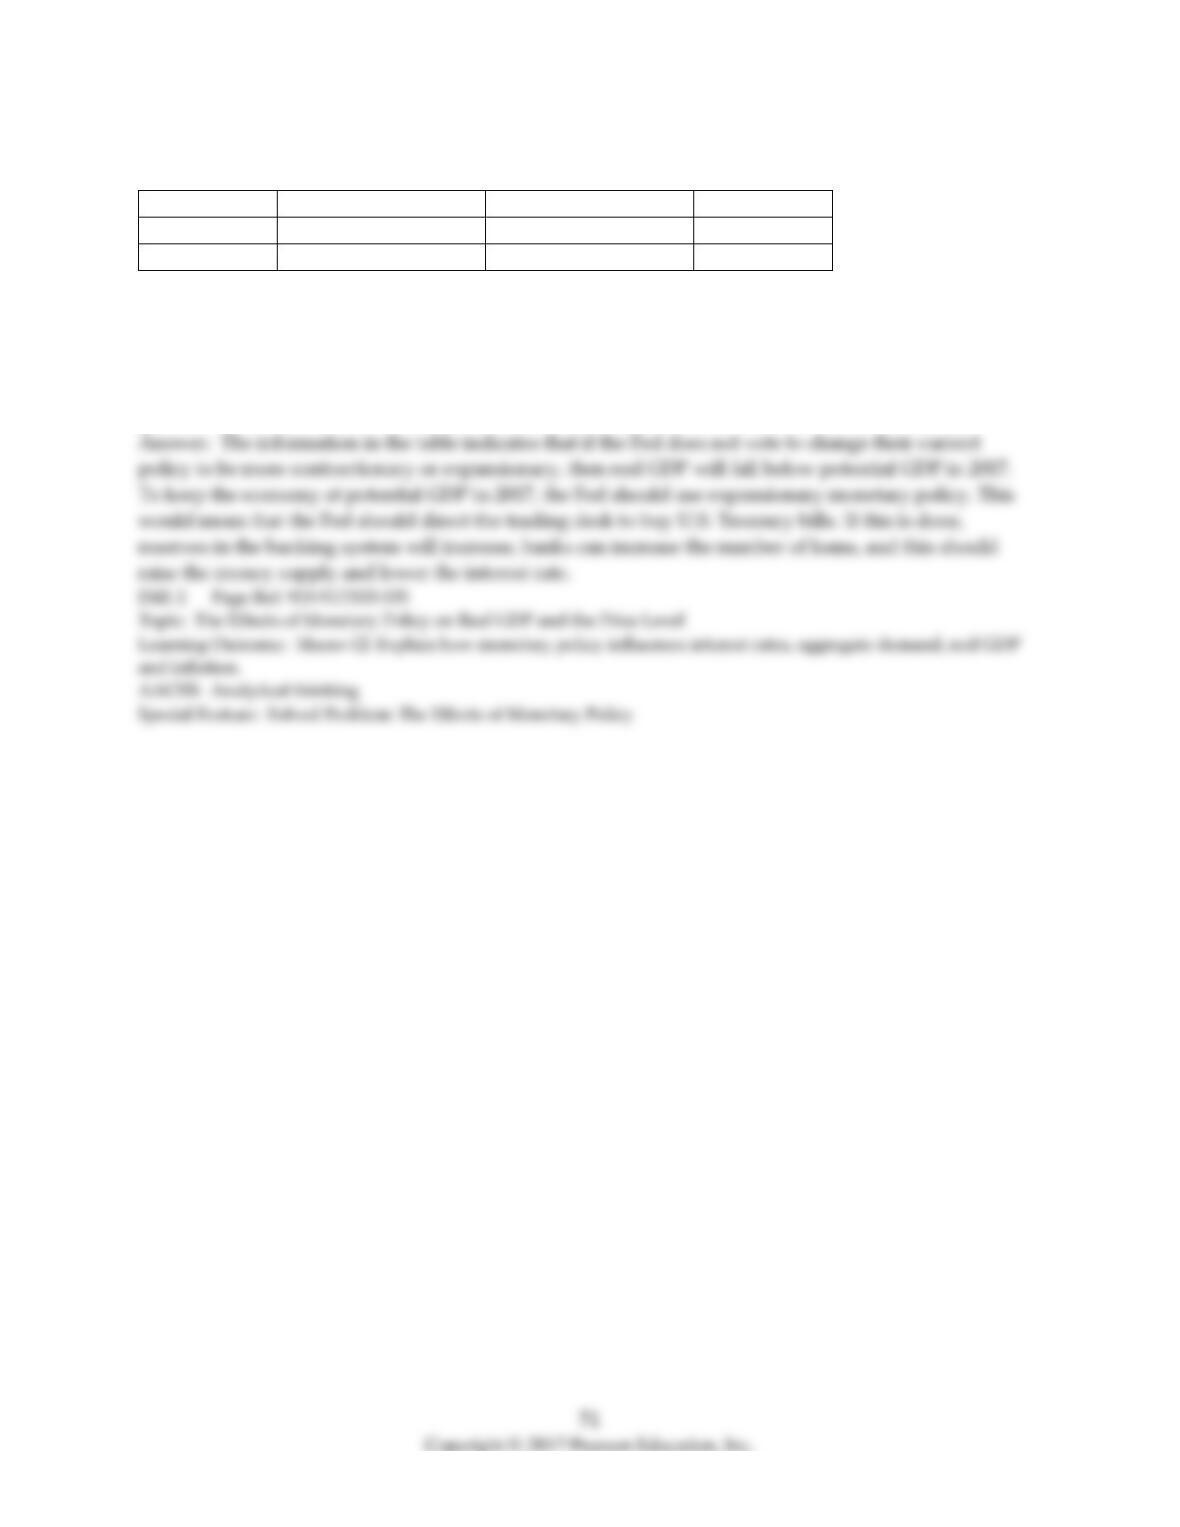
Table 15-4
Year
Potential Real GDP
Real GDP
Price Level
2016
$18.1 trillion
$18.1 trillion
150
2017
18.4 trillion
18.3 trillion
153
25) Refer to Table 15-4. Suppose the following table illustrates the values of real and potential GDP and
the price level if the Fed does not vote to change their current policy to be more contractionary or
expansionary. If the Fed wants to keep real GDP at its potential level in 2017, should the Fed use a
contractionary or expansionary policy? How should it conduct open market operations to achieve its
goal?
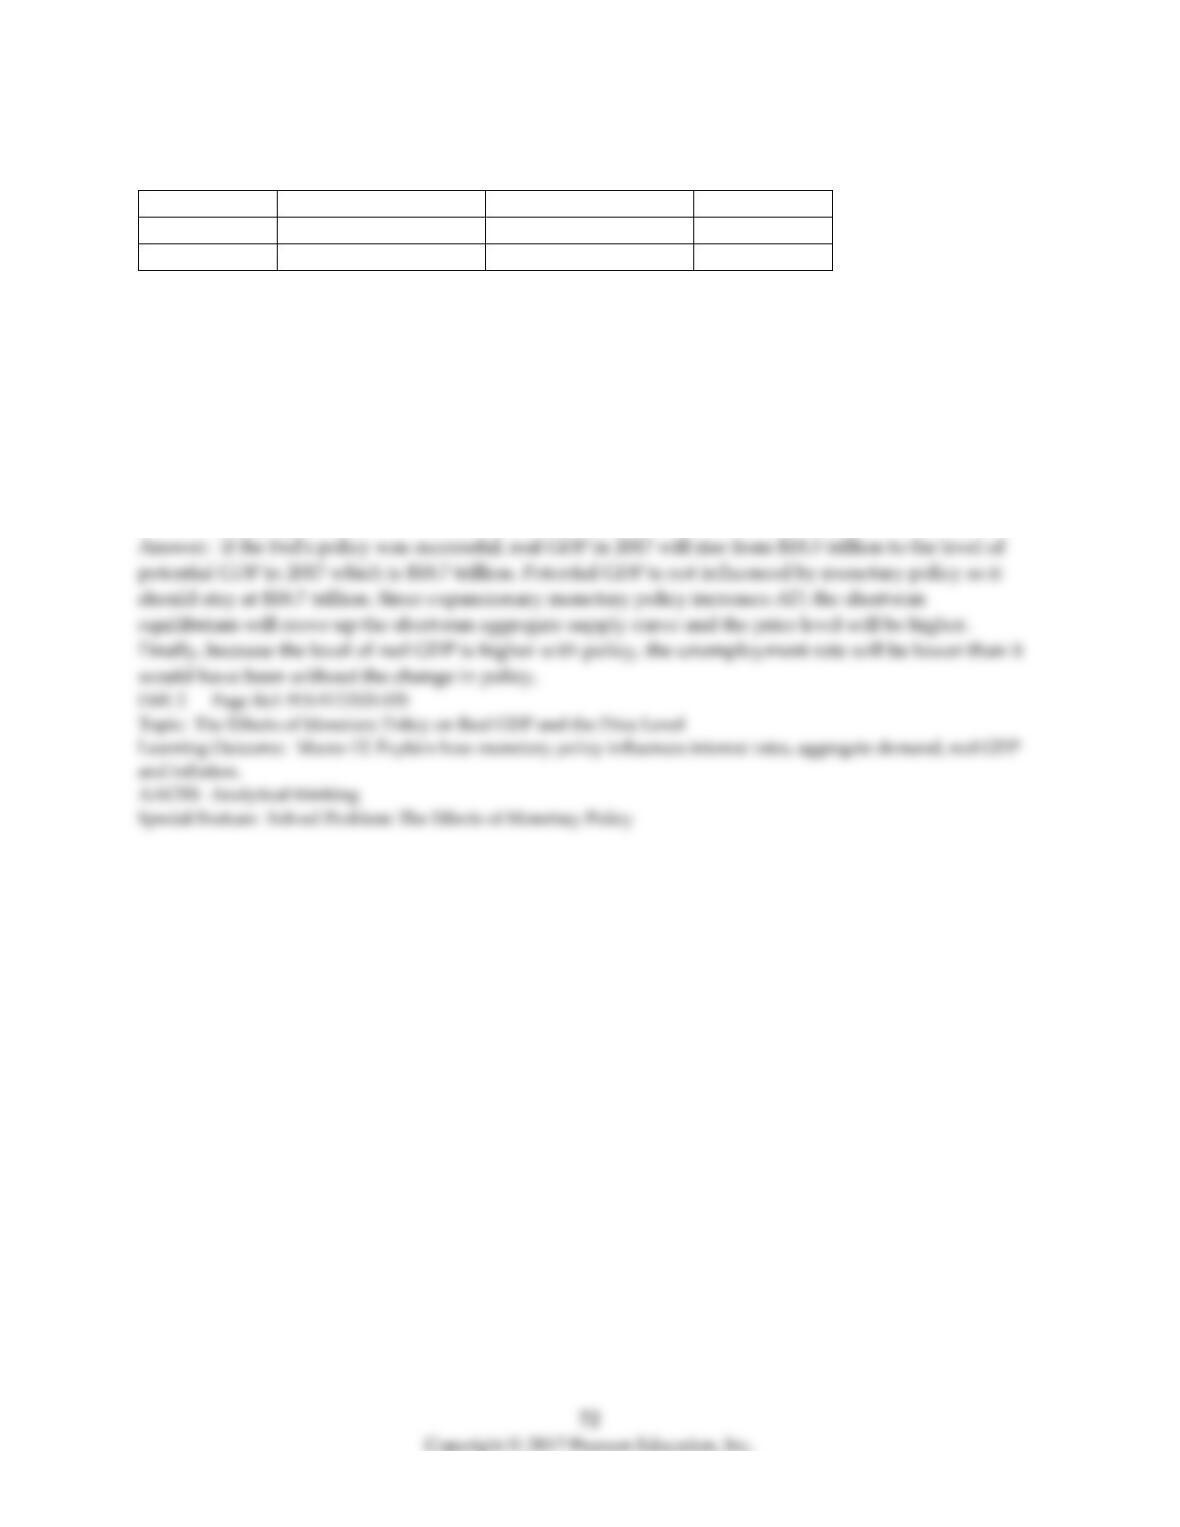
Table 15-5
Year
Potential Real GDP
Real GDP
Price Level
2016
$18.4 trillion
$18.4 trillion
144
2017
18.7 trillion
18.5 trillion
146
26) Refer to Table 15-5. Suppose the table above illustrates the values of real and potential GDP and the
price level if the Fed does not vote to change their current policy to be more contractionary or
expansionary. Suppose that the Fed uses an appropriate policy and is successful in keeping real GDP at
potential in 2017. State whether each of the following will be higher or lower than if the Fed had taken
no action:
a. Real GDP
b. Potential real GDP
c. The price level
d. The unemployment rate
Table 15-6
Year
Potential Real GDP
Real GDP
Price Level
2016
$18.1 trillion
$18.1 trillion
150
2017
18.4 trillion
18.6 trillion
155
27) Refer to Table 15-6. Suppose the table above illustrates the values of real and potential GDP and the
price level if the Fed does not vote to change their current policy to be more contractionary or
expansionary. If the Fed wants to keep real GDP at its potential level in 2017, should the Fed use a
contractionary or expansionary policy? Should it raise or lower its interest rate target? How should it
conduct open market operations to achieve its goal?
74
Table 15-7
Year
Potential Real GDP
Real GDP
Price Level
2012
$14.2 trillion
$14.2 trillion
154
2013
14.8 trillion
14.6 trillion
156
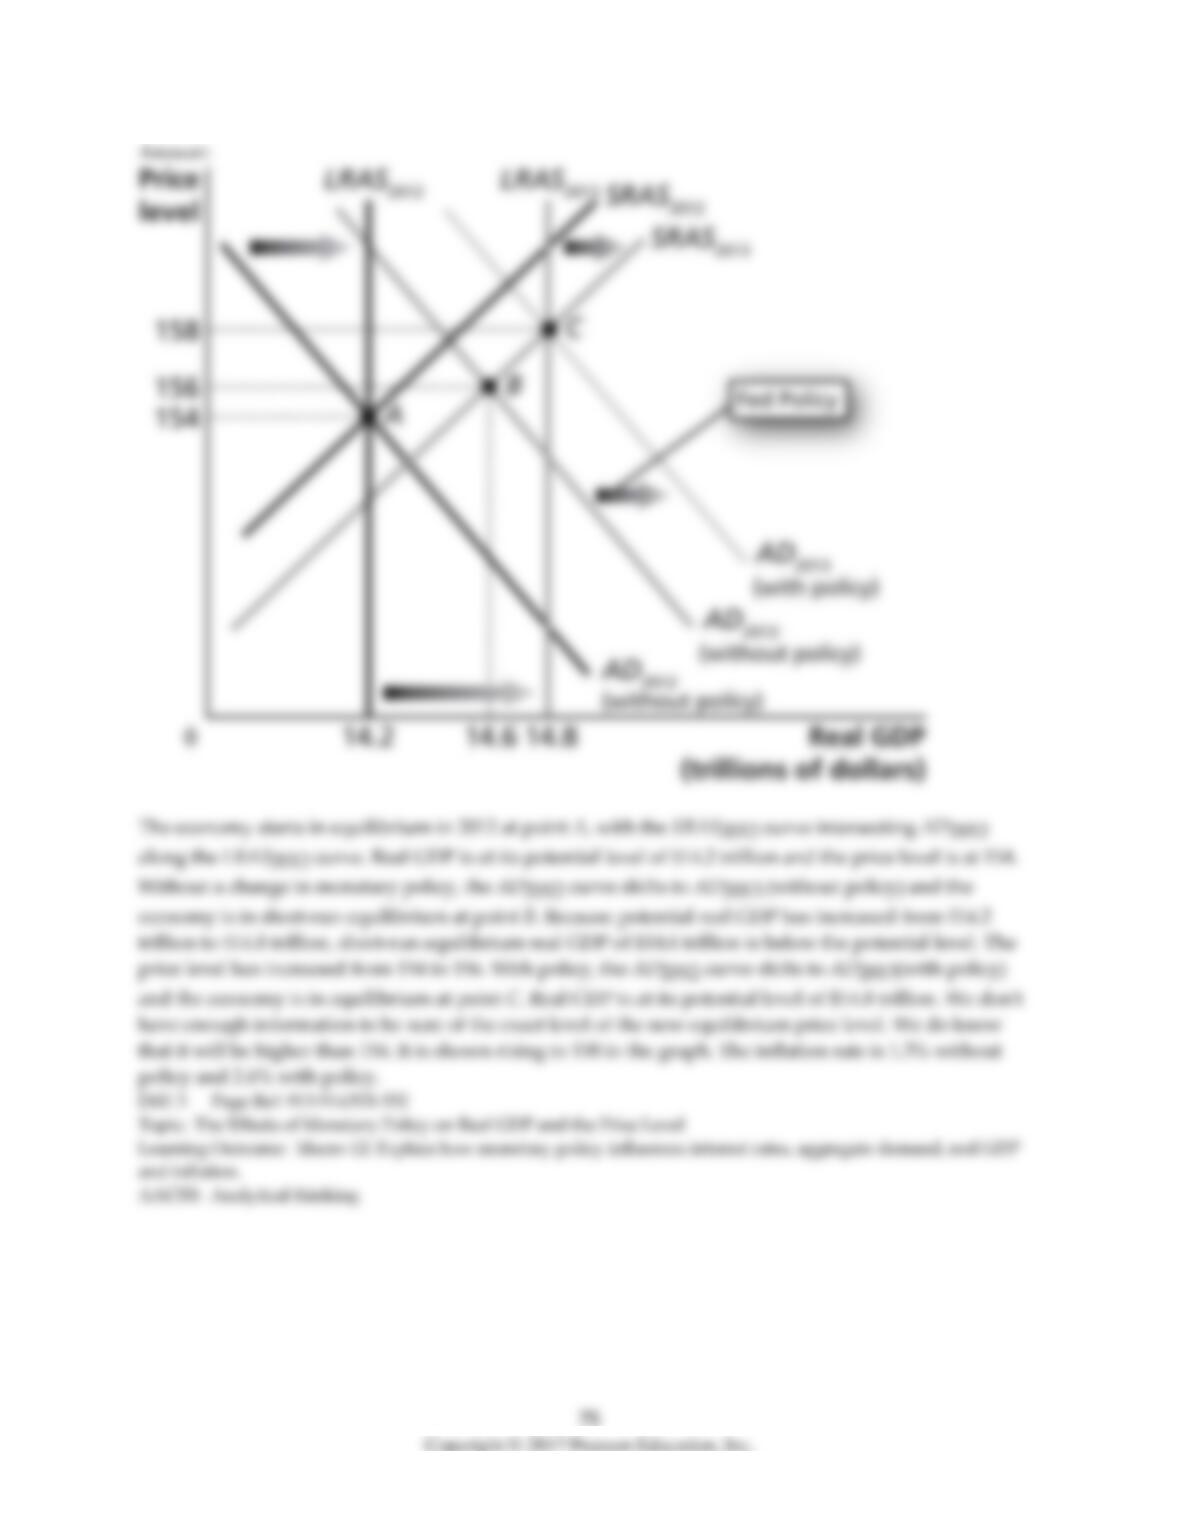
28) Refer to Table 15-7. Suppose the table above illustrates the values of real and potential GDP and the
price level if the Fed did not vote to change their current policy to be more contractionary or
expansionary. Suppose that the Fed used an appropriate policy and was successful in keeping real GDP
at potential in 2013. Draw an aggregate demand and supply curve to illustrate your answer.
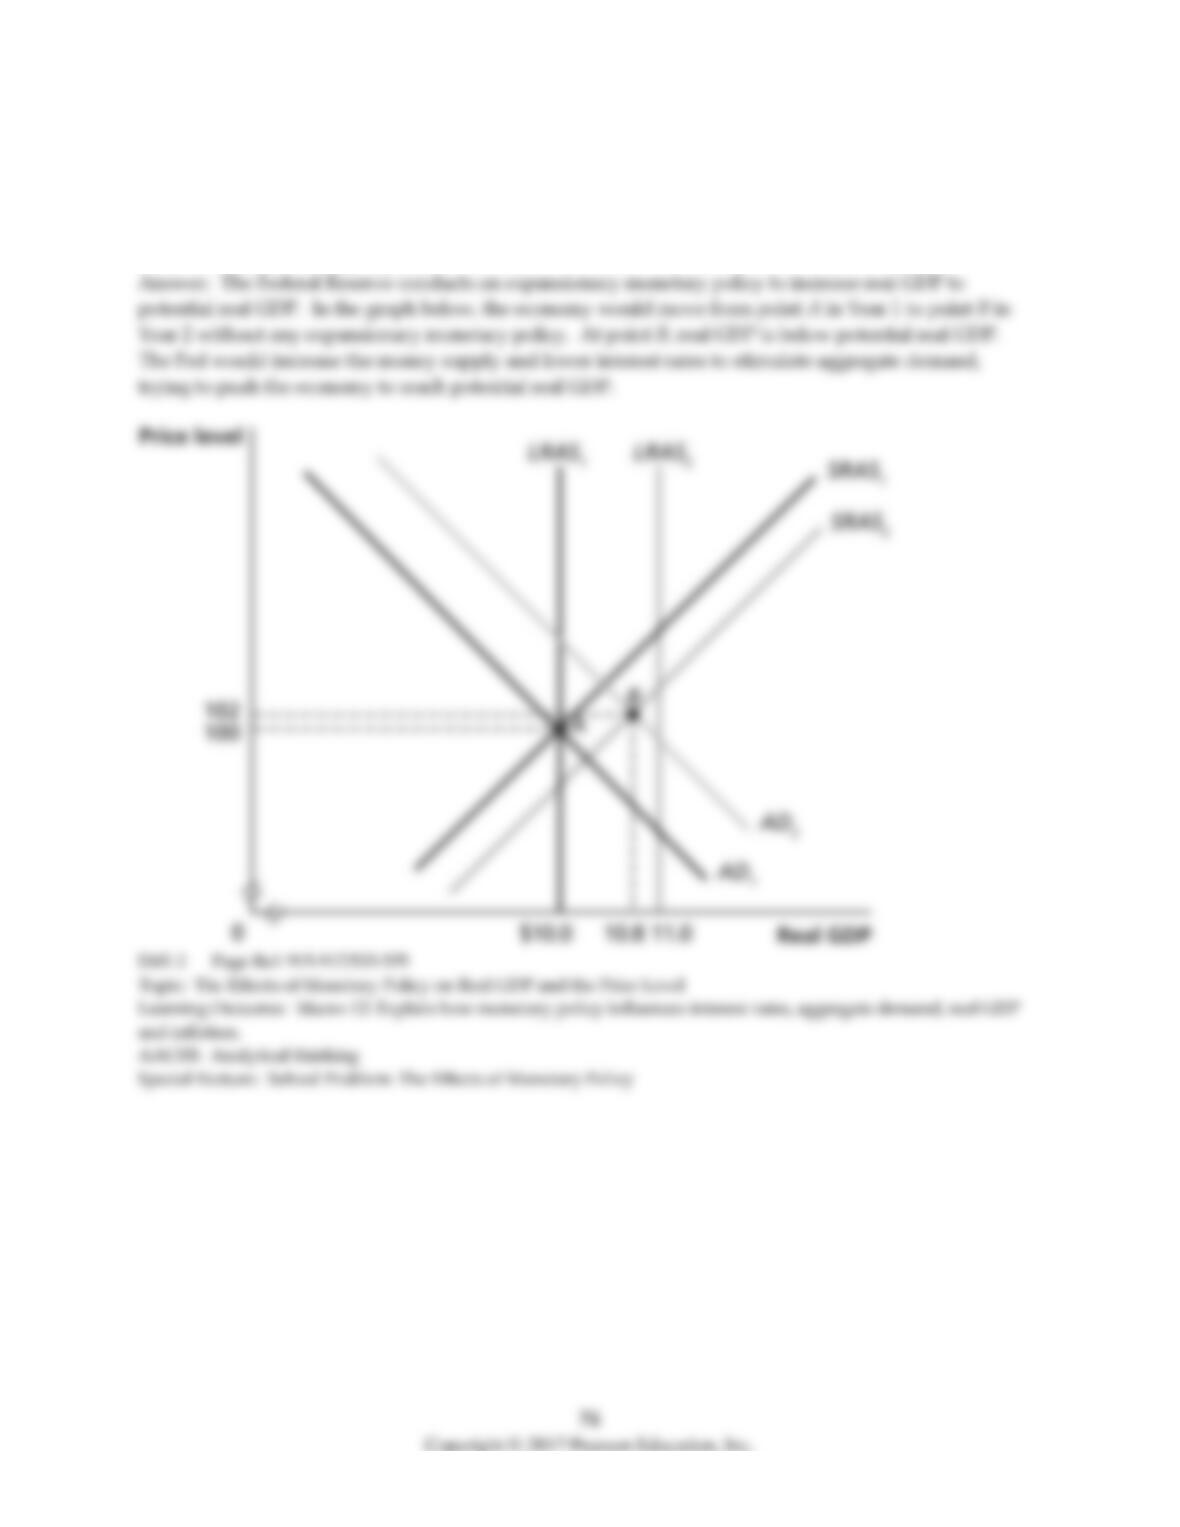
29) Use the dynamic aggregate demand and aggregate supply model and start with Year 1 in long-run
macroeconomic equilibrium. For Year 2, graph aggregate demand, long-run aggregate supply, and
short-run aggregate supply such that the condition of the economy will induce the Federal Reserve to
conduct an expansionary monetary policy. Briefly explain the condition of the economy and what the
Federal Reserve is attempting to do.
77
Table 15-8
Year
Potential Real GDP
Real GDP
Price Level
2013
$13.5 trillion
$13.5 trillion
142
2014
14.0 trillion
14.4 trillion
150
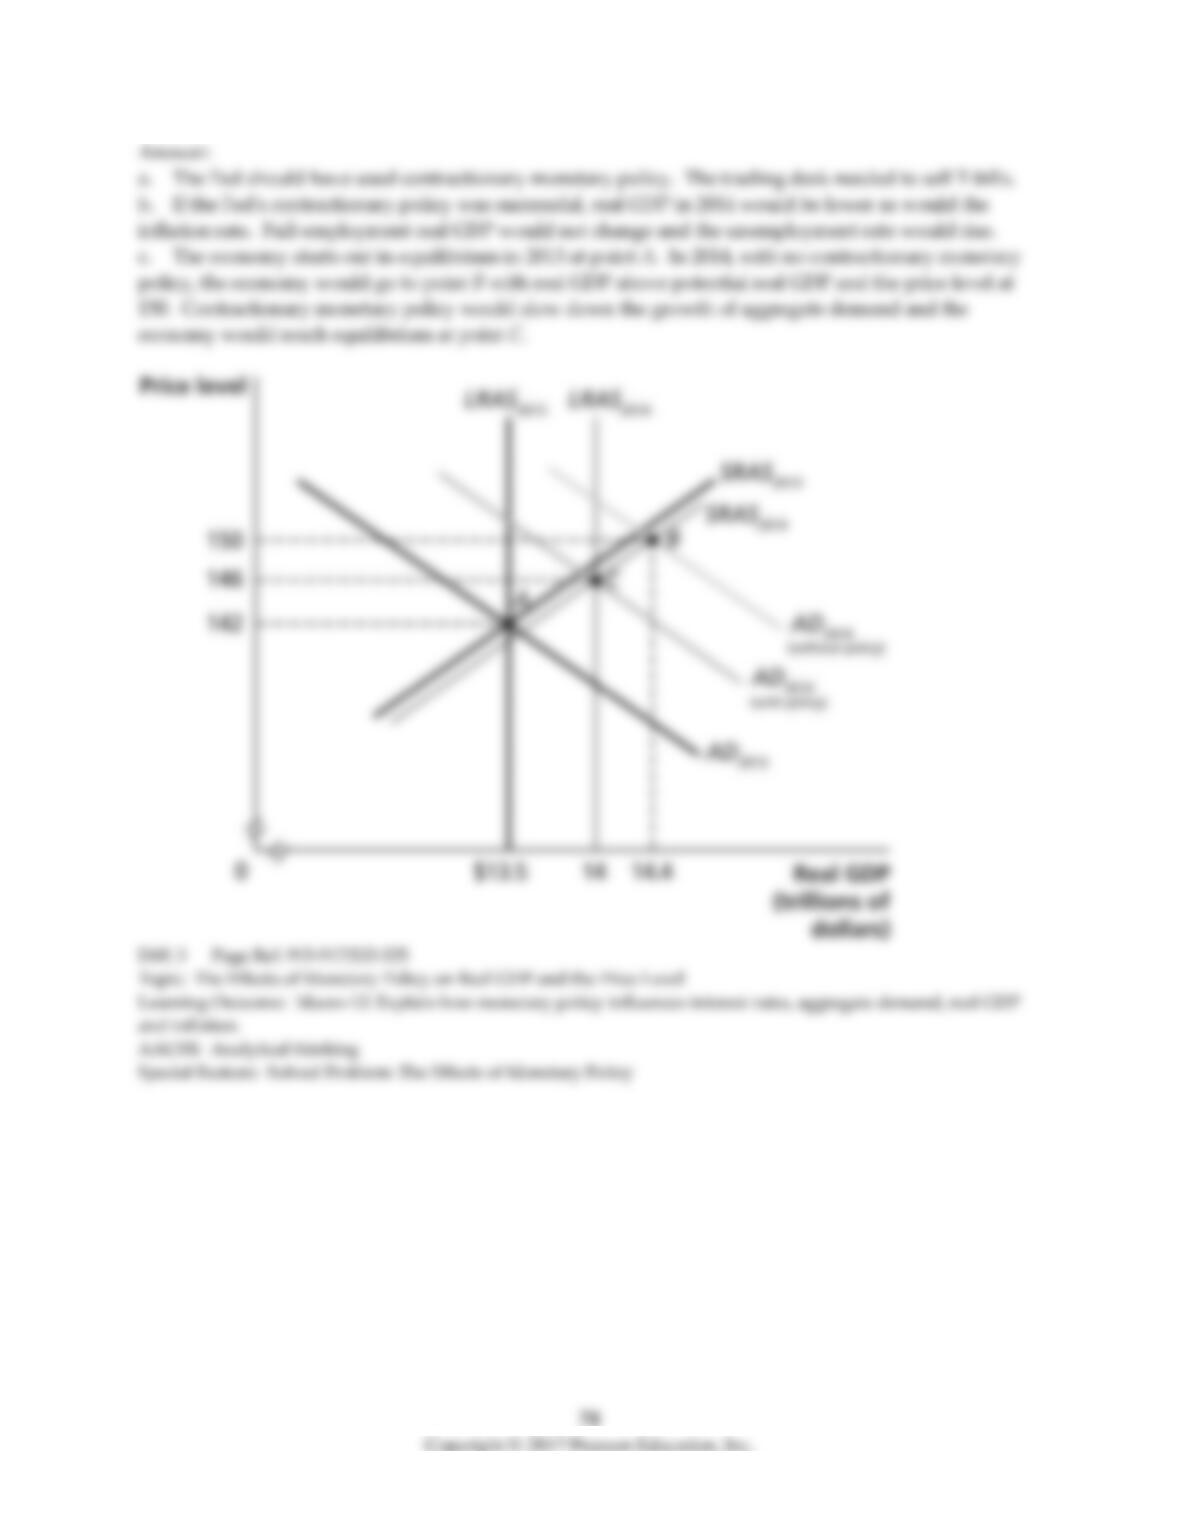
30) Refer to Table 15-8. The hypothetical information in the table shows what the values for real GDP
and the price level would have been in 2014 if the Federal Reserve did not use monetary policy:
a. If the Fed wanted to keep real GDP at its potential level in 2014, should it have used an
expansionary policy or a contractionary policy? Should the trading desk have bought T-bills or sold
them?
b. Suppose the Fed’s policy was successful in keeping real GDP at its potential level in 2014. State
whether each of the following would be higher or lower than if the Fed had taken no action:
(i) Real GDP
(ii) Full-employment real GDP
(iii) The inflation rate
(iv) The unemployment rate
c. Draw an aggregate demand and aggregate supply graph to illustrate your answer. Be sure that
your graph contains LRAS curves for 2013 and 2014; SRAS curves 2013 and 2014; AD curve for 2013 and
2014, with and without monetary policy actions; and equilibrium real GDP and the price level in 2014
with and without policy.
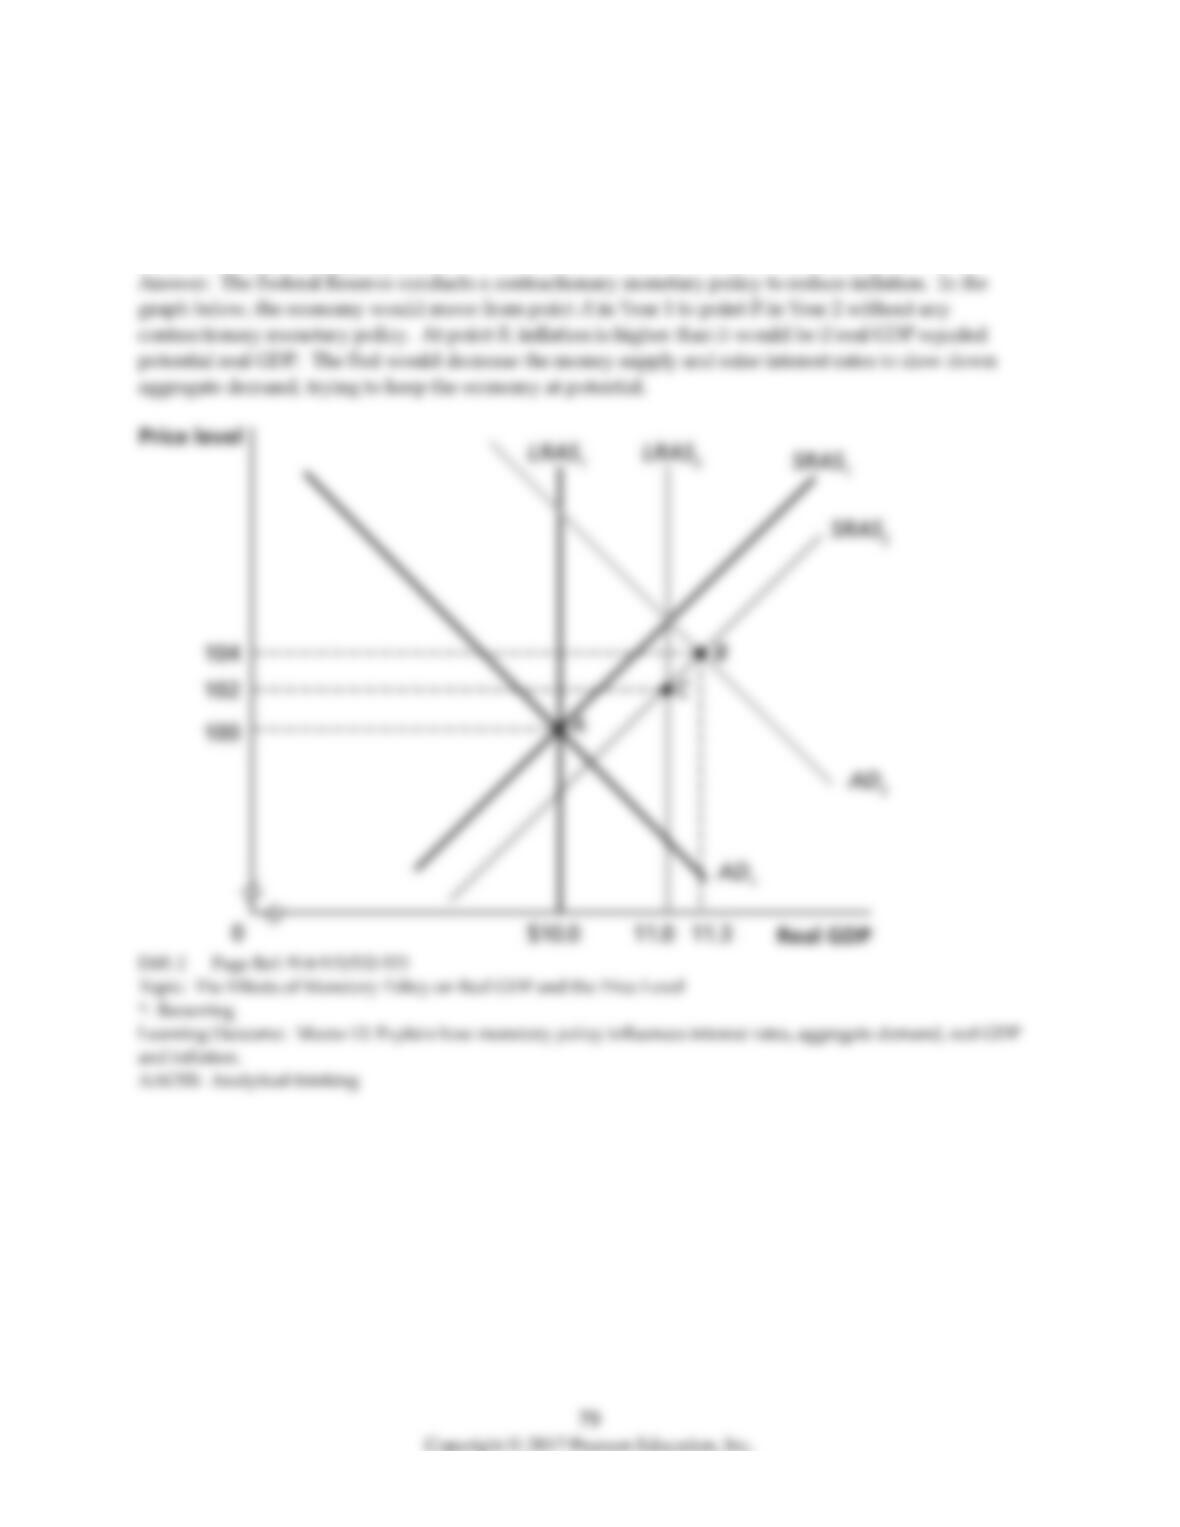
31) Use the dynamic aggregate demand and aggregate supply model and start with Year 1 in long-run
macroeconomic equilibrium. For Year 2, graph aggregate demand, long-run aggregate supply, and
short-run aggregate supply such that the condition of the economy will induce the Federal Reserve to
conduct a contractionary monetary policy. Briefly explain the condition of the economy and what the
Federal Reserve is attempting to do.
15.5 A Closer Look at the Fed’s Setting of Monetary Policy Targets
1) Under the monetary growth rule proposed by the monetarists, the money supply would grow each
year at a constant rate equal to the long-run rate of growth of
A) inflation.
B) real GDP.
C) interest rates.
D) employment.
2) Monetarists think that the Fed should use ________ as a target when conducting monetary policy.
A) the money supply
B) the federal funds rate
C) the Treasury bill rate
D) the inflation rate
E) the unemployment rate
3) With a monetary growth rule as proposed by the monetarists, during a recession the rate of growth of
the money supply would
A) decrease.
B) increase.
C) not change.
D) decrease or increase depending on economic conditions.