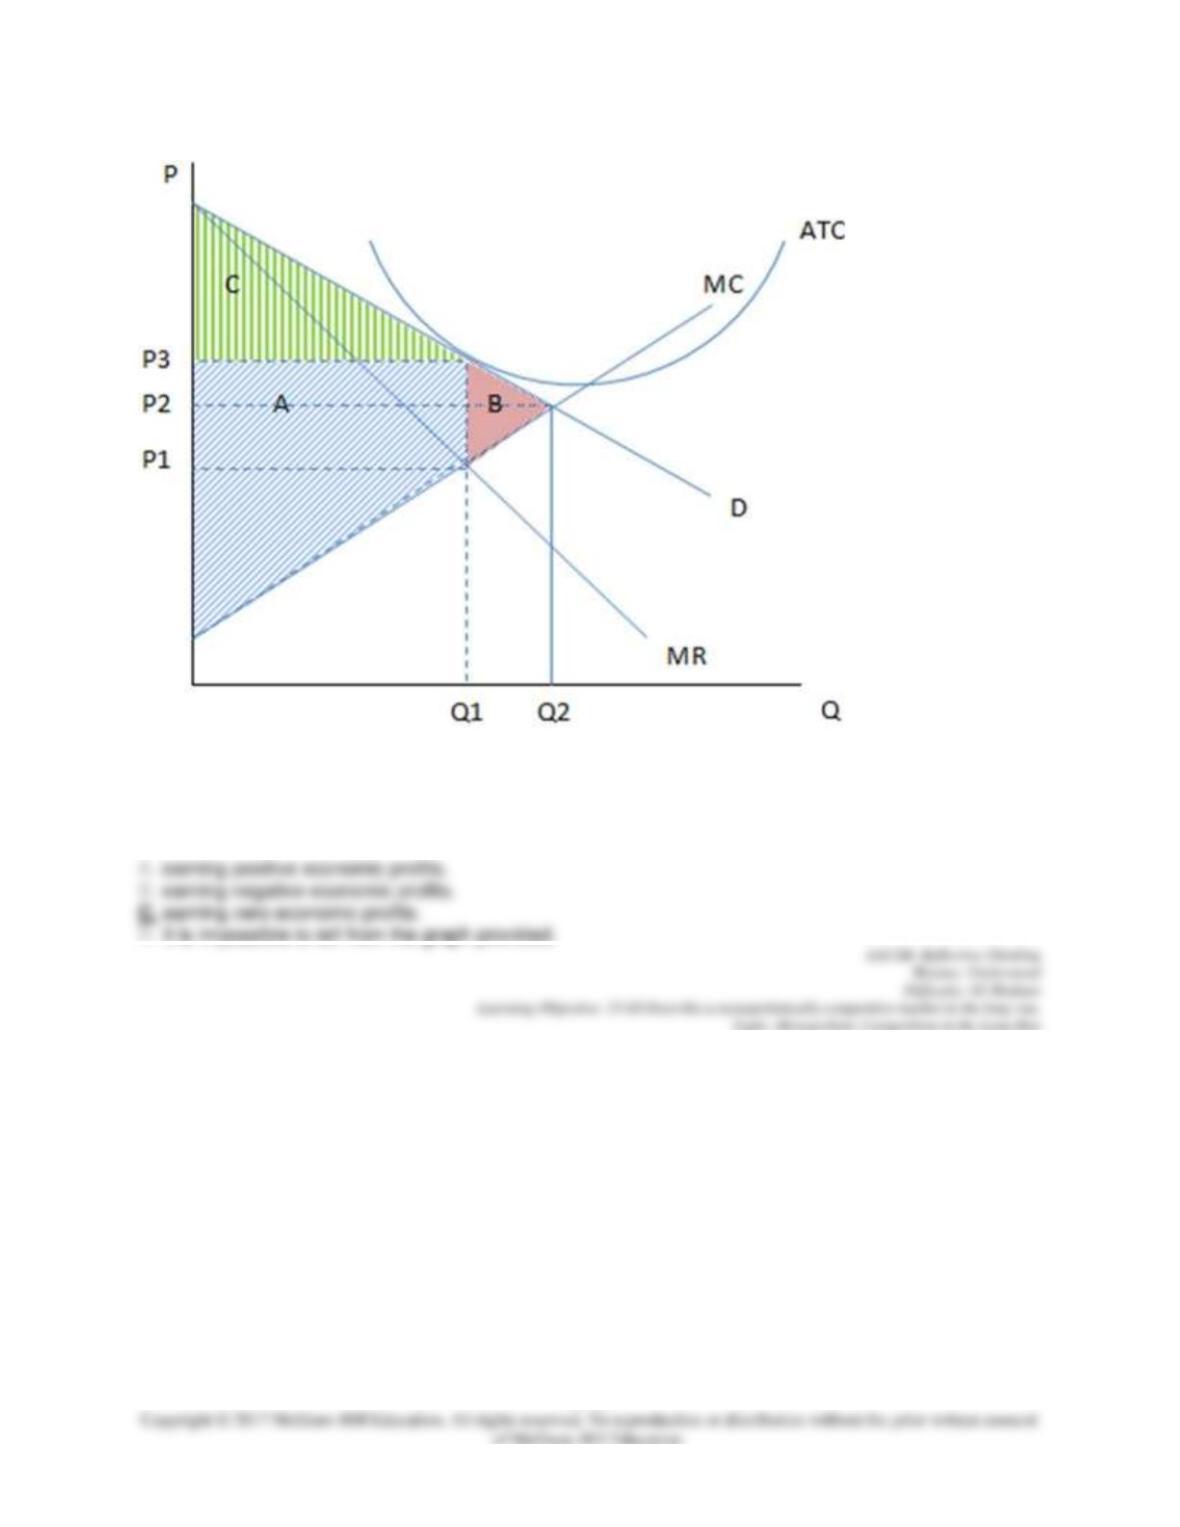
15–21
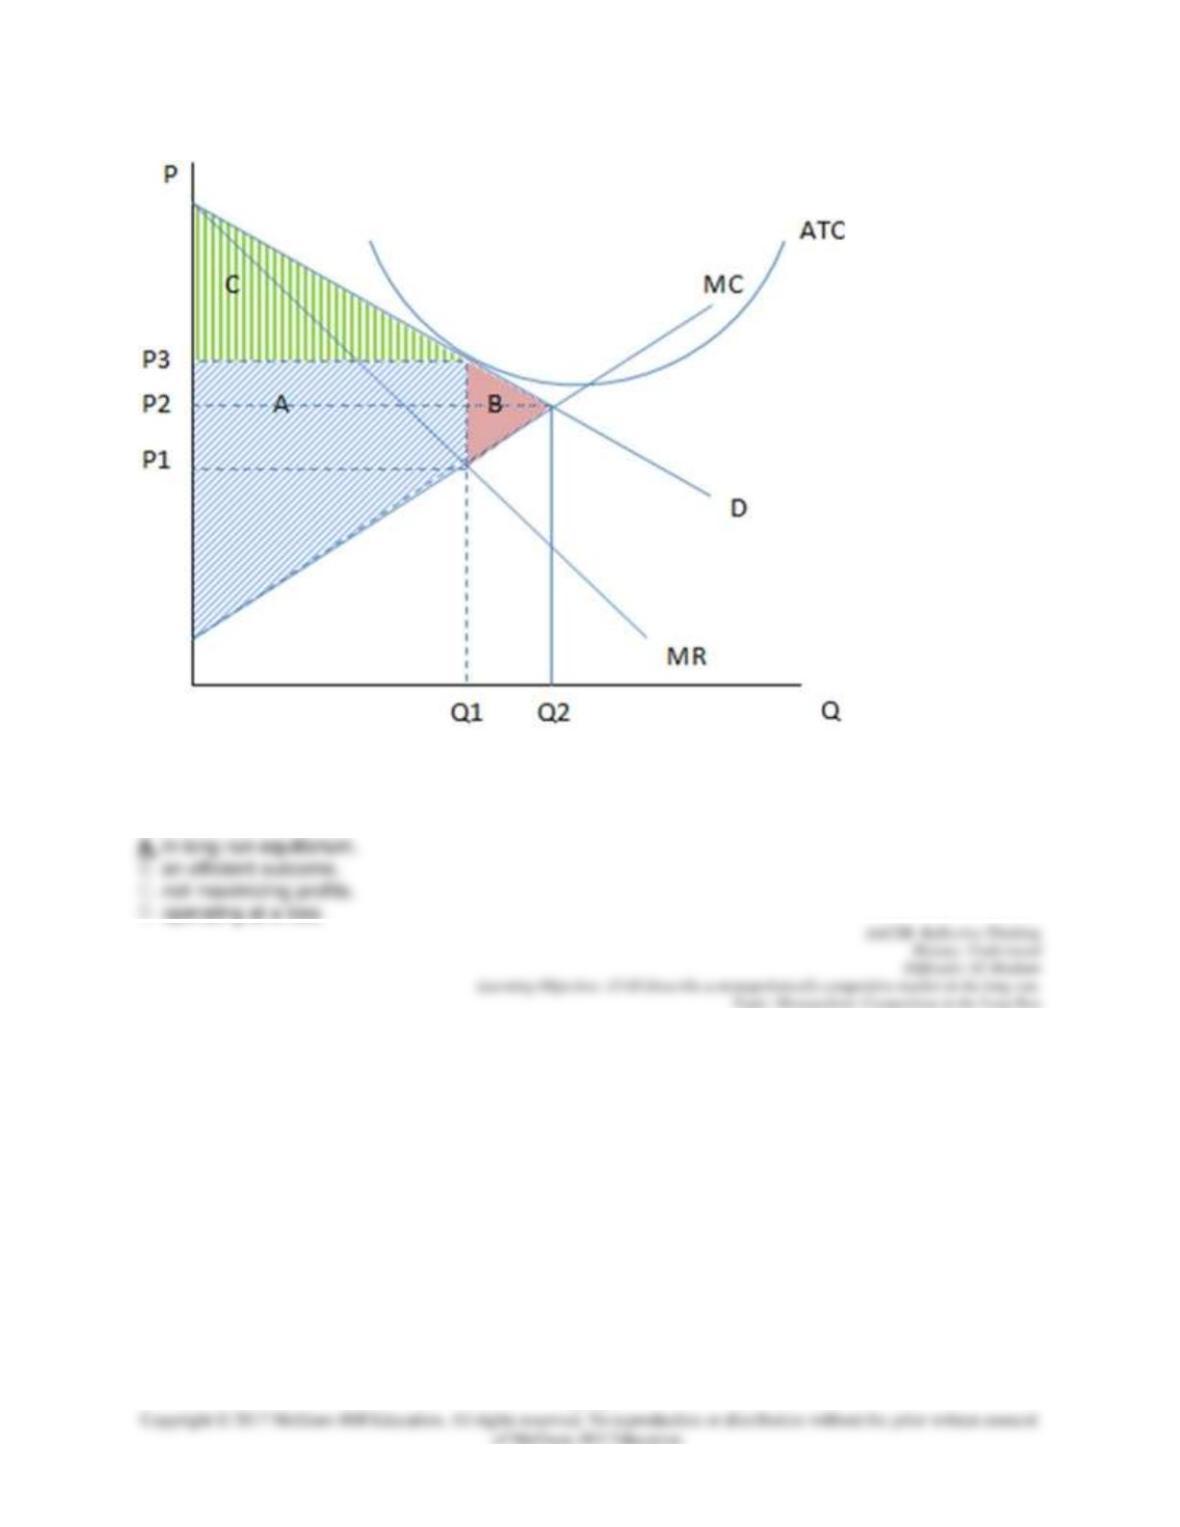
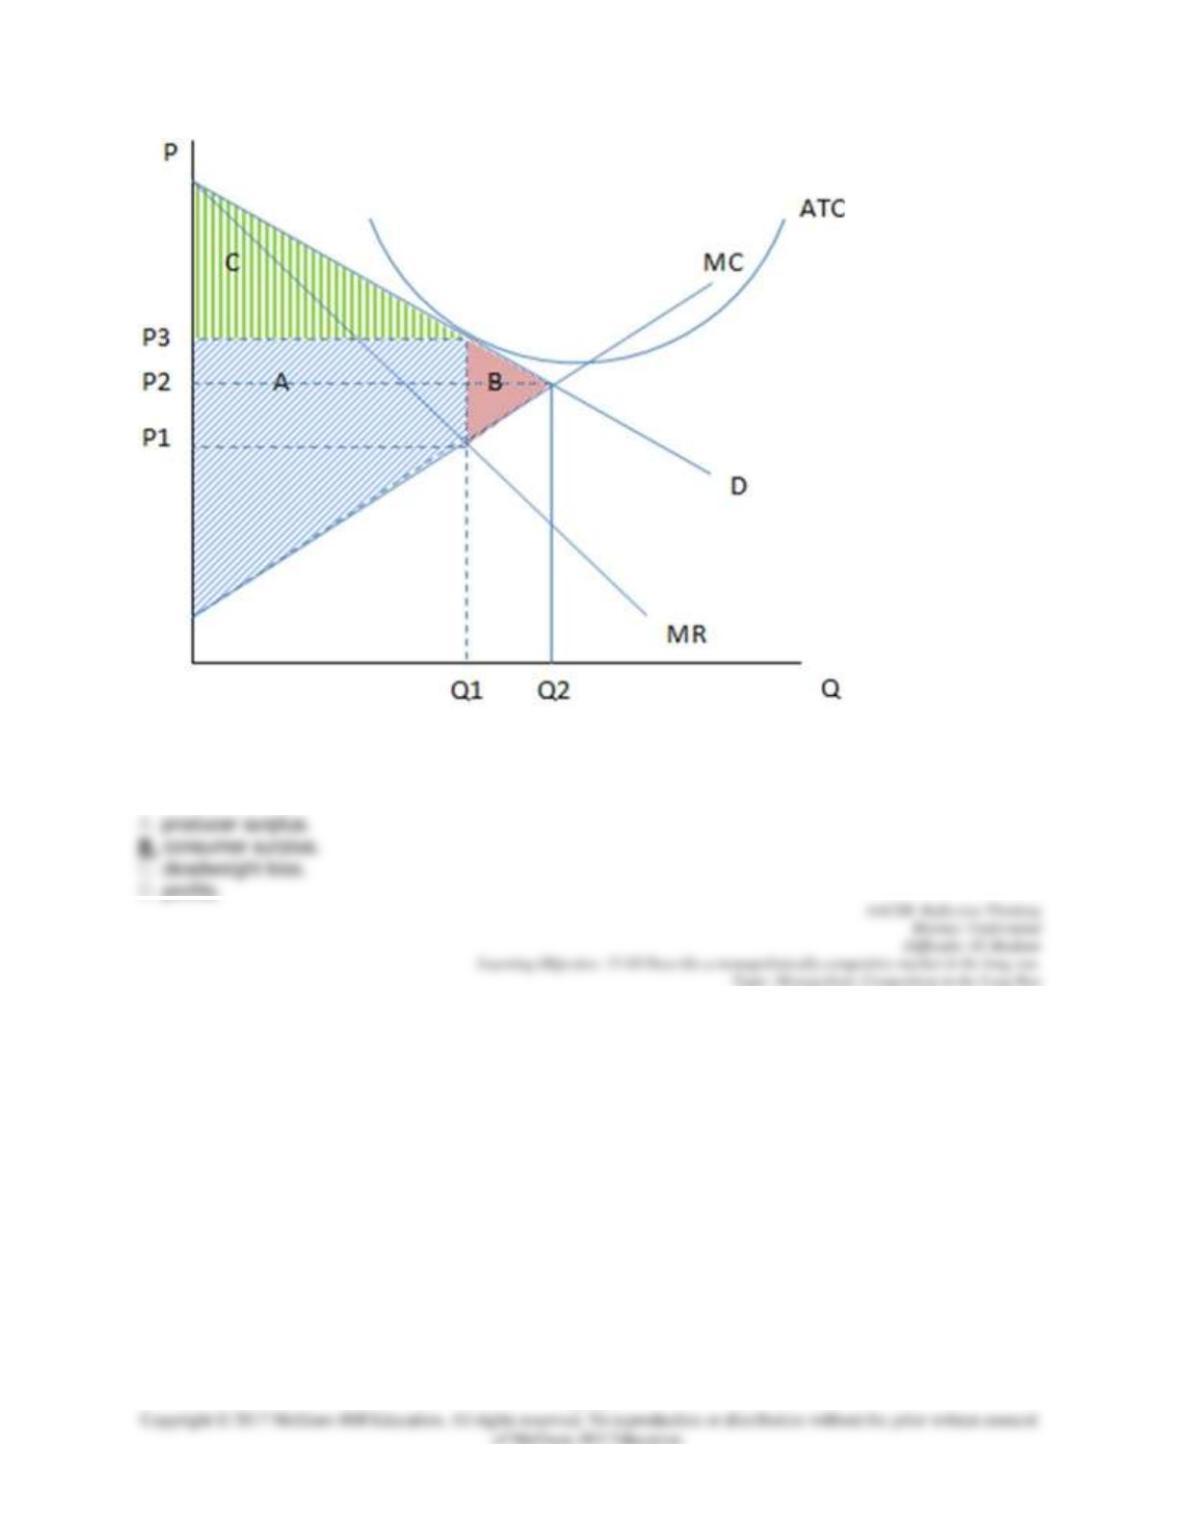
Assuming the firm in the graph shown is producing Q1 and charging P3, it is likely showing the cost and
revenue curves of a monopolistically competitive firm that is:
68. These are the cost and revenue curves associated with a firm.
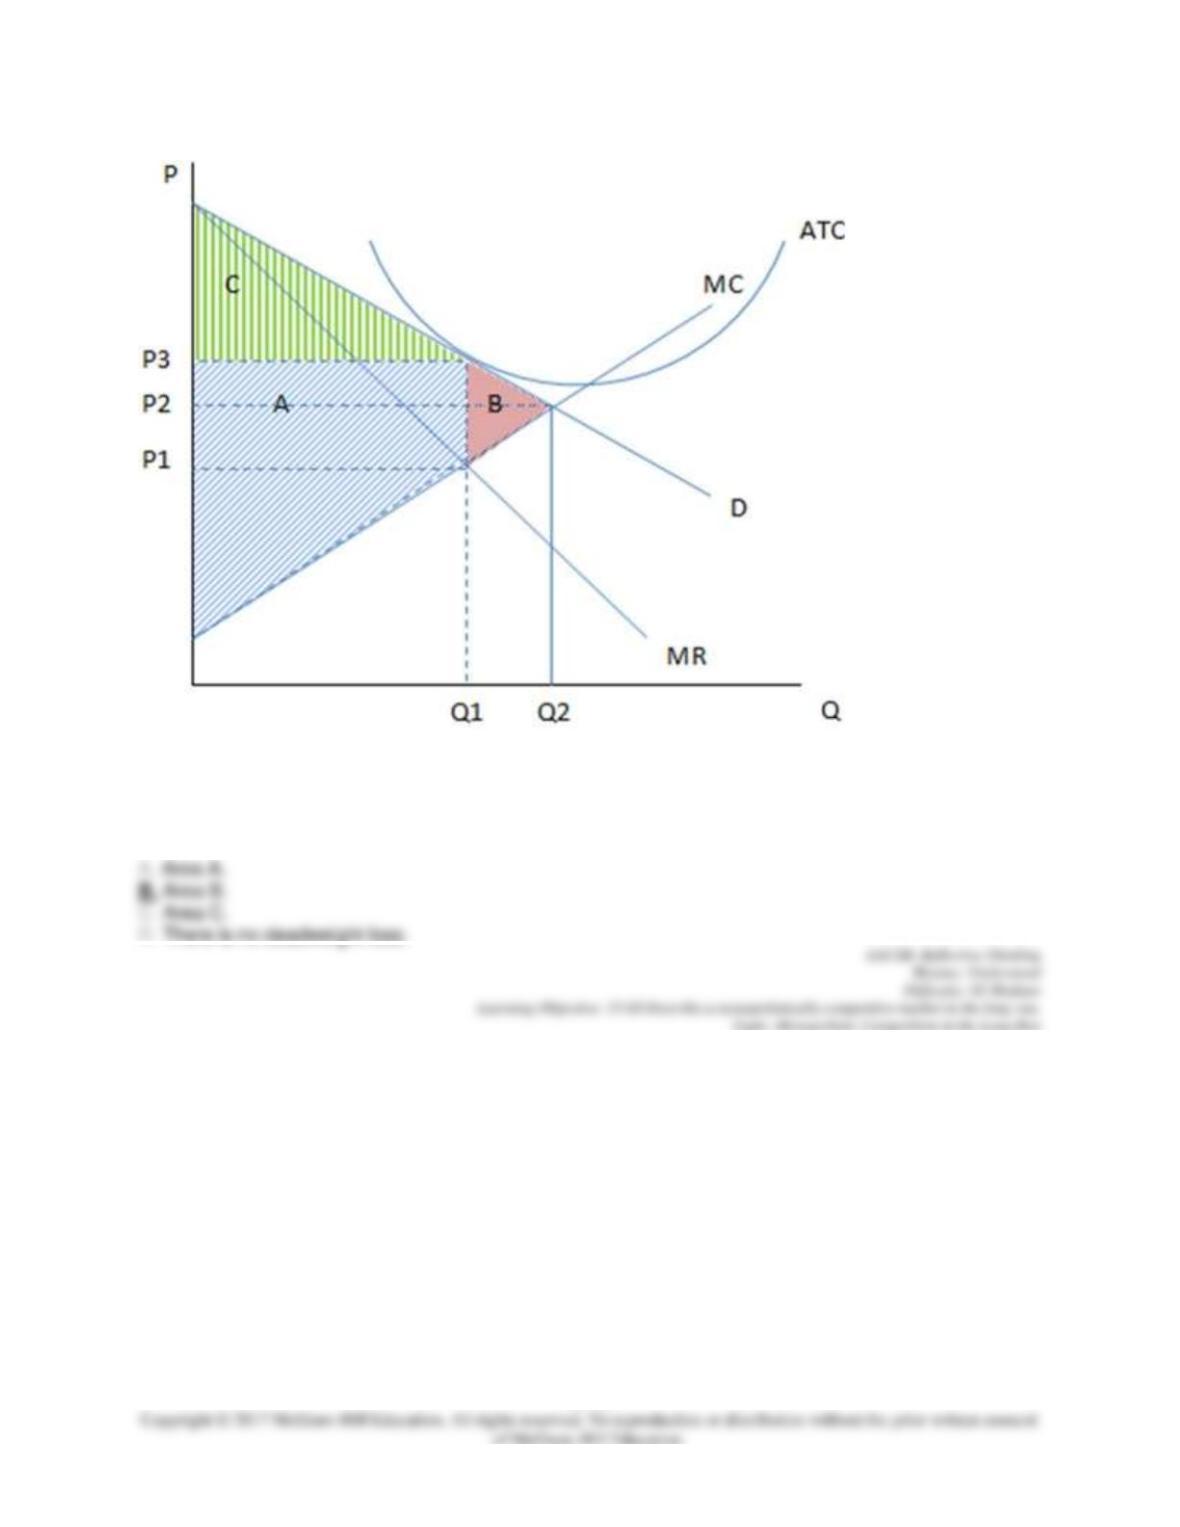
15–22
Assuming the firm in the graph shown is producing Q1 and charging P3 in the long run, then the
deadweight loss is
69. These are the cost and revenue curves associated with a firm.
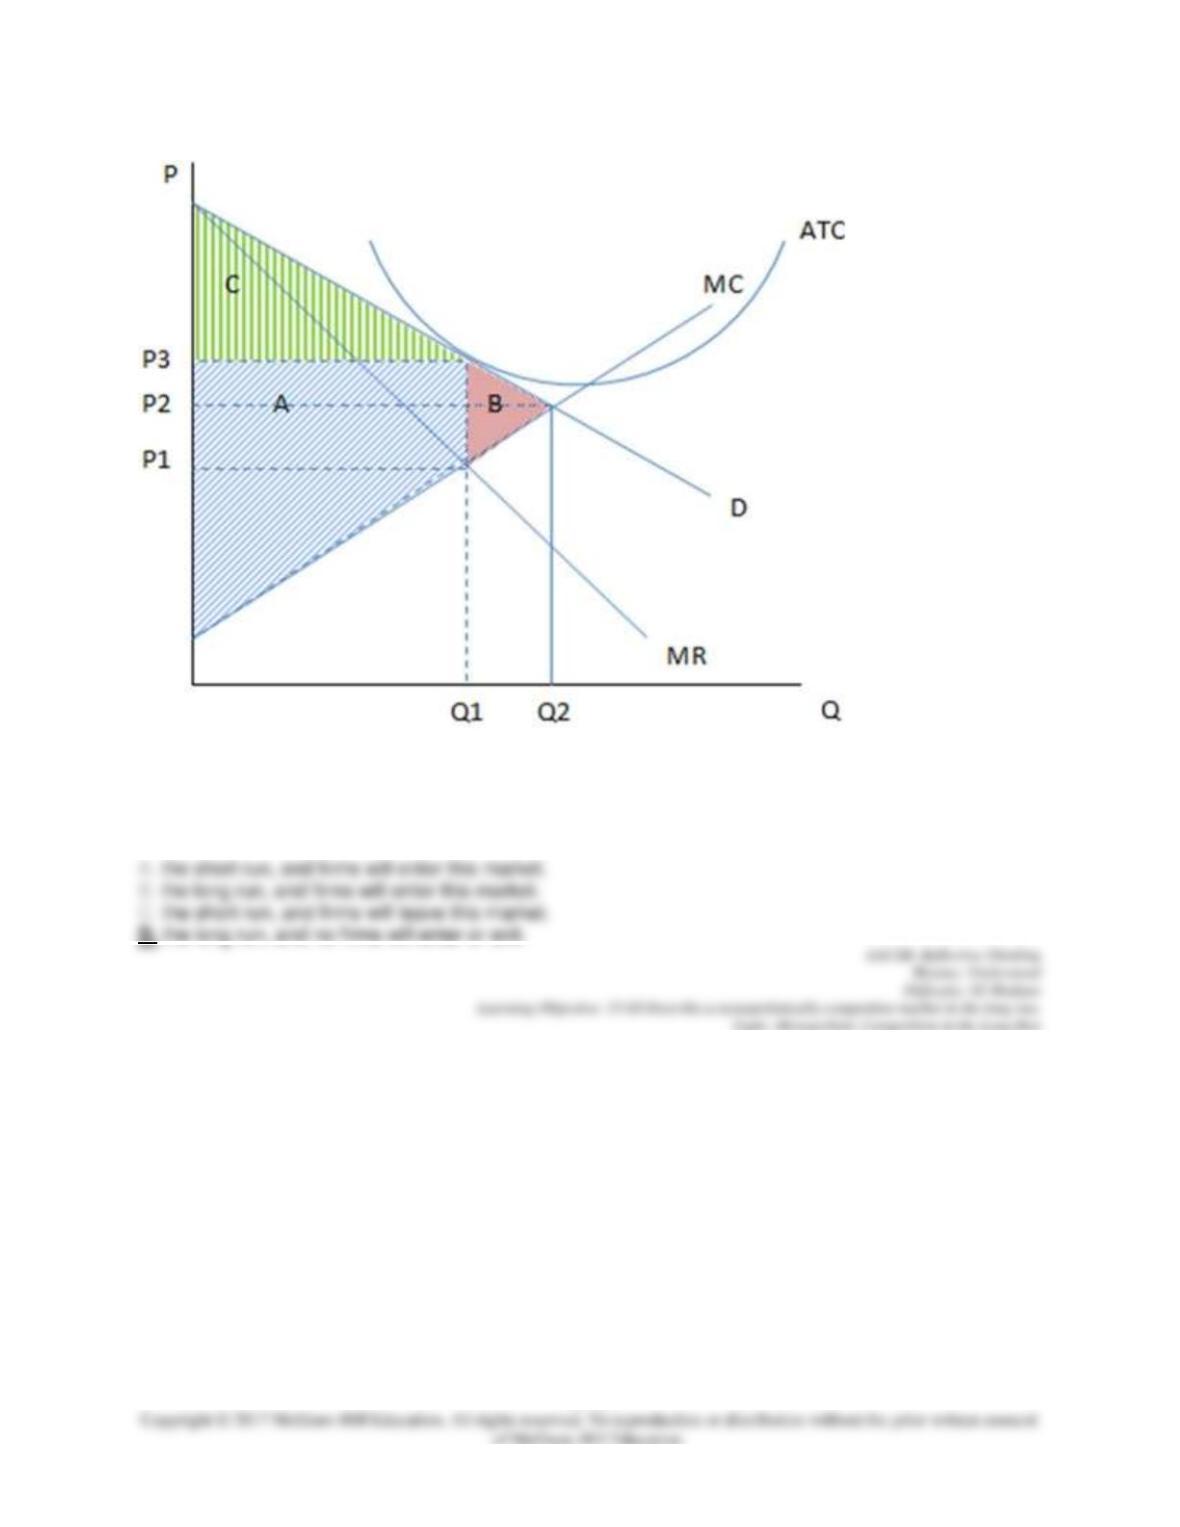
15–23
Assuming the firm in the graph is producing Q1 and charging P3, it is likely showing the cost and revenue
curves of a firm in:
70. These are the cost and revenue curves associated with a firm.
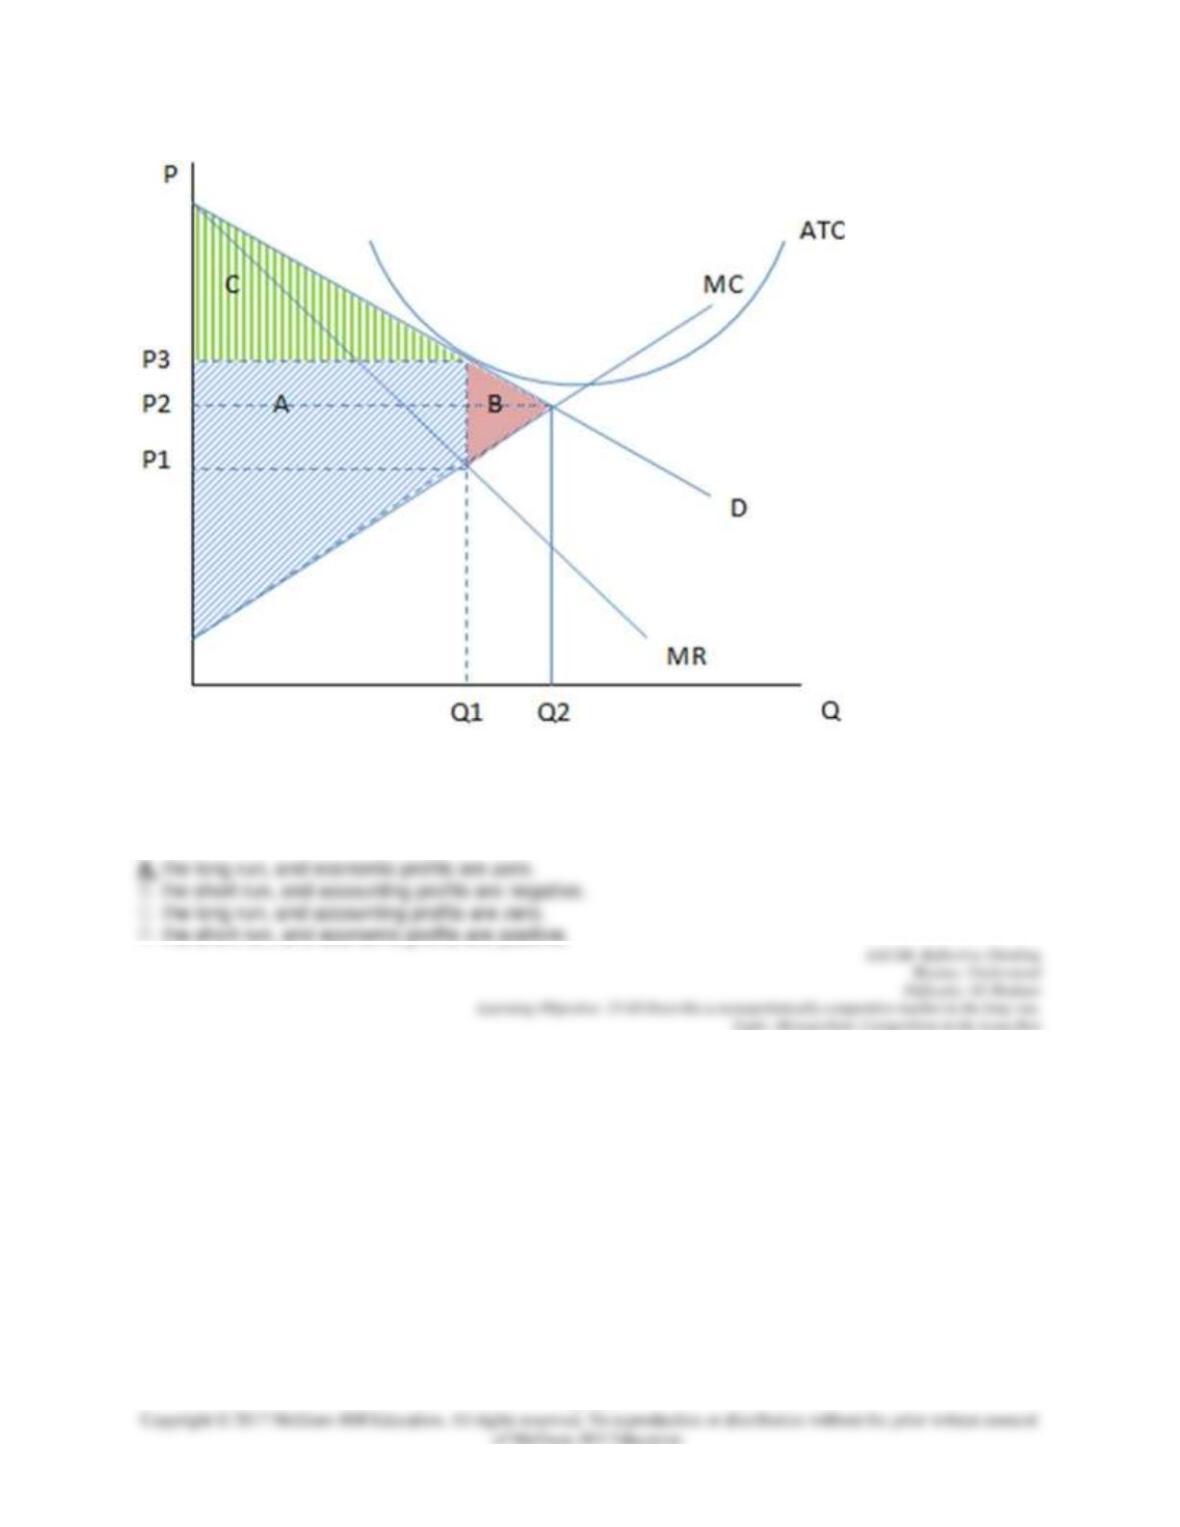
15–24
Assuming the firm in the graph is producing Q1 and charging P3, it is likely showing the cost and revenue
curves of a firm in:
71. These are the cost and revenue curves associated with a firm.
15–25
Assuming the firm in the graph is producing Q1 and charging P3, it is likely:
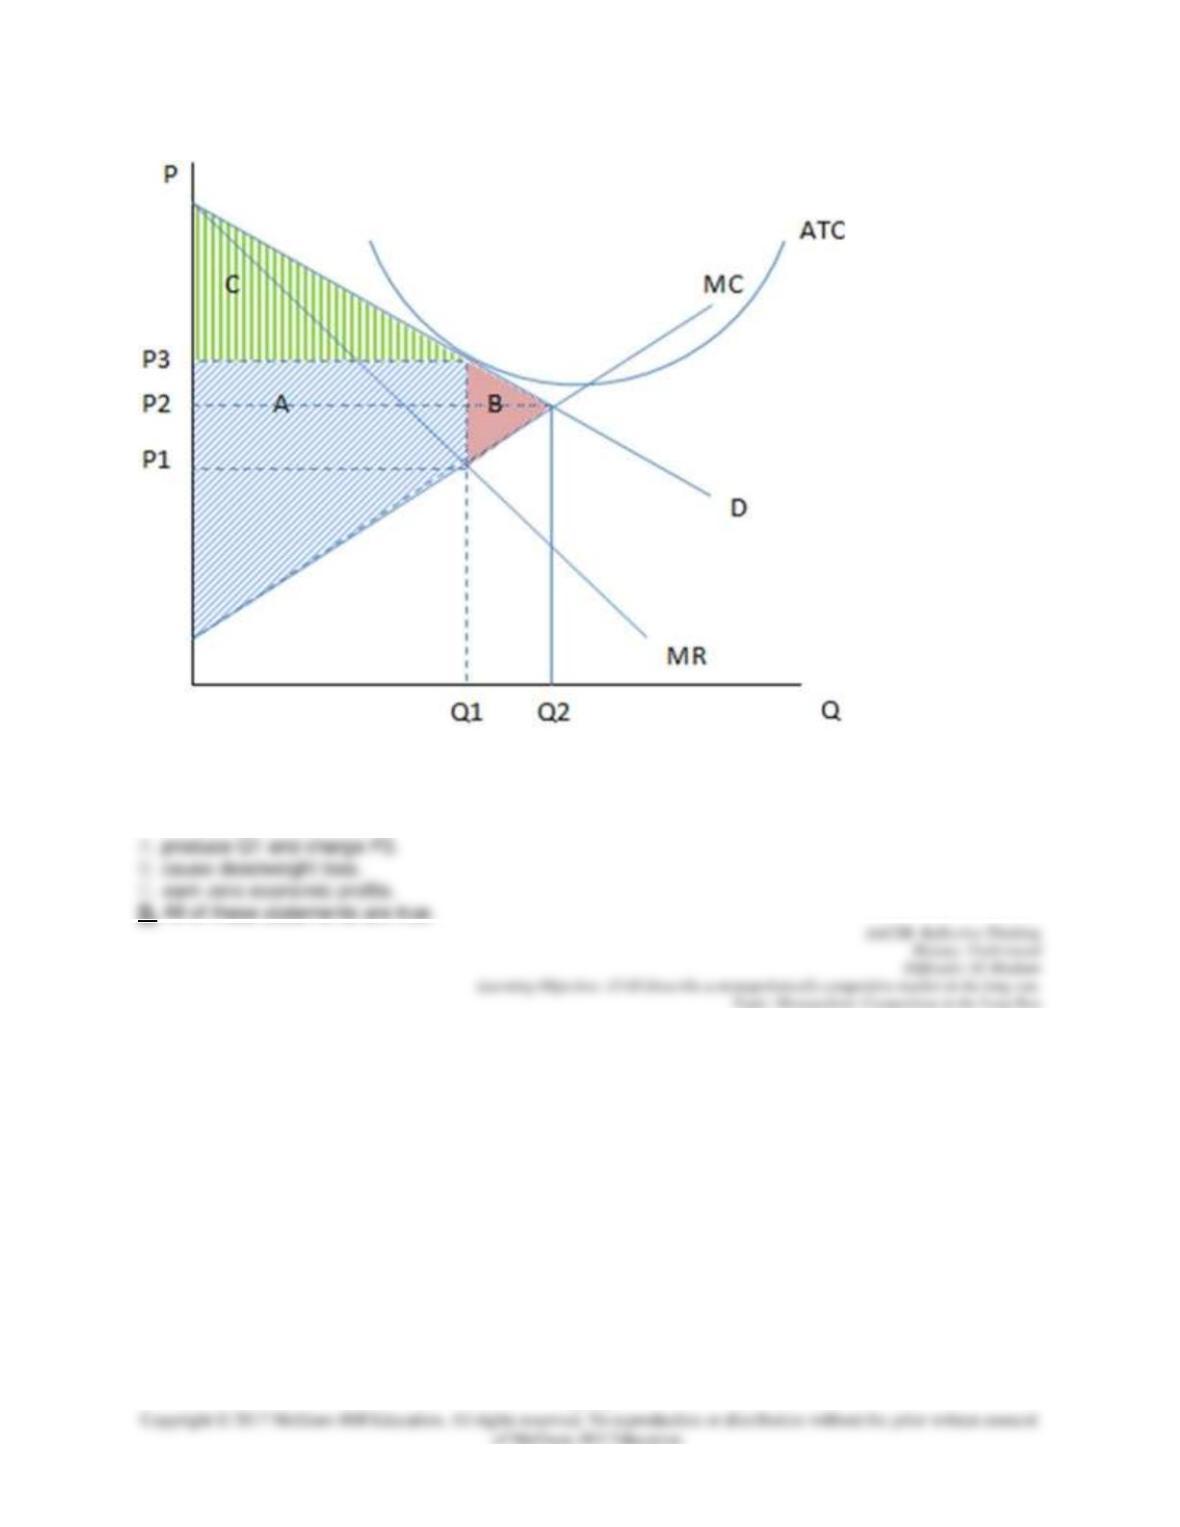
72. These are the cost and revenue curves associated with a firm.
15–26
If the firm in the given graph were to maximize profits, it would:
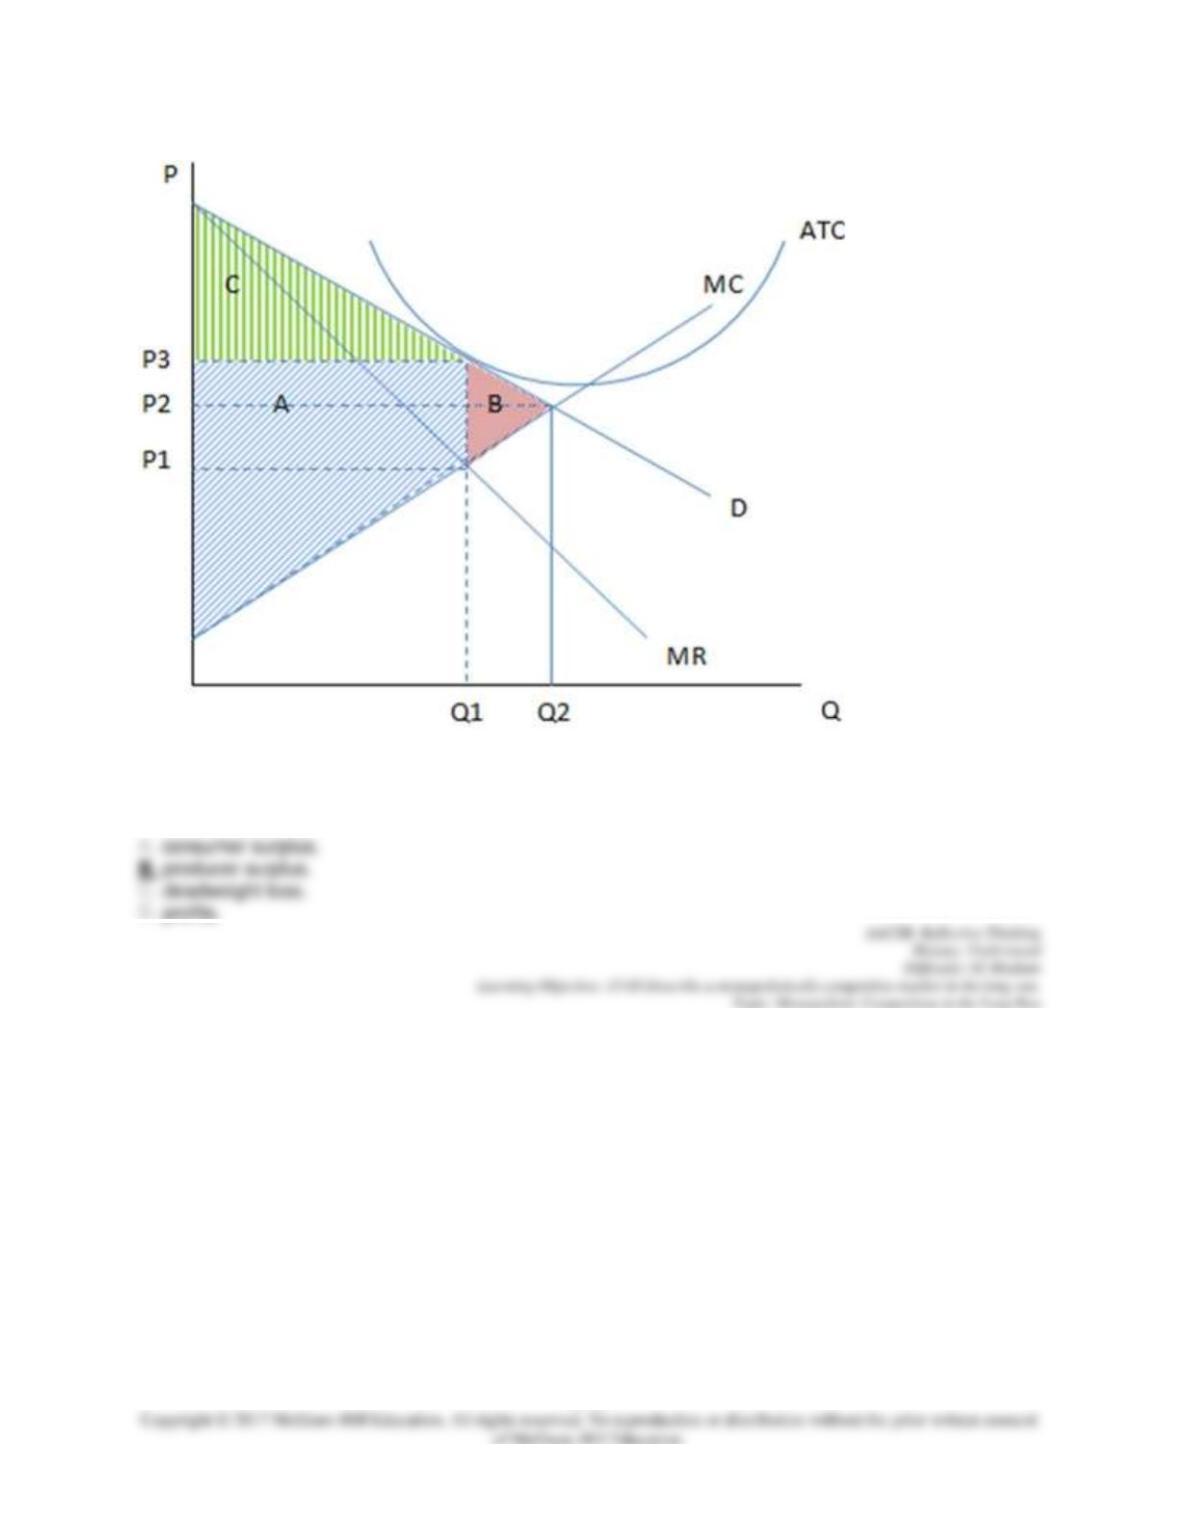
73. These are the cost and revenue curves associated with a firm.
15–27
If the firm in the given graph were to produce Q1 and charge P3, the area A would represent:
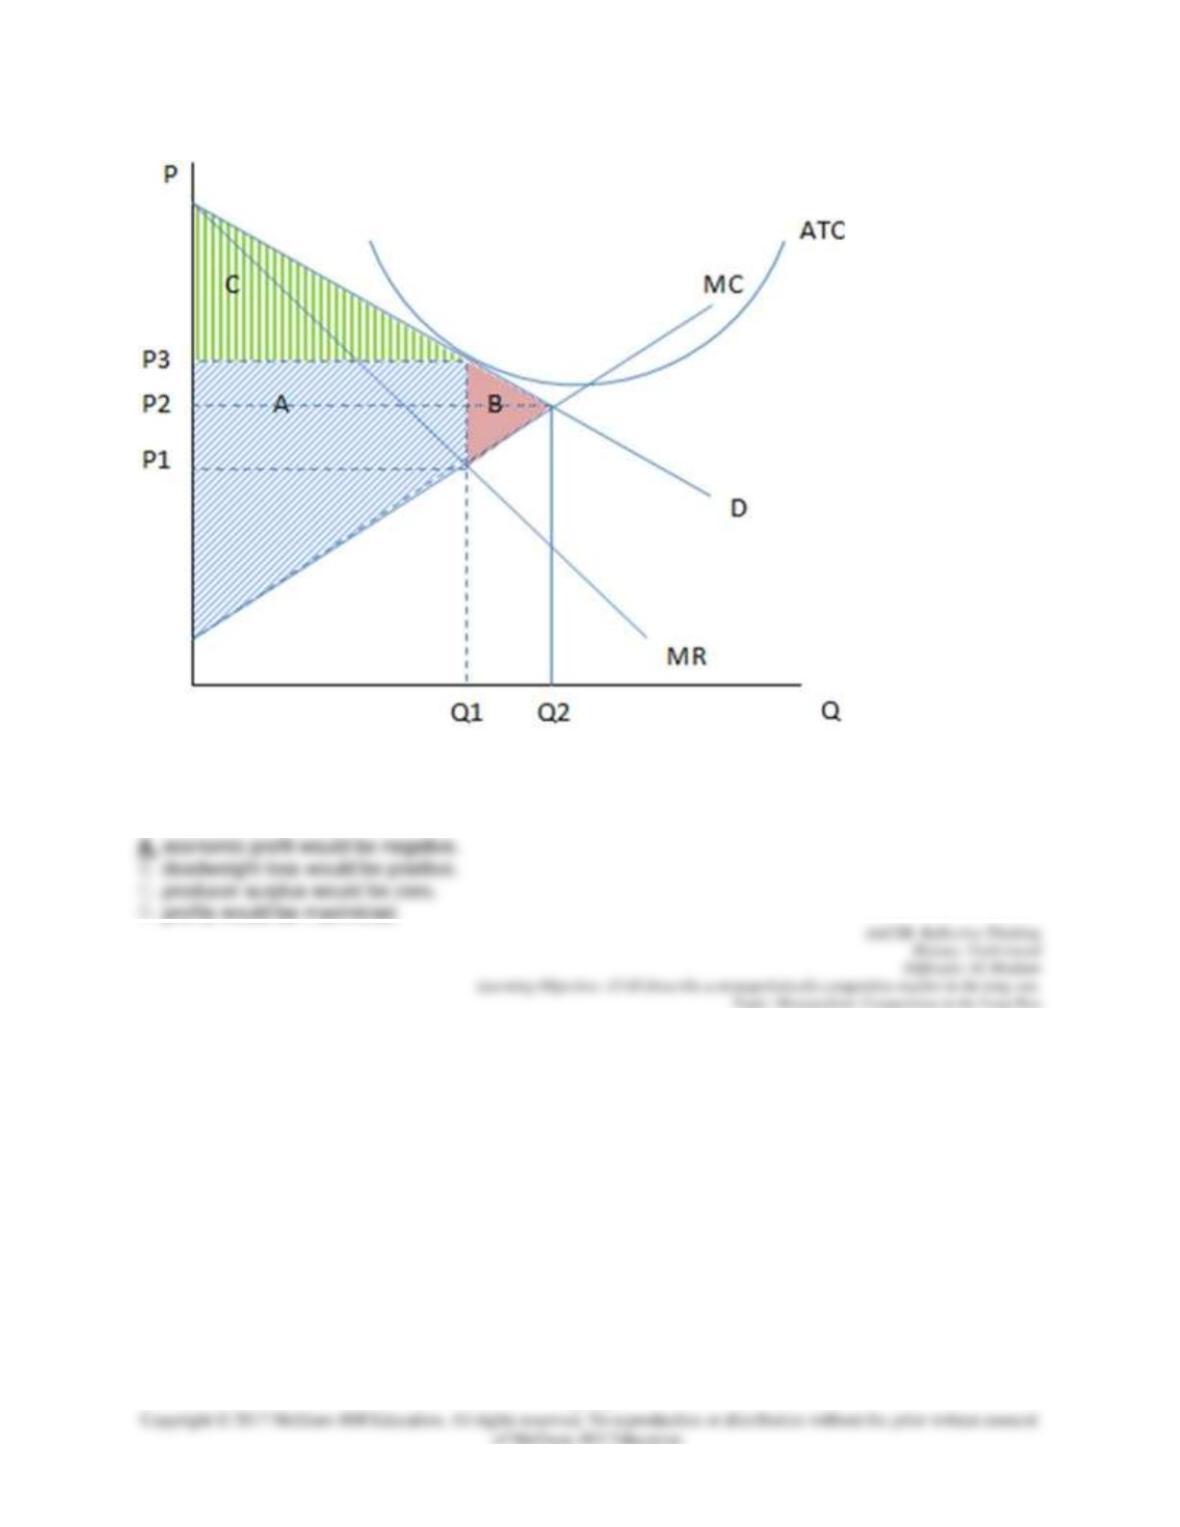
74. These are the cost and revenue curves associated with a firm.
15–28
If the firm in the given graph were to produce Q2 and charge P2, then:
75. These are the cost and revenue curves associated with a firm.
15–29
If the firm in the given graph were to produce Q1 and charge P3, the area C would represent:
76. These are the cost and revenue curves associated with a firm.
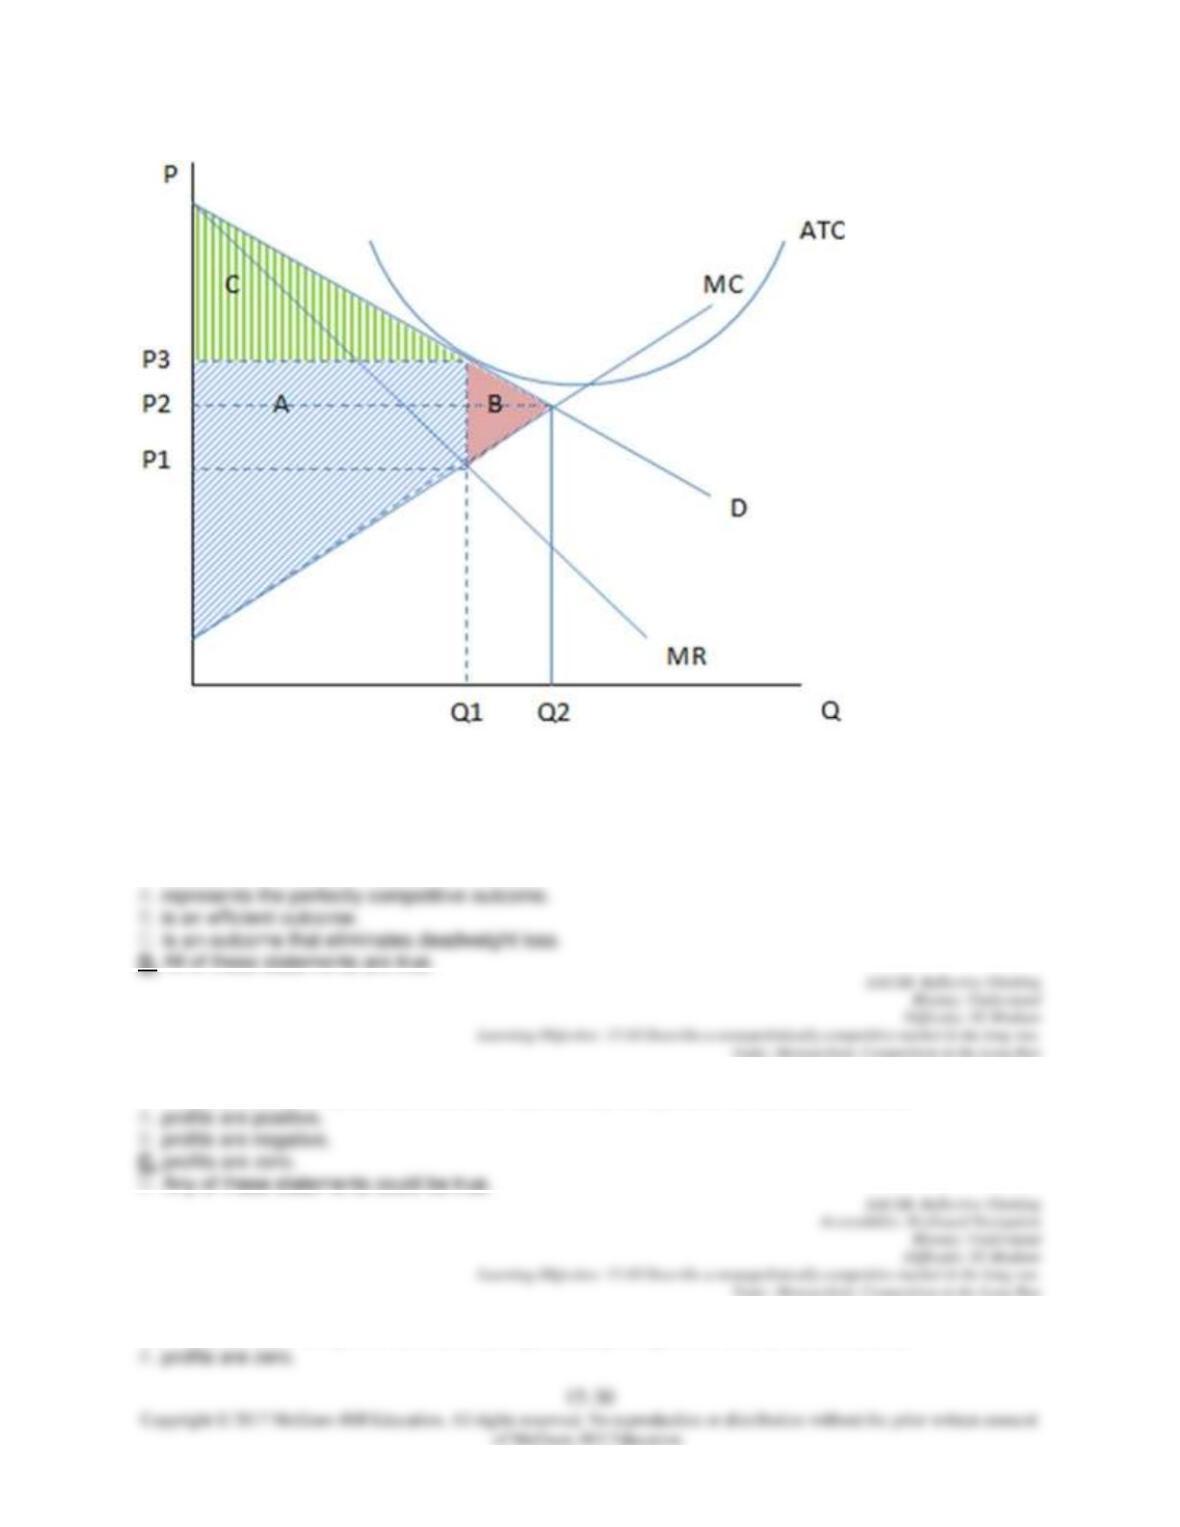
If the firm in the graph were producing Q2 and charging P2, it:
77. The process of entry and exit into a monopolistically competitive market continues until:
78. The process of entry and exit into a monopolistically competitive market continues until:
79. The process of entry and exit into a monopolistically competitive market causes:
80. In the long run, firms in a monopolistically competitive market operate at:
81. In the long run, firms in a monopolistically competitive market operate:
82. In the long run, a profit-maximizing monopolistically competitive firm sells at a price that is:
83. In the long run, a profit-maximizing monopolistically competitive firm sells at a price that is:
84. Monopolistically competitive firms have an incentive to:
85. Which of the following is not a characteristic of monopolistically competitive firms in the long run:
86. Monopolistically competitive firms can earn profits in the long run by:
87. Economists usually believe that:
88. Innovation creates the opportunity to:
89. The long run outcome of the monopolistically competitive firm:
90. The long run outcome of the monopolistically competitive firm:
91. If we were to compare the monopolistically competitive firm’s long run outcome to that of a perfectly
competitive one, we would conclude that the monopolistically competitive firm:
92. If we were to compare the monopolistically competitive firm’s long-run outcome to that of a perfectly
competitive one, we would conclude that the monopolistically competitive firm:
93. Regulating a monopolistically competitive market:
94. Which of the following makes it difficult to regulate a monopolistically competitive market?
95. The welfare loss created by monopolistically competitive markets:
96. If government were to regulate a monopolistically competitive market by setting a single price, a
consequence would be:
97. If government were to regulate a monopolistically competitive market by setting a single price, a
consequence would be:
98. Monopolistically competitive firms have an incentive to:
99. Monopolistically competitive firms can achieve product differentiation through:
100. Advertising:
101. Advertising:
102. If producers strongly object to banning advertising, it probably means that:
103. Spending a lot on advertising:
104. A financial services company may hire a professional athlete as a spokesperson because:
105. Spending a lot on advertising is a credible signal because it:
106. A company with a strong brand identity:
107. Branding:
108. Knowing that Coke controls 80 percent of the cola market and Pepsi controls 20 percent, we can
conclude the cola market is: