
CHAPTER 14A
1. The breakeven point occurs where total revenues intersect with:
a. market returns
b. the risk-free rate
c. total costs
d. total interest and taxes
2. Breakeven analysis is normally performed for a planning period of:
a. five years
b. one year or less
c. ten years
d. one month
3. An example of a noncash outlay is:
a. property
b. marketing costs
c. advertising
d. depreciation
4. Breakeven analysis can be used to assess risk.
a. financial
b. operating
c. sales
d. volume
5. Breakeven analysis can be used:
a. when planning renovations
b. when planning expansions
c. when planning financial resources
d. when planning new product development

Chapter 14A
6. The uses of breakeven analysis are all of the following EXCEPT:
a. forecasting the profitability of the firm
b. forecasting the impact of certain economic conditions on the firm’s profitability
c. analyzing the impact of substituting fixed costs for variable costs in production
d. analyzing the profit impact of a firm’s restructuring efforts.
7. The difference between the selling price per unit and the variable cost per unit is the:
a. contribution to the bottom line
b. contribution to revenue
c. contribution margin
d. contribution to EBIT
8. Another name for breakeven analysis is:
a. cost-volume-profit analysis
b. graphic analysis
c. EBIT-EPS analysis
d. degree of operating leverage
9. In a graphic breakeven analysis, the point where total revenue is less than total cost indicates that the firm has:
a. net operating capital
b. cash flow from investing
c. a negative EBIT
d. a positive return on capital
10. The contribution margin per unit is the difference between:
a. the selling price per unit and fixed costs
b. the fixed costs and the variable costs
c. the variable cost per unit and the selling price per unit
d. the variable costs and the number of units sold
Chapter 14A
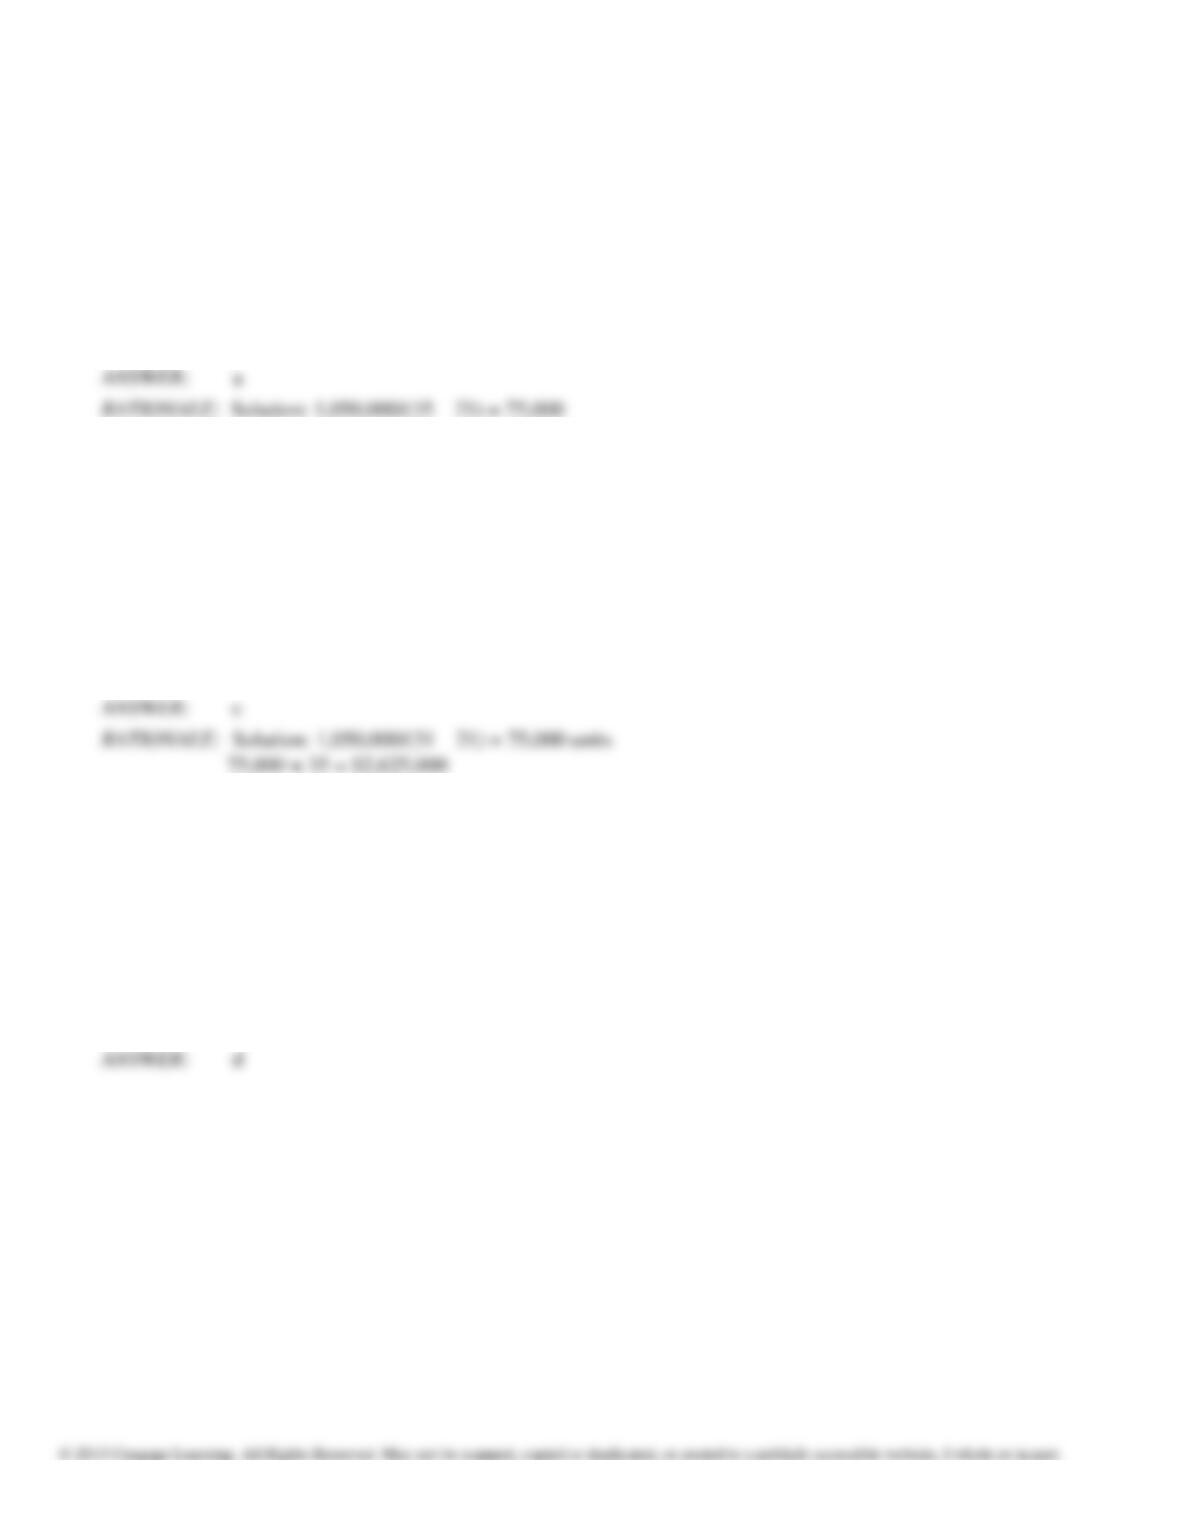
11. The Foggy Futures Weather Network offers an annual almanac for sale each year with information about
predicted weather patterns, severe storm safety tips and a tracking chart. The finished product sells for $35 with
a variable cost per unit of $21. The company has operating costs of $1,050,000. What is the firm’s breakeven
point in units?
a. 75,000
b. 50,000
c. 80,000
d. 65,000
12. The Foggy Futures Weather Network offers an annual almanac for sale each year with information about
predicted weather patterns, severe storm safety tips and a tracking chart. The finished product sells for $35 with
a variable cost per unit of $21. The company has operating costs of $1,050,000. The company has operating
costs of $1,050,000. What is the firm’s breakeven point in dollars?
a. $1,750,000
b. $4,670,000
c. $2,625,000
d. $3,875,566
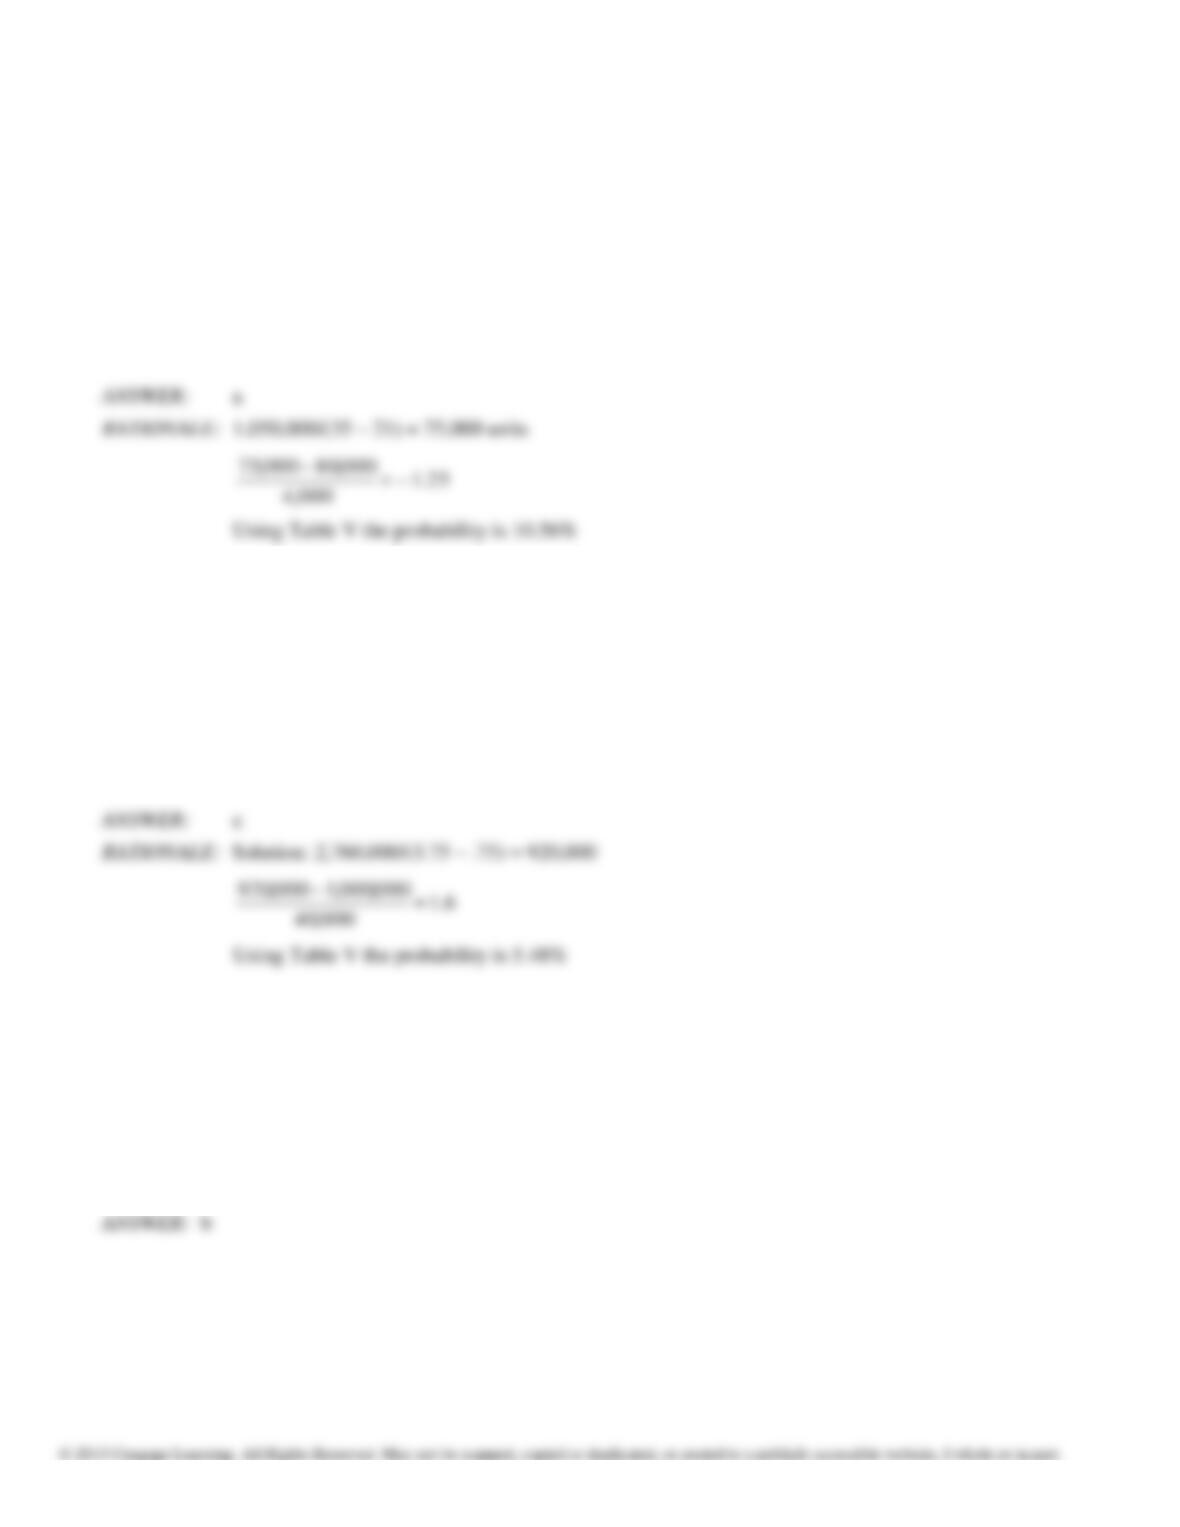
13. The Foggy Futures Weather Network offers an annual almanac for sale each year with information about
predicted weather patterns, severe storm safety tips and a tracking chart. The finished product sells for $35 with
a variable cost per unit of $21. The company has operating costs of $1,050,000. Using 100,000 units as a base,
what is the degree of operating leverage?
a. 6.2
b. 5.7
c. 7.9
d. 4.0
Chapter 14A
14. The Foggy Futures Weather Network offers an annual almanac for sale each year with information about
predicted weather patterns, severe storm safety tips and a tracking chart. The finished product sells for $35 with
a variable cost per unit of $21. The company has operating costs of $1,050,000. What is the probability of the
firm having operating losses if the firm has a standard deviation of 4,000 units and the firm expects to sell
80,000 almanacs? (A normal distribution table – Table V – must accompany this problem)
a. 10.56%
b. 11.12%
c. 14.92%
d. 13.57%
15. Bouncy Bungee Rubber Band Company is trying to determine its probability of incurring a loss. Its fixed costs
are $2,760,000 per year, it sells its rubber bands for $3.75 per pack and the variable cost of these packs is $.75.
They estimate they will sell 1,000,000 packs this year and they have a standard deviation of 40,000 units. (A
normal distribution table – Table V – must accompany this problem).
a. 3.22%
b. 6.71%
c. 5.48%
d. 2.87%
16. Kettle of Fish Hatcheries provides a stocked pond for fishing enthusiasts. They have fixed costs of $525,000,
they charge $50 per person for pond access and the variable costs of stocking the pond average about $15 per
person. How many people need to fish the pond annually to break even?
a. 45,000
b. 15,000
c. 32,000
d. 10,000
Chapter 14A
17. What is the breakeven point for Rough and Tough Clothiers, makers of heavy duty dungarees? They have the
following costs:
raw materials: $15 per pair
labor costs: $ 8 per pair
commissions: $ 2 per pair
utilities: $ 50,000
rent: $ 96,000
taxes: $ 30,000
salaries: $150,000
The price of the dungarees is $55 per pair.
a. 13,040
b. 10,867
c. 25,000
d. 17,650
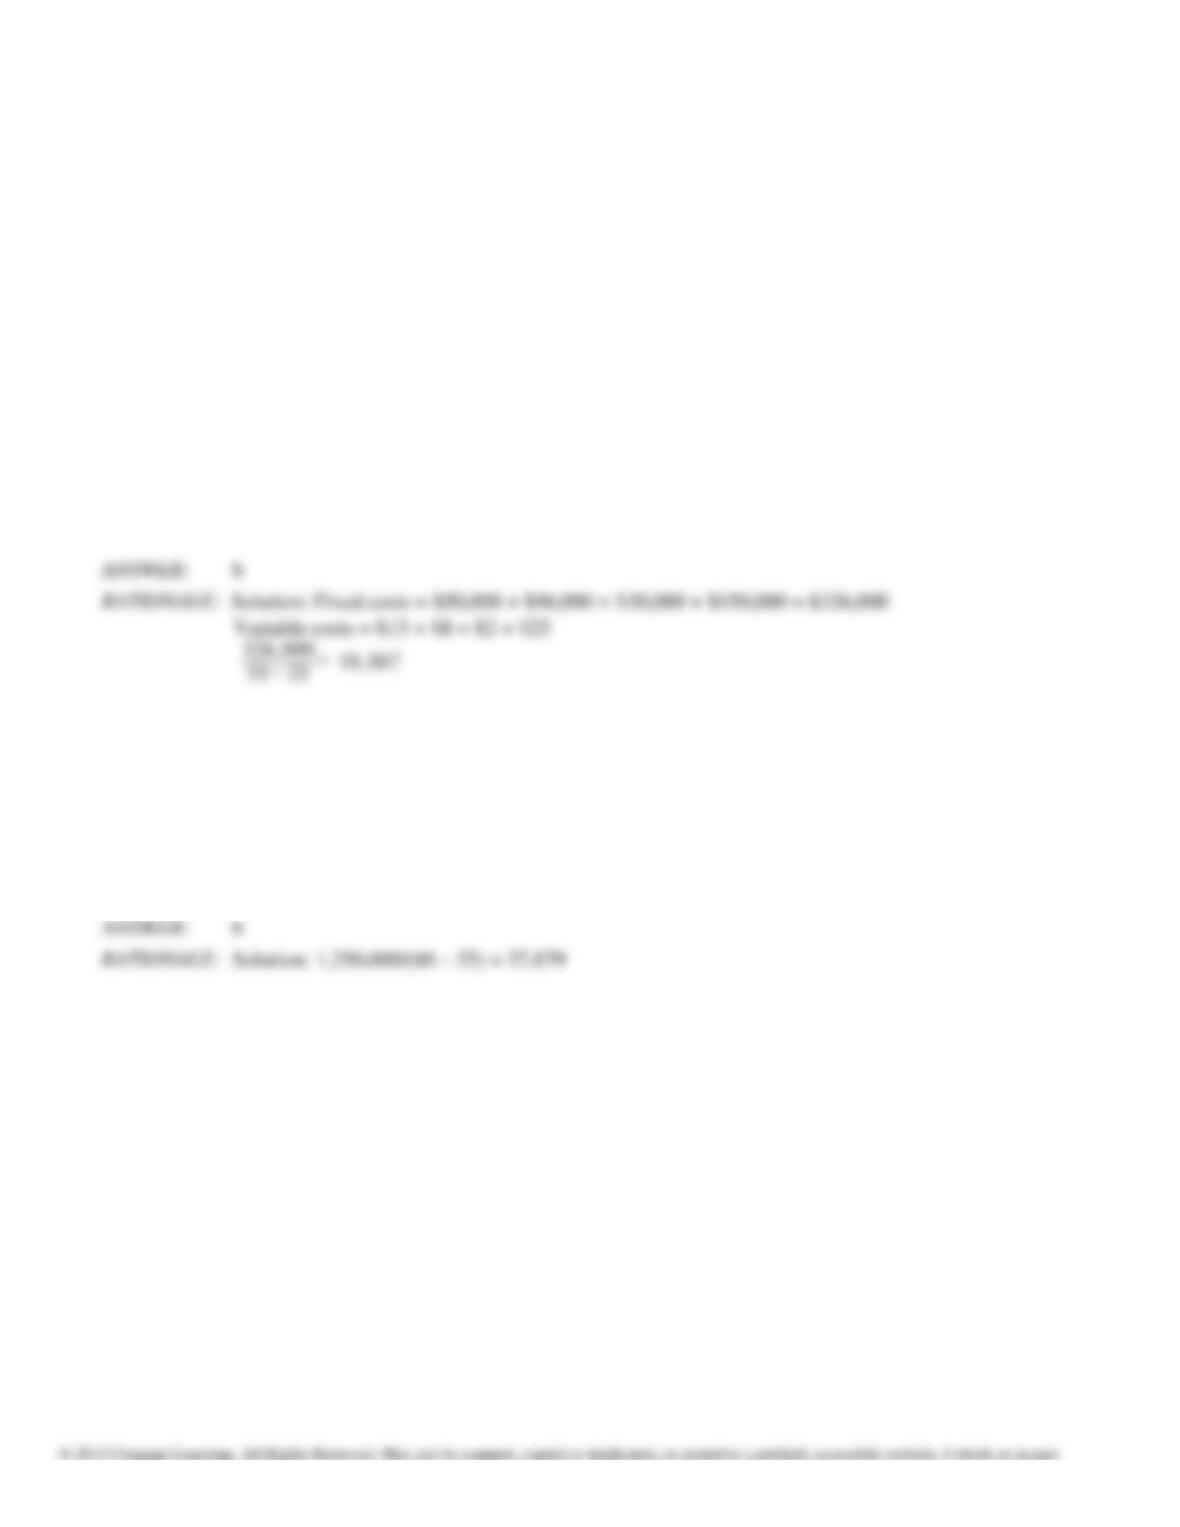
18. The Fanny Nanny Weight Monitors Corporation offers an annual diet plans for sale each year with information
about nutrition, diet tips and food substitutes. The finished product sells for $60 with a variable cost per unit of
$27. The company has fixed operating costs of $1,250,000. What is its breakeven point?
a. 22,187
b. 37,879
c. 56,124
d. 48,961
Chapter 14A
19. What is the breakeven point in dollars for Zippy Dippy Swimwear, makers of bathing suits and accessories?
They have the following costs:
raw materials: $25 per bathing suit
$ 8 per towel
$16 per beach umbrella
$37 per swimsuit cover-up
labor costs: $18 average per suit
$10 per umbrella
$ 3 per towel
$20 per cover-up
commissions: $12 per item
utilities: $150,000
rent: $196,000
taxes: $230,000
salaries: $550,000
The price of each suit is $85.
The price of each towel is $25.
The price of each umbrella is $40.
The price of each cover-up is $81.
a. $3,172,024
b. $4,947,196
c. $7,887,259
d. $6,425,583
20. What are the possible uses for breakeven analysis?
Chapter 14A
21. List the limitations of breakeven analysis:
22. How can a firm have more than one breakeven output point?
23. Explain the composition of operating costs and why they can cause an inaccurate breakeven analysis.