Reference: Ref 14-1
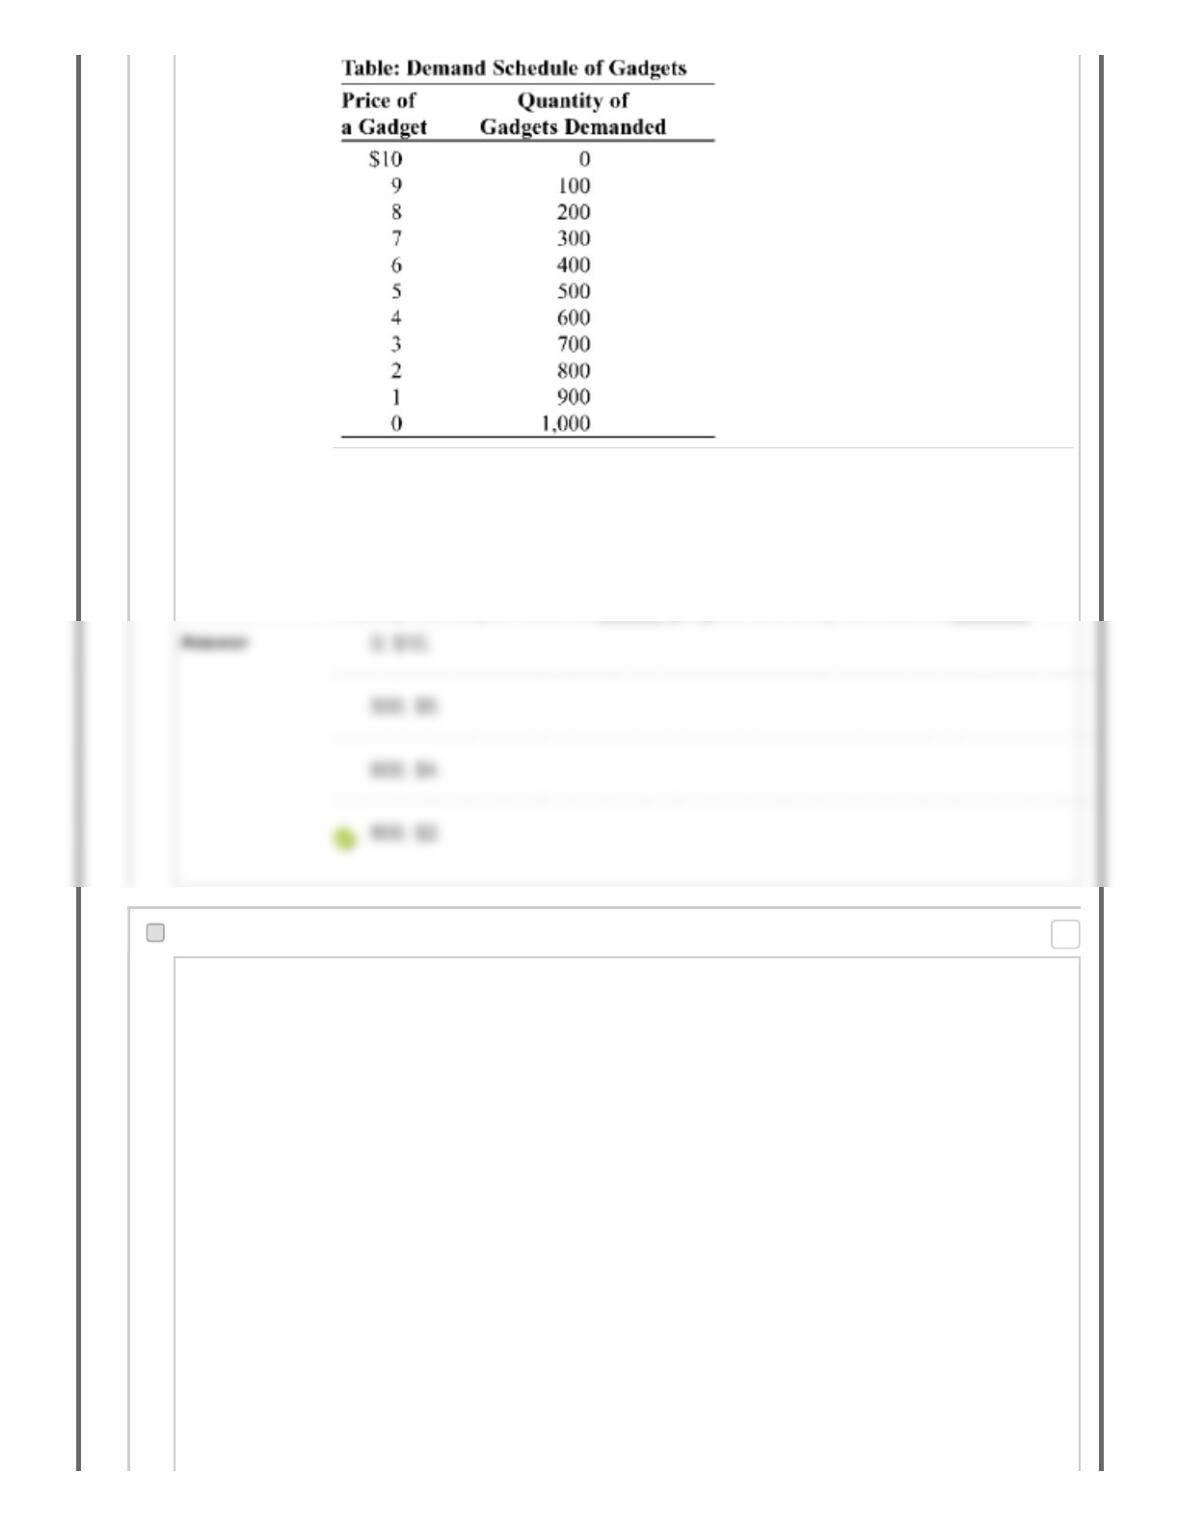
(Table: Demand Schedule for Gadgets) Look at the table Demand Schedule for
Gadgets. The market for gadgets is dominated by two producers, Margaret and
Ray. Each firm can produce gadgets at a marginal cost of $2. The table shows the
market demand schedule for gadgets. If the industry was a perfectly competitive
industry, the output would be ______ gadgets, and the price would be_______.
84. Multiple Choice: Figure: Monopoly Profits in Duopoly R...
Question
Points: 0
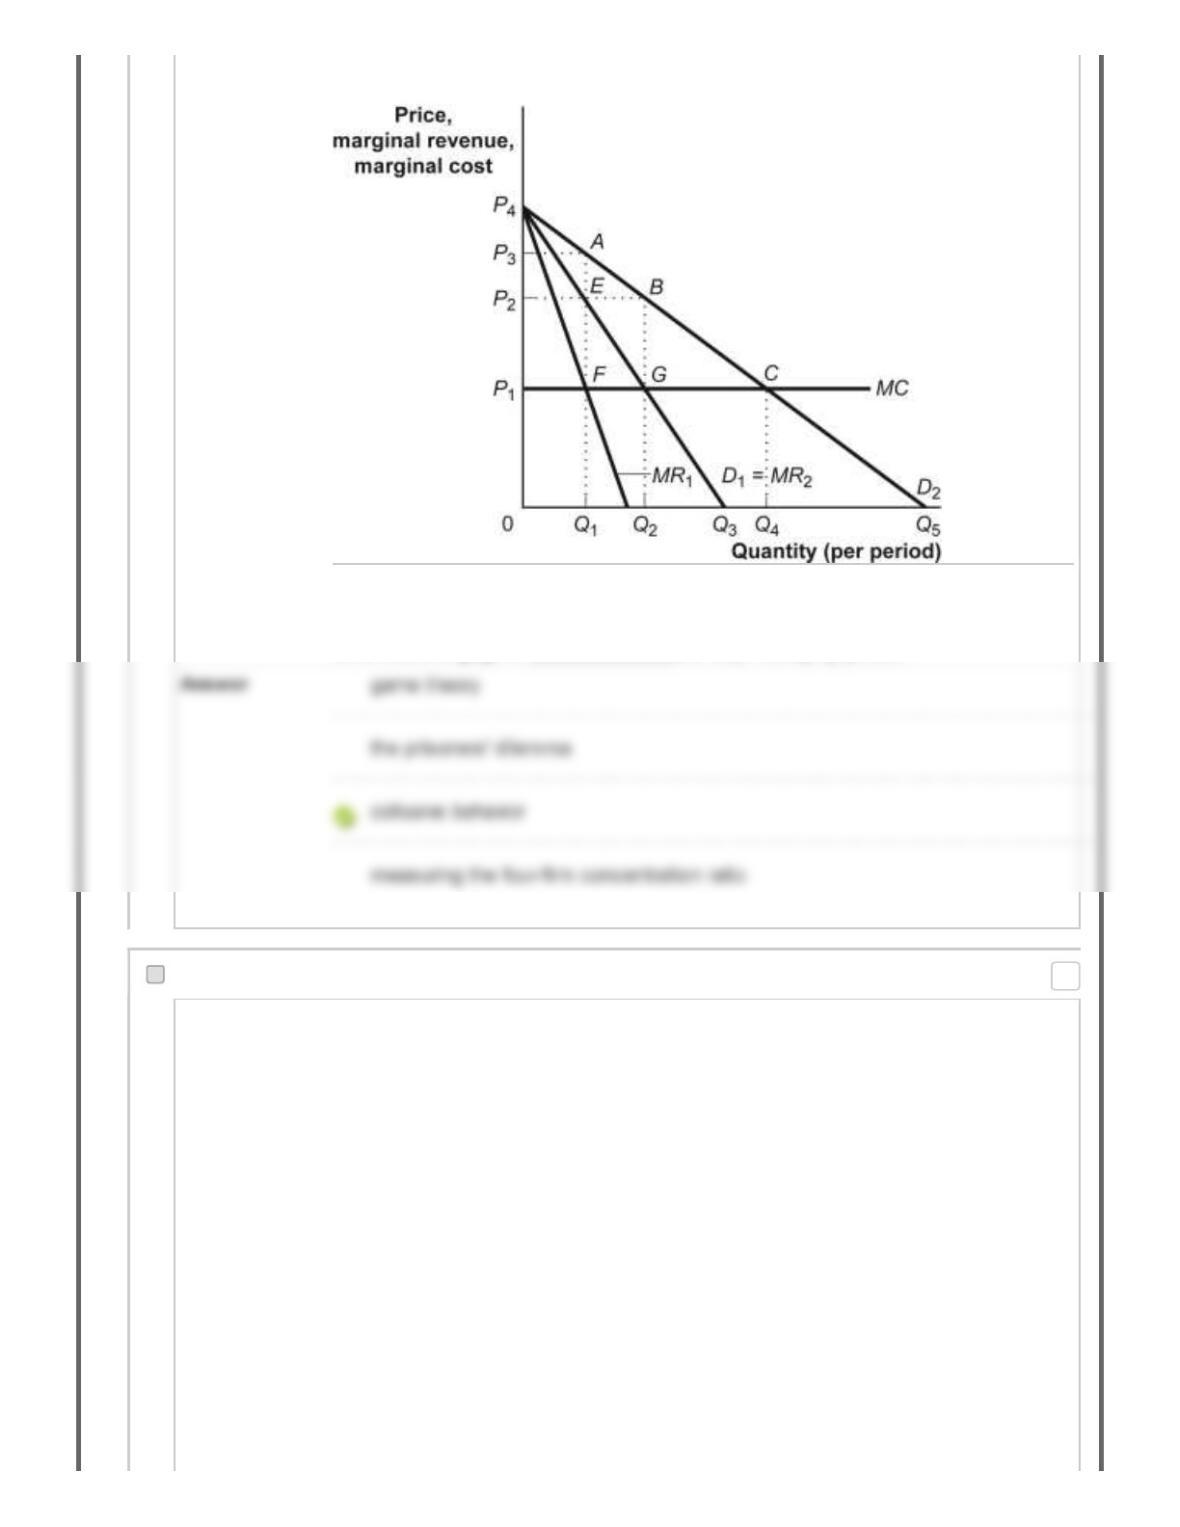
Figure: Monopoly Profits in Duopoly
Reference: Ref 14-2
(Figure: Monopoly Profits in Duopoly) In the figure Monopoly Profits in Duopoly, two
firms could engage in _____________and reap monopoly profits.
85. Multiple Choice: Figure: Monopoly Profits in Duopoly R...
Question
Points: 0
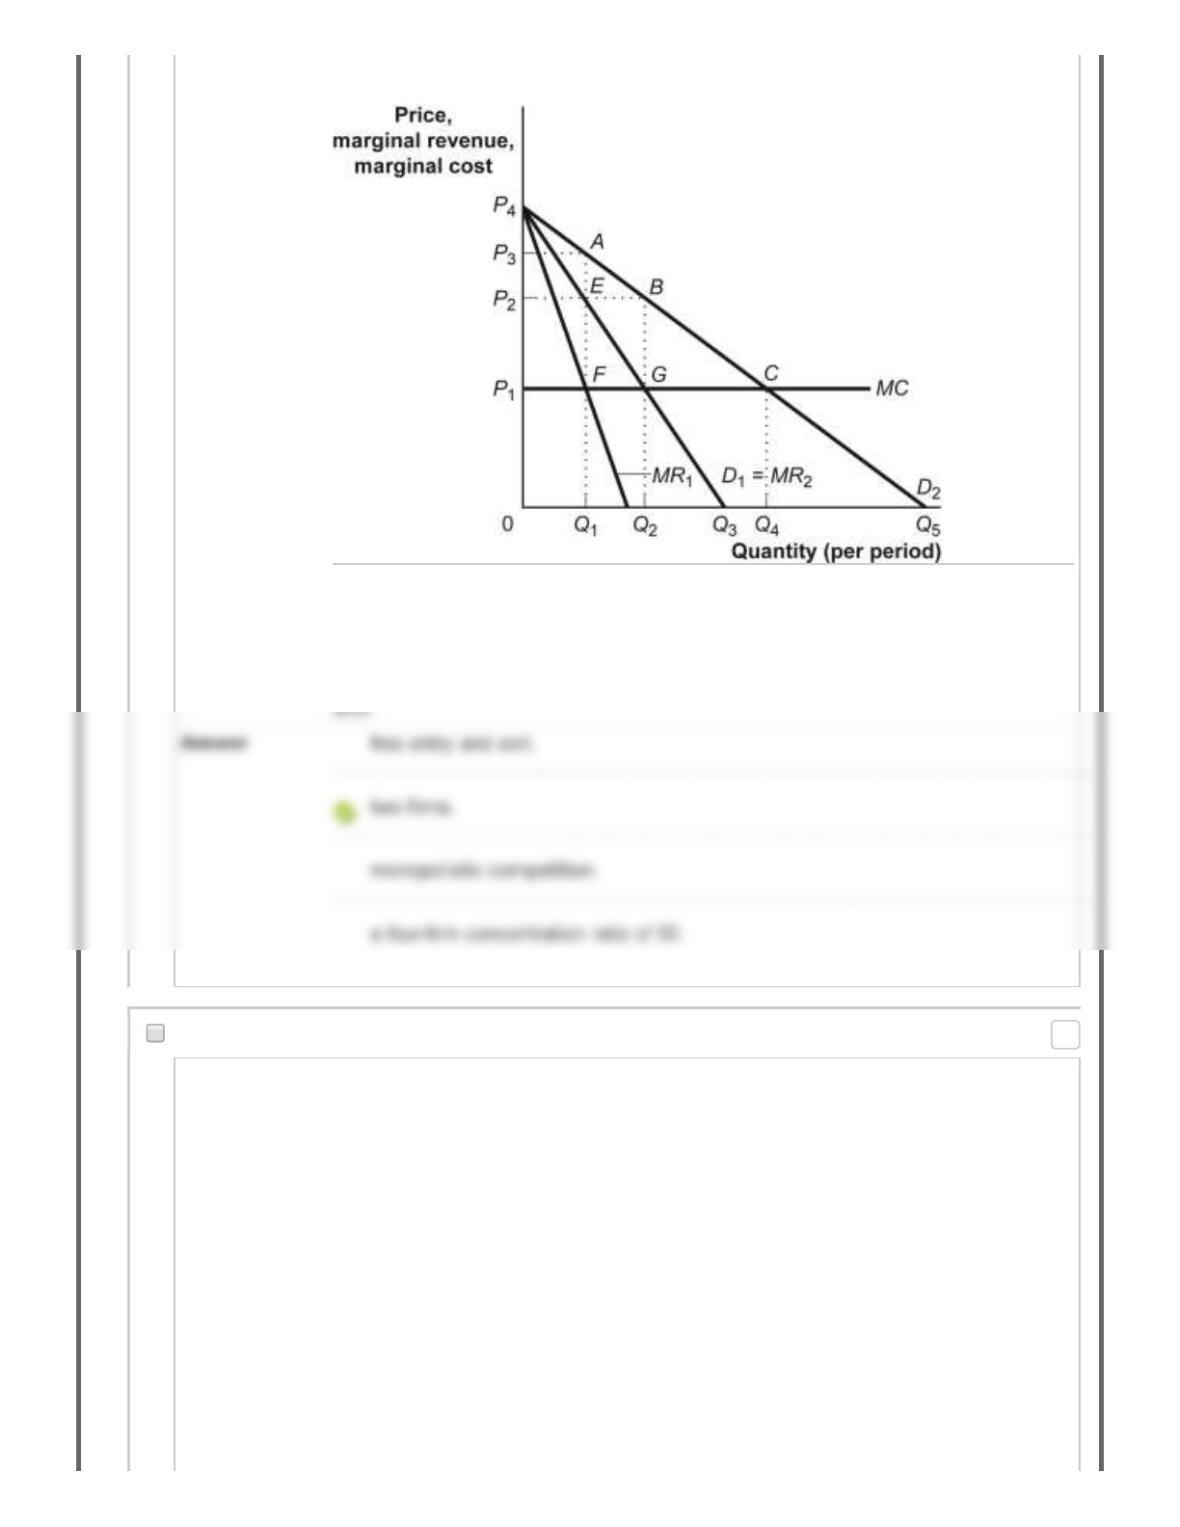
Figure: Monopoly Profits in Duopoly
Reference: Ref 14-2
(Figure: Monopoly Profits in Duopoly) In the figure Monopoly Profits in Duopoly,
each firm faces an identical demand curve, D1, and the market demand curve is
D2. The figure illustrates how firms can reap monopoly profits even in an industry
86. Multiple Choice: Figure: Monopoly Profits in Duopoly R...
Question
Points: 0
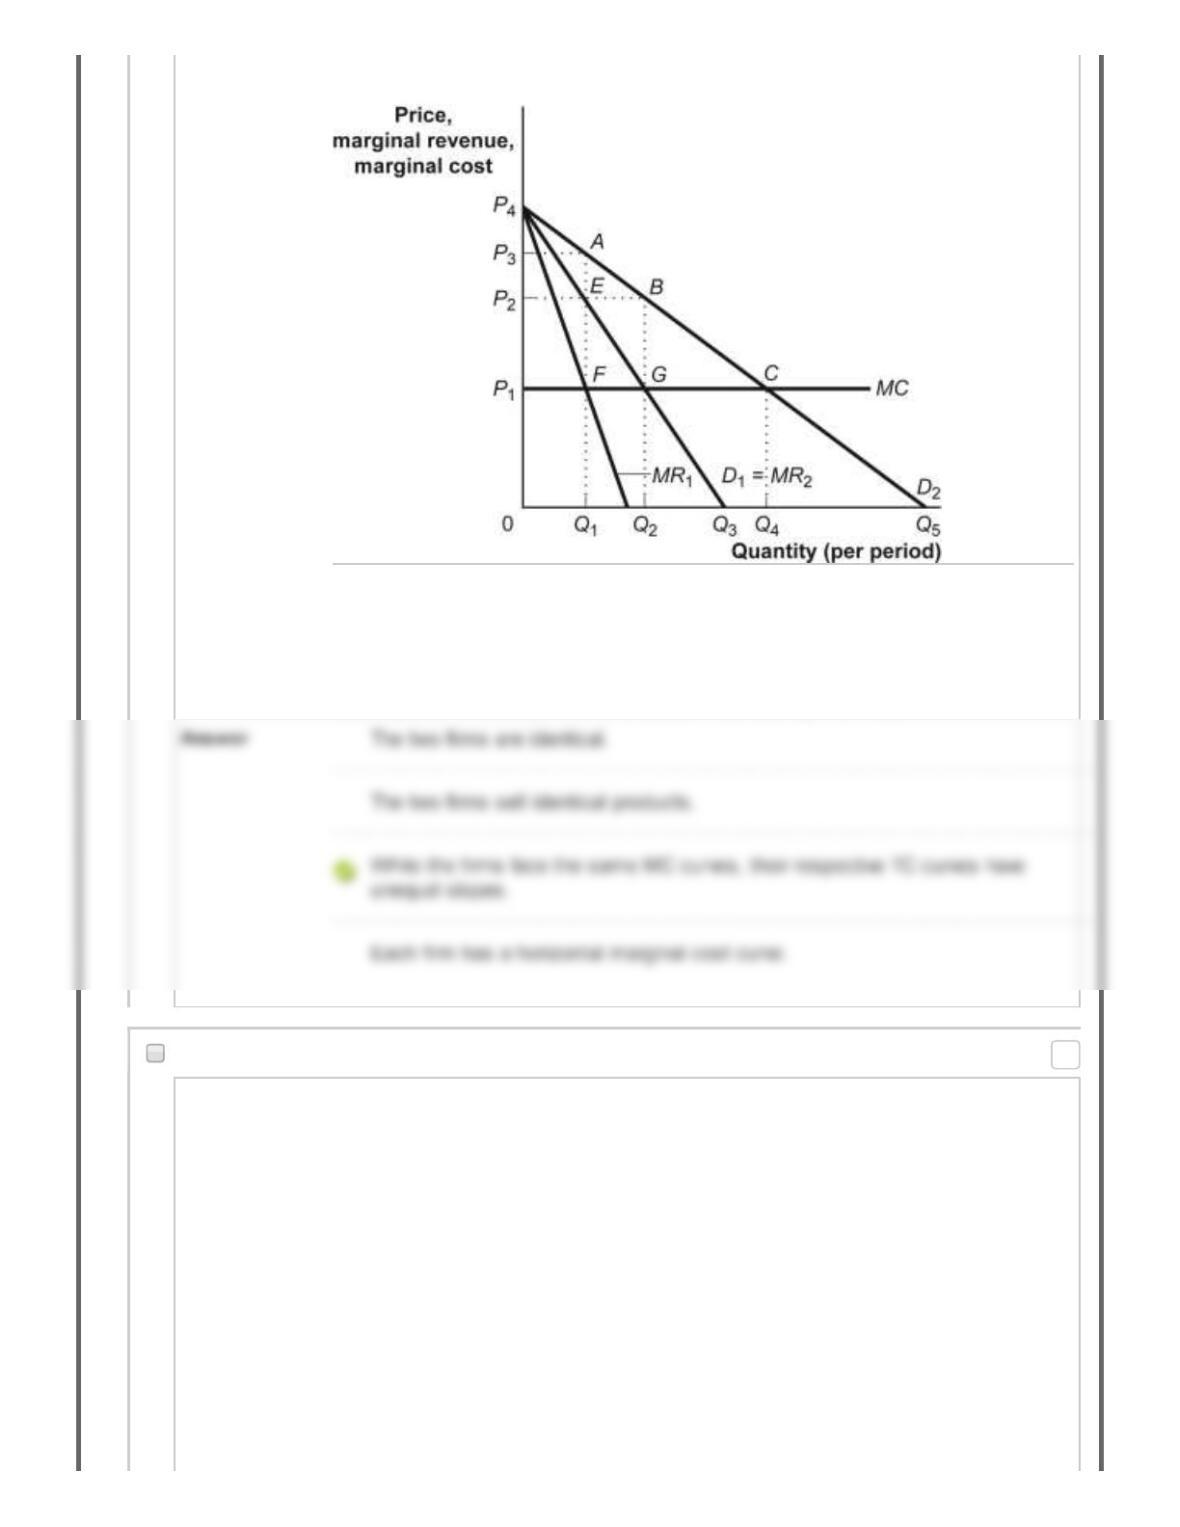
Figure: Monopoly Profits in Duopoly
Reference: Ref 14-2
(Figure: Monopoly Profits in Duopoly) The figure Monopoly Profits in Duopoly
illustrates a situation in which an industry consisting of two firms that face identical
demand curves (D1) can collude to increase profits. Which of the following
assumptions is not a part of the analysis illustrated by the model?
87. Multiple Choice: Figure: Monopoly Profits in Duopoly R...
Question
Points: 0
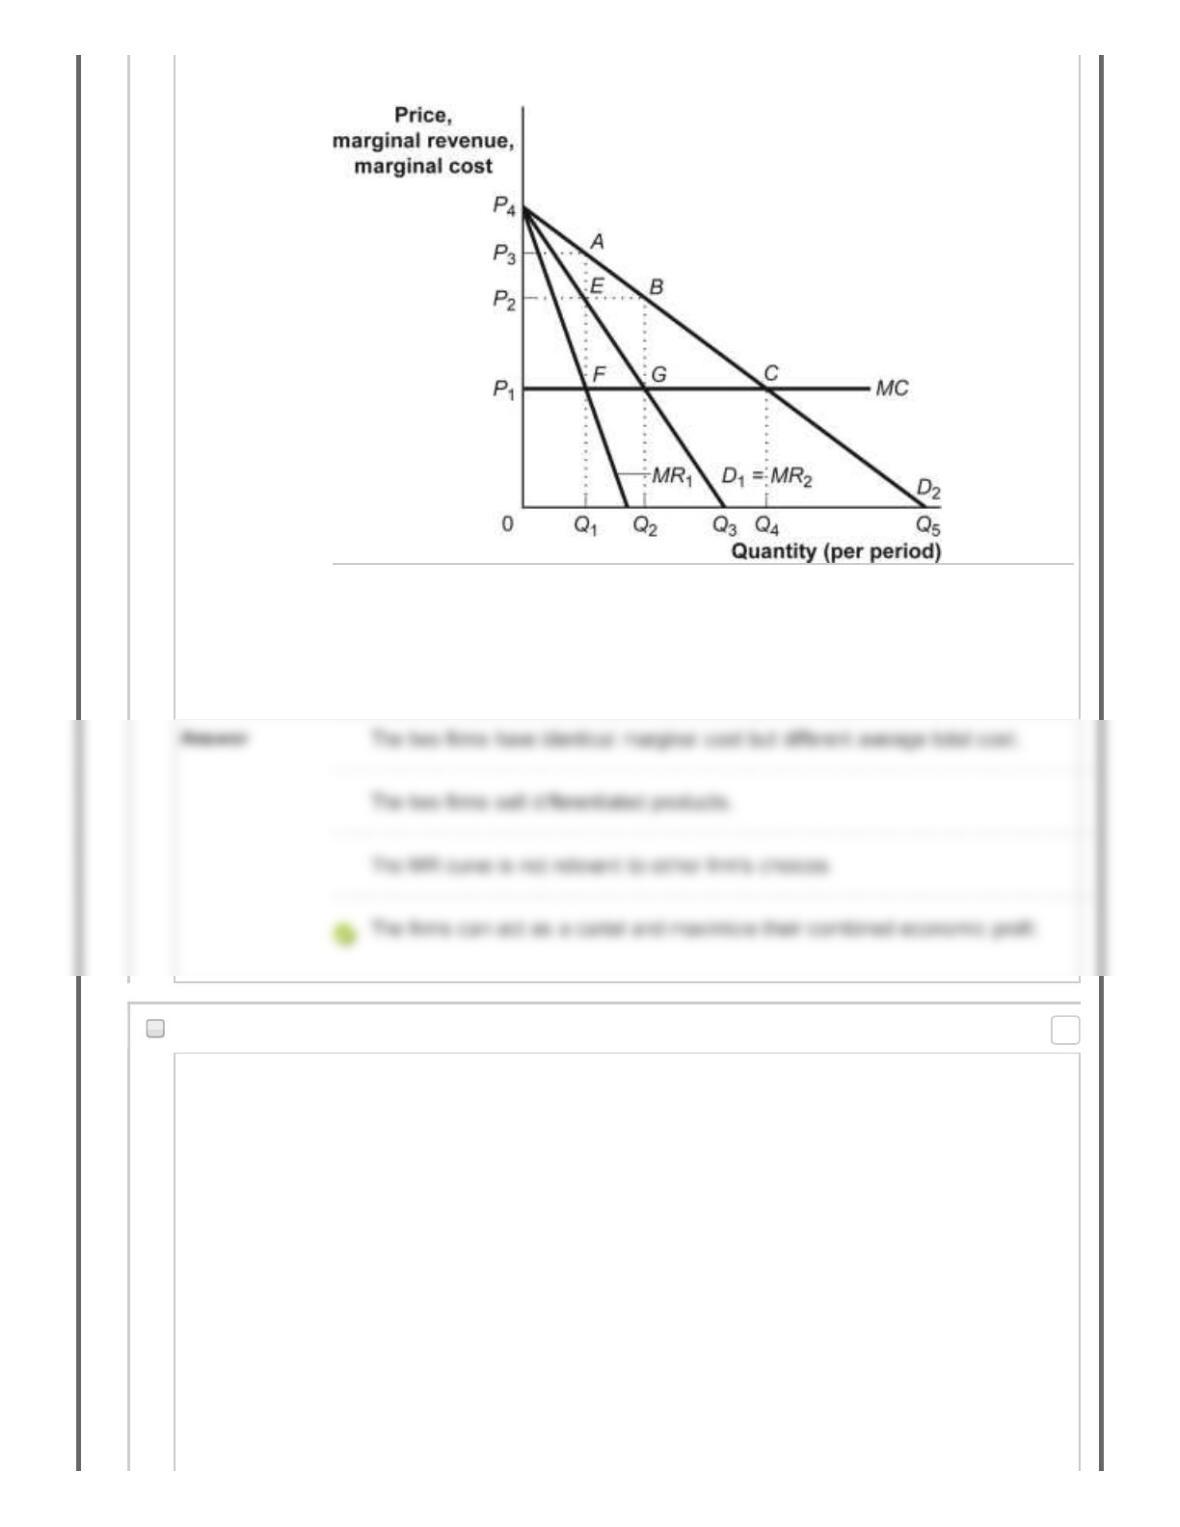
Figure: Monopoly Profits in Duopoly
Reference: Ref 14-2
(Figure: Monopoly Profits in Duopoly) The figure Monopoly Profits in Duopoly
illustrates the situation in which an industry consisting of two firms that face
identical demand curves (D1) can collude to increase profits. Which of the following
assumptions is part of the analysis illustrated by the model?
88. Multiple Choice: Figure: Monopoly Profits in Duopoly R...
Question
Points: 0

Figure: Monopoly Profits in Duopoly
Reference: Ref 14-2
(Figure: Monopoly Profits in Duopoly) The figure Monopoly Profits in Duopoly
illustrates the situation in which an industry consisting of two firms that face
identical demand curves (D1) can collude to increase profits. If the firms collude
and agree to share the market demand equally, then each firm will act as if its
demand curve is given by:
89. Multiple Choice: Figure: Monopoly Profits in Duopoly R...
Question
Points: 0
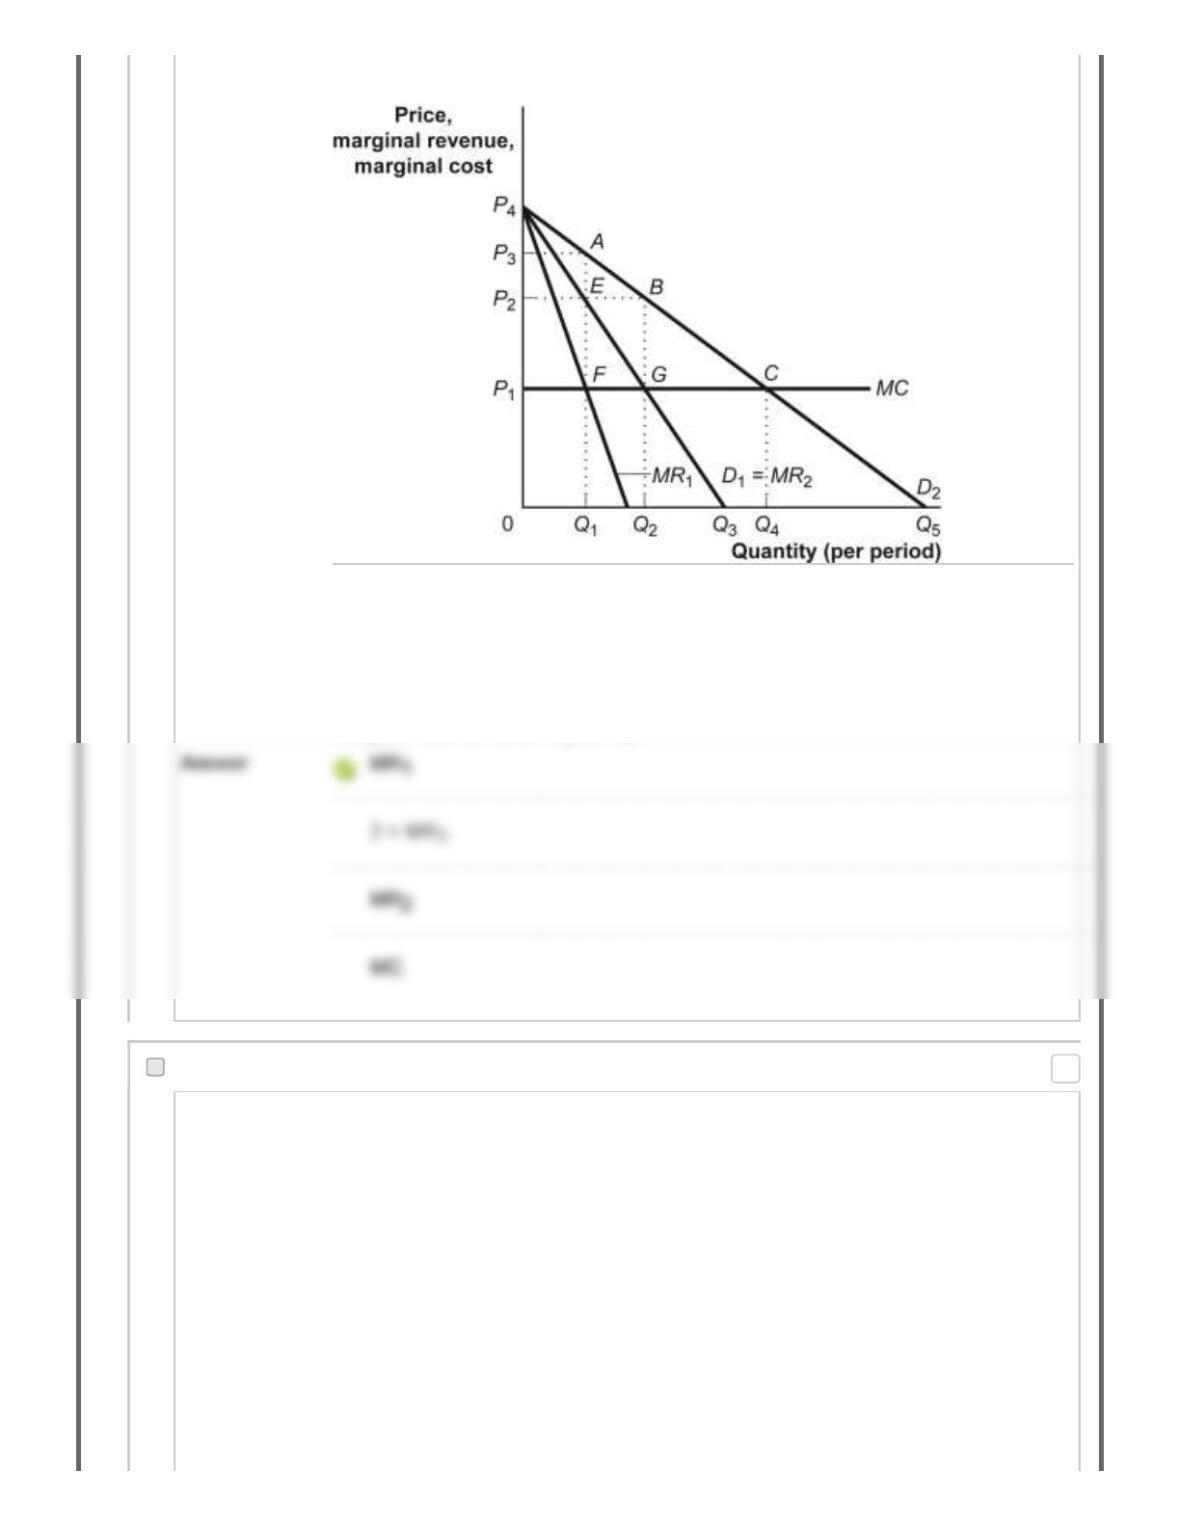
Figure: Monopoly Profits in Duopoly
Reference: Ref 14-2
(Figure: Monopoly Profits in Duopoly) The figure Monopoly Profits in Duopoly
illustrates the situation in which an industry consisting of two firms that face
identical demand curves (D1) can collude to increase profits. If the firms collude
and agree to share the market demand equally, then each firm will act as if its
marginal revenue curve is given by:
90. Multiple Choice: Figure: Monopoly Profits in Duopoly R...
Question
Points: 0

Figure: Monopoly Profits in Duopoly
Reference: Ref 14-2
(Figure: Monopoly Profits in Duopoly) The figure Monopoly Profits in Duopoly
illustrates the situation in which an industry consisting two firms that face identical
demand curves (D1) can collude to increase profits. If the firms collude and agree
to share the market demand equally, then each firm will act as if its demand curve
is given by ________, while the market demand curve is given by ________.
91. Multiple Choice: Figure: Monopoly Profits in Duopoly R...
Question
Points: 0

Figure: Monopoly Profits in Duopoly
Reference: Ref 14-2
(Figure: Monopoly Profits in Duopoly) Given the duopoly industry illustrated in the
figure Monopoly Profits in Duopoly, if each firm acted on the belief that it faced
demand curve D2 and acted without consideration of the other, each firm would
attempt to maximize economic profits by producing quantity ________ and setting
price equal to ________.
92. Multiple Choice: Figure: Monopoly Profits in Duopoly R...
Question
Points: 0
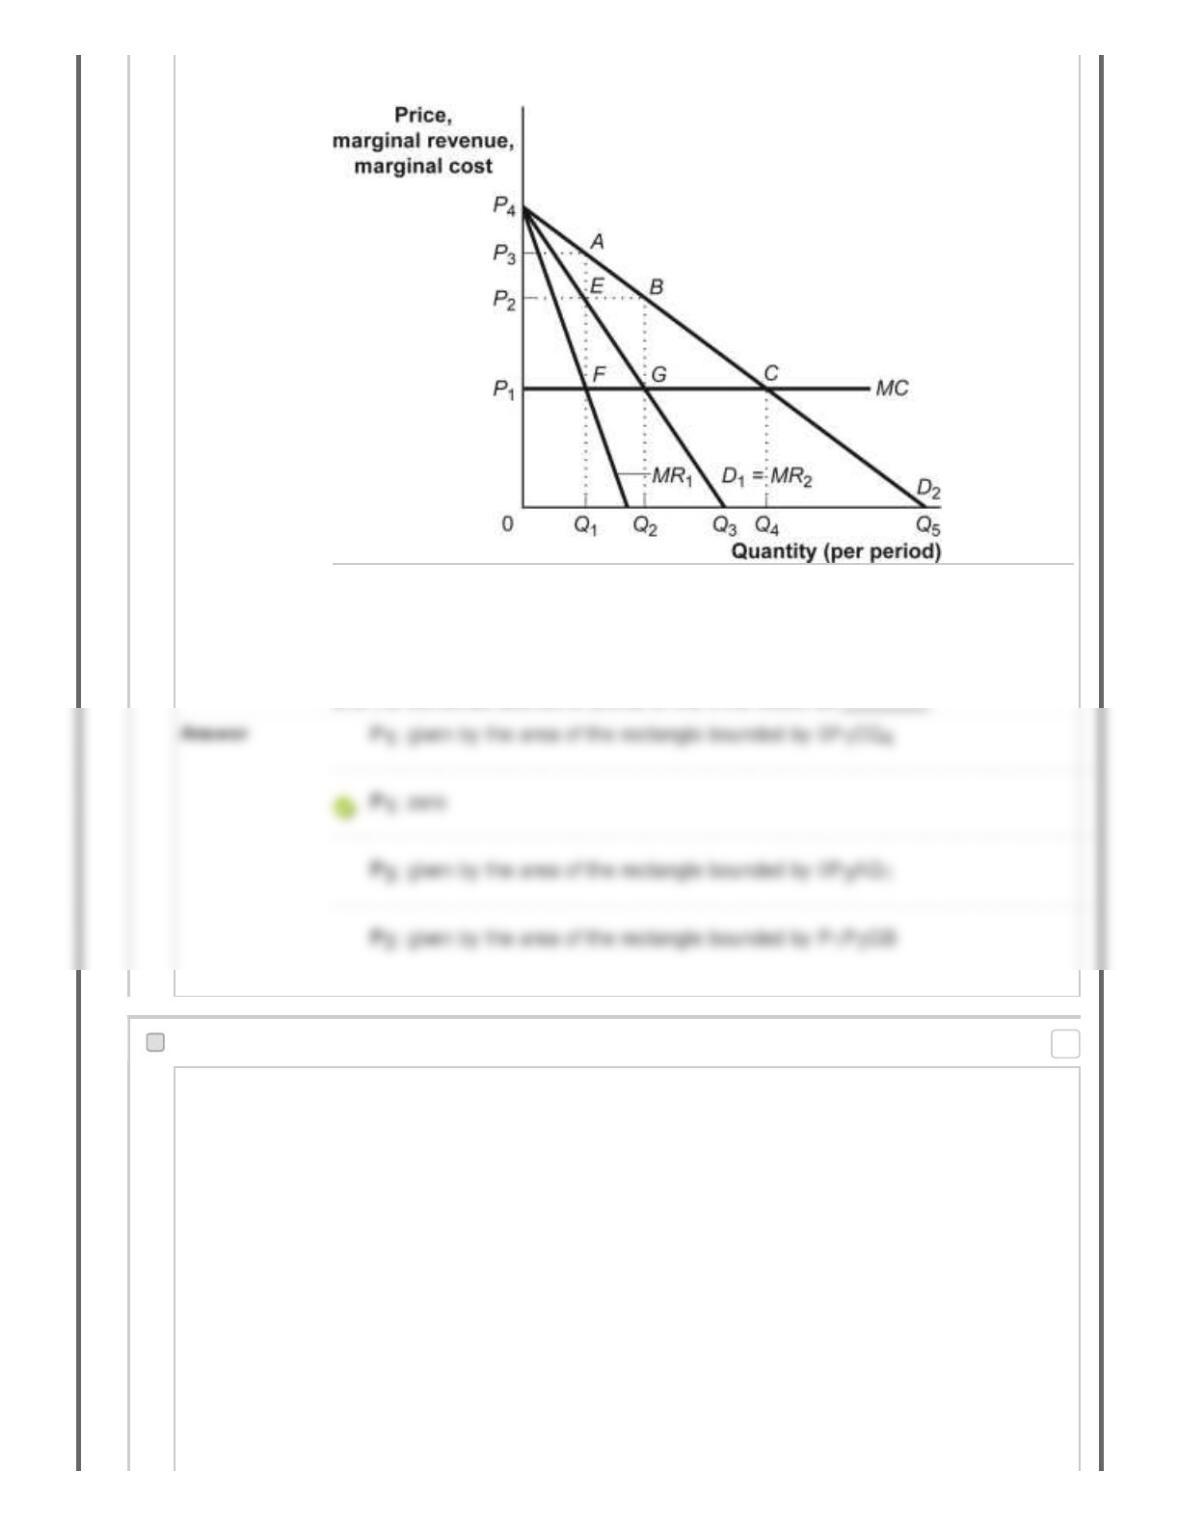
Figure: Monopoly Profits in Duopoly
Reference: Ref 14-2
(Figure: Monopoly Profits in Duopoly) Suppose the duopoly industry illustrated in
the figure Monopoly Profits in Duopoly produces a perishable good. If the industry
were perfectly competitive, the market price would likely end up being ________,
and the combined economic profits of the firms would be ________.
93. Multiple Choice: Figure: Monopoly Profits in Duopoly R...
Question
Points: 0
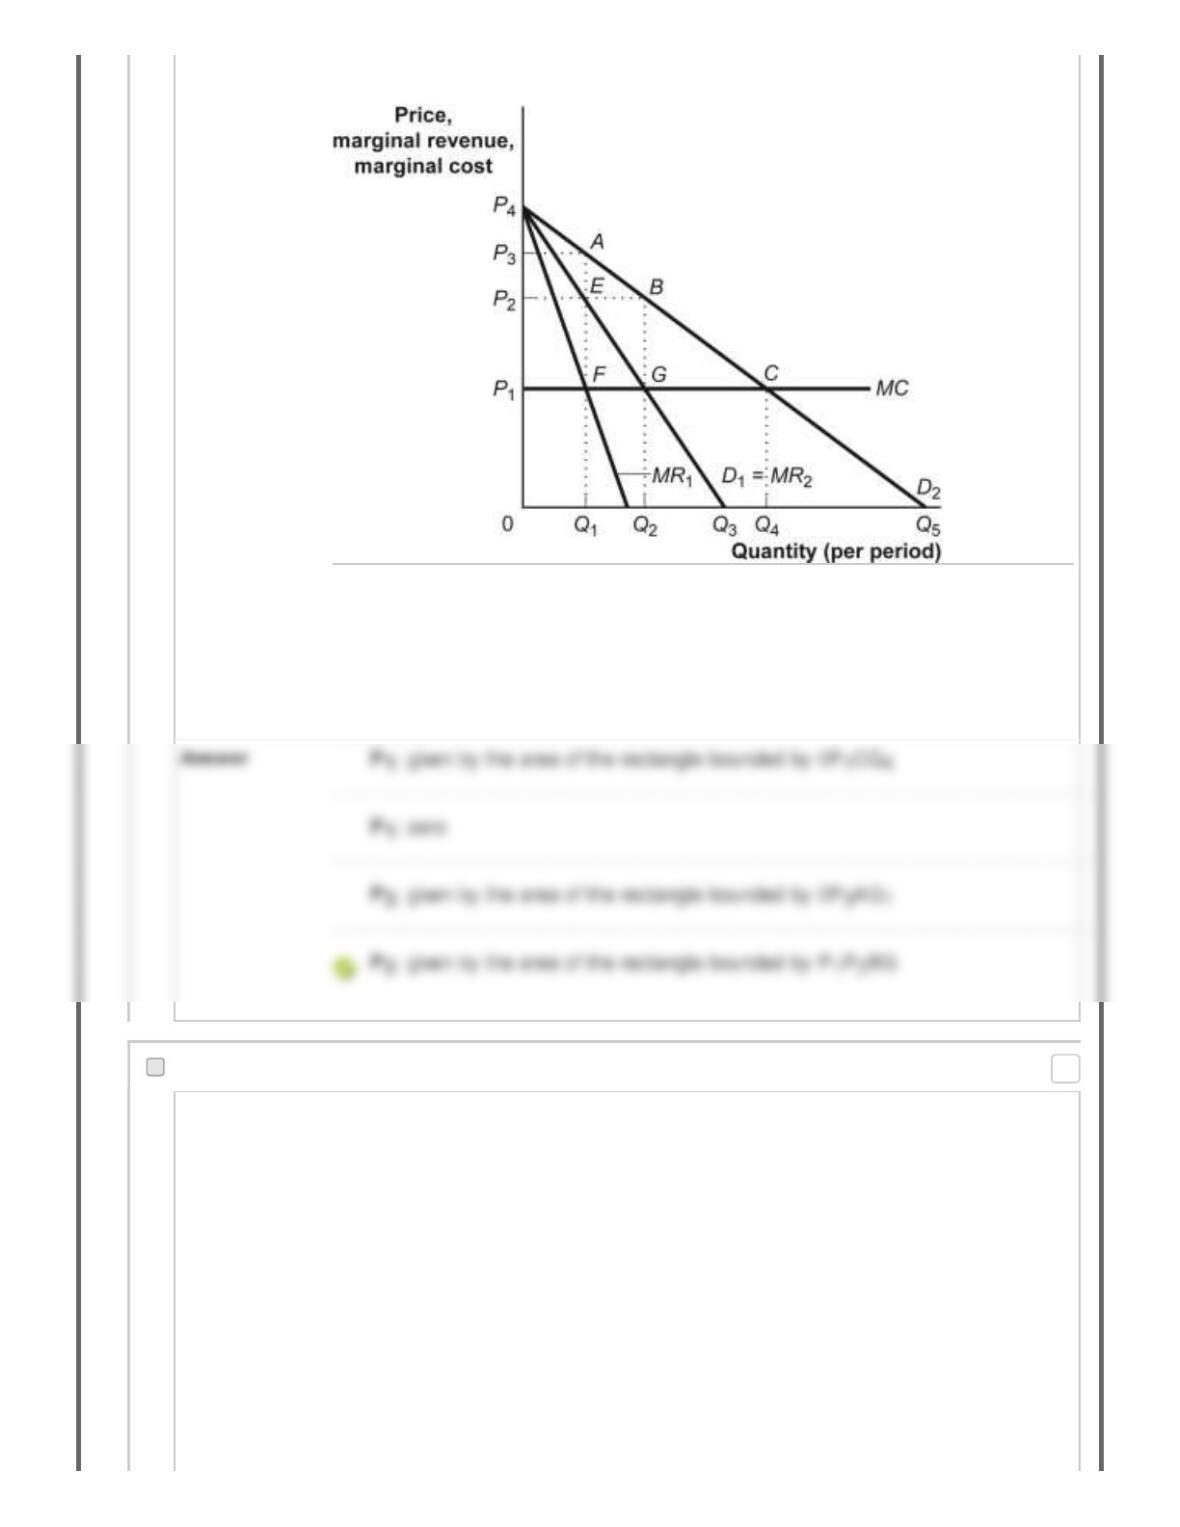
Figure: Monopoly Profits in Duopoly
Reference: Ref 14-2
(Figure: Monopoly Profits in Oligopoly) Firms in the duopoly industry illustrated in
the figure Monopoly Profits in Duopoly have zero fixed costs. If the two firms
colluded to maximize their combined economic profits, the market price they would
set would be ________, and combined economic profits of the firms would be
________.
94. Multiple Choice: Figure: Monopoly Profits in Duopoly R...
Question
Points: 0
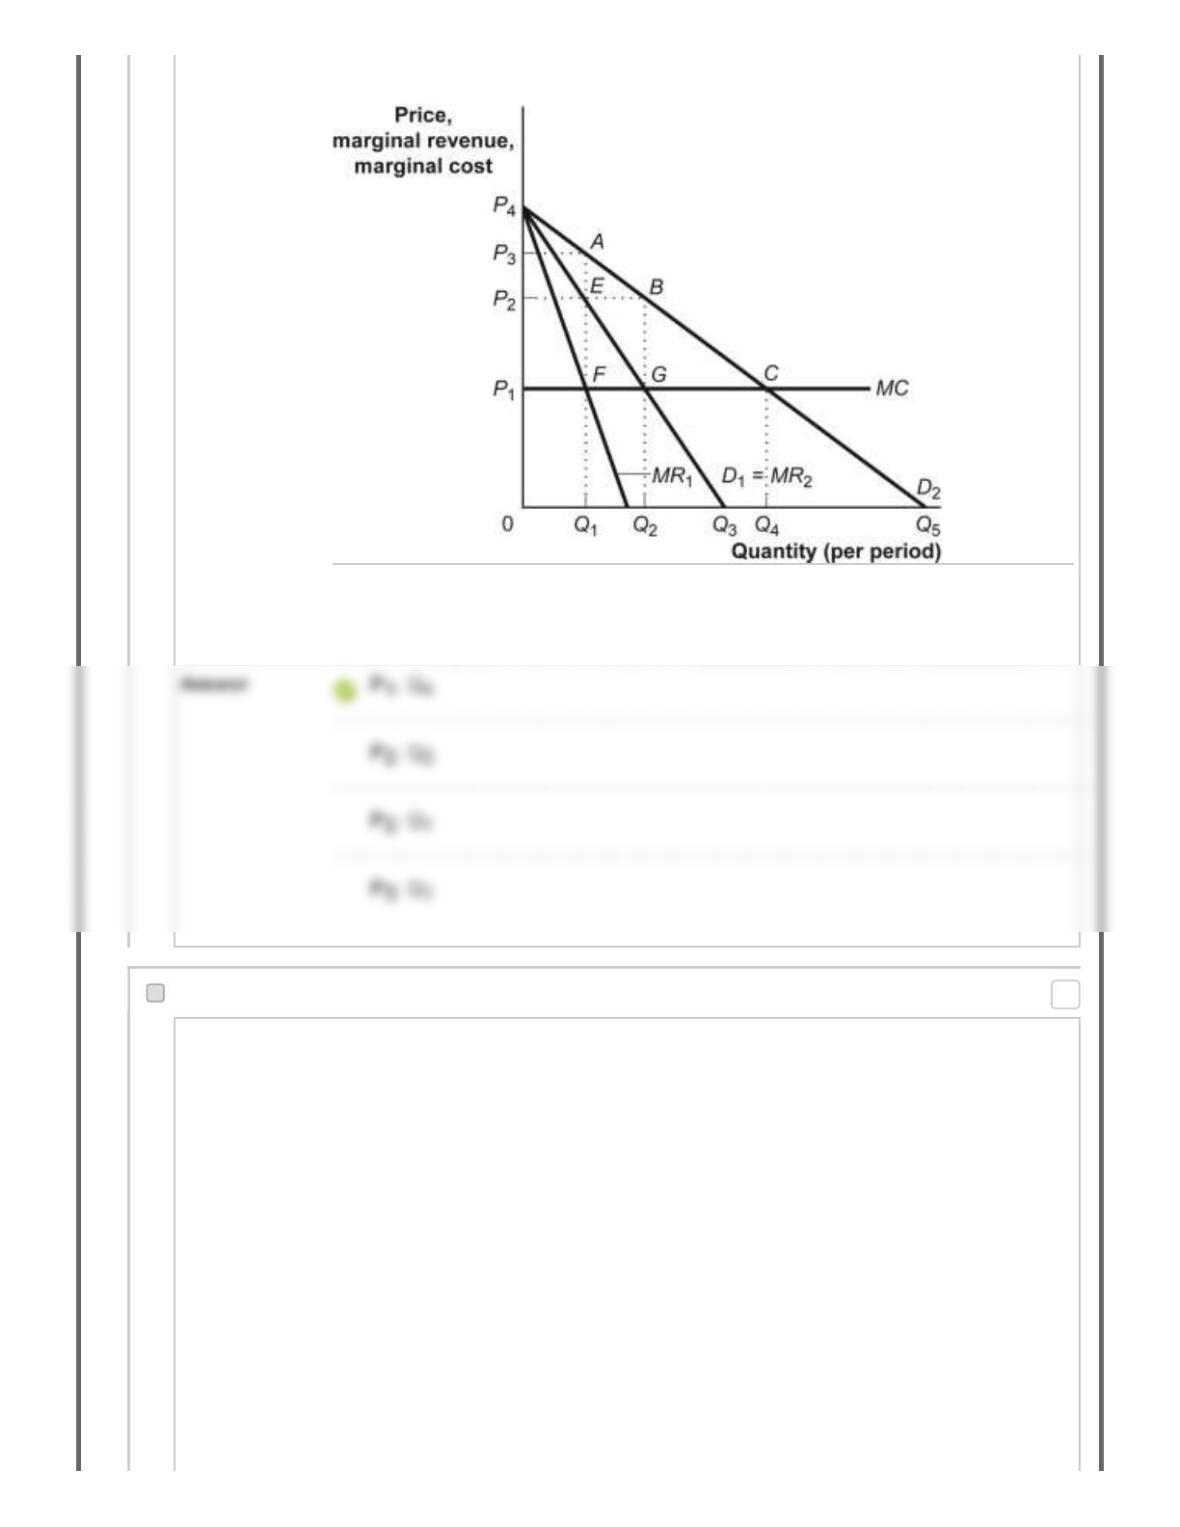
Figure: Monopoly Profits in Duopoly
Reference: Ref 14-2
(Figure: Monopoly Profits in Duopoly) The efficient solution in the figure Monopoly
Profits in Duopoly is found where price is ________ and quantity is ________.
95. Multiple Choice: Figure: Monopoly Profits in Duopoly R...
Question
Points: 0
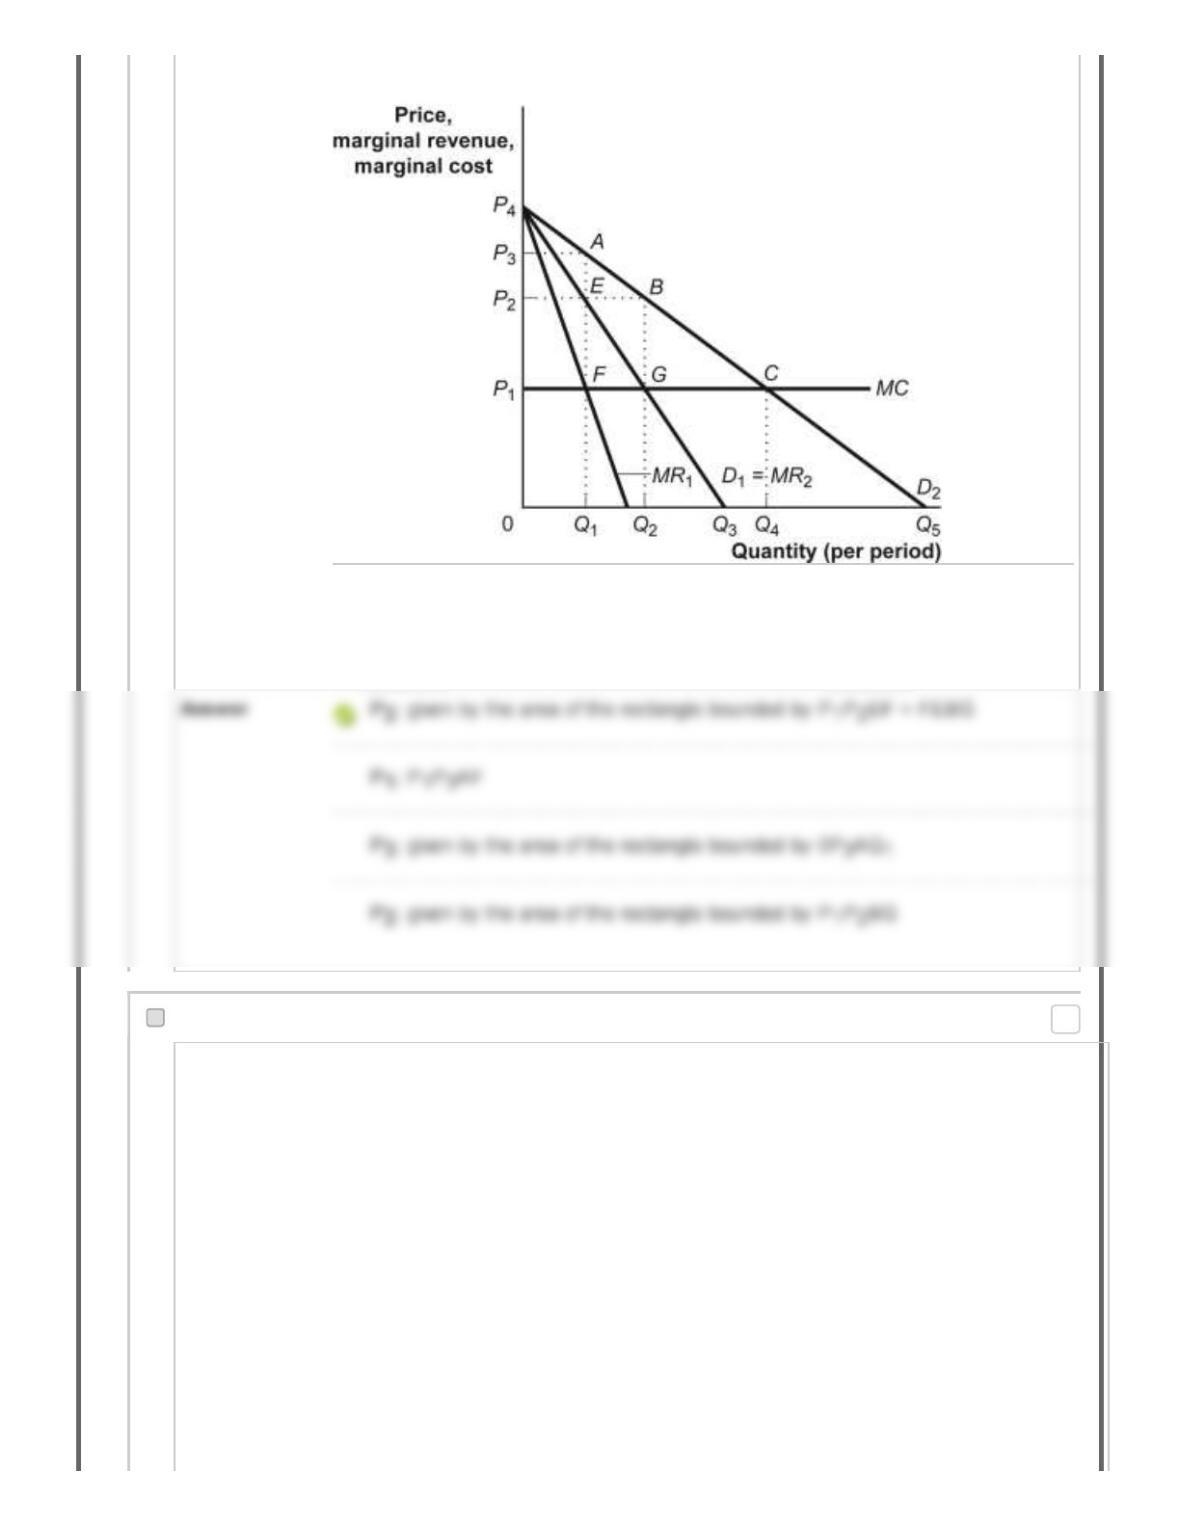
Figure: Monopoly Profits in Duopoly
Reference: Ref 14-2
(Figure: Monopoly Profits in Duopoly) If the two firms in the figure Monopoly Profits
in Duopoly colluded to maximize their joint profits, the market price they set would
be ________, and each firm’s economic profit would be ________.
96. Multiple Choice: Figure: Collusion Reference: Ref 14–3...
Question
Points: 0
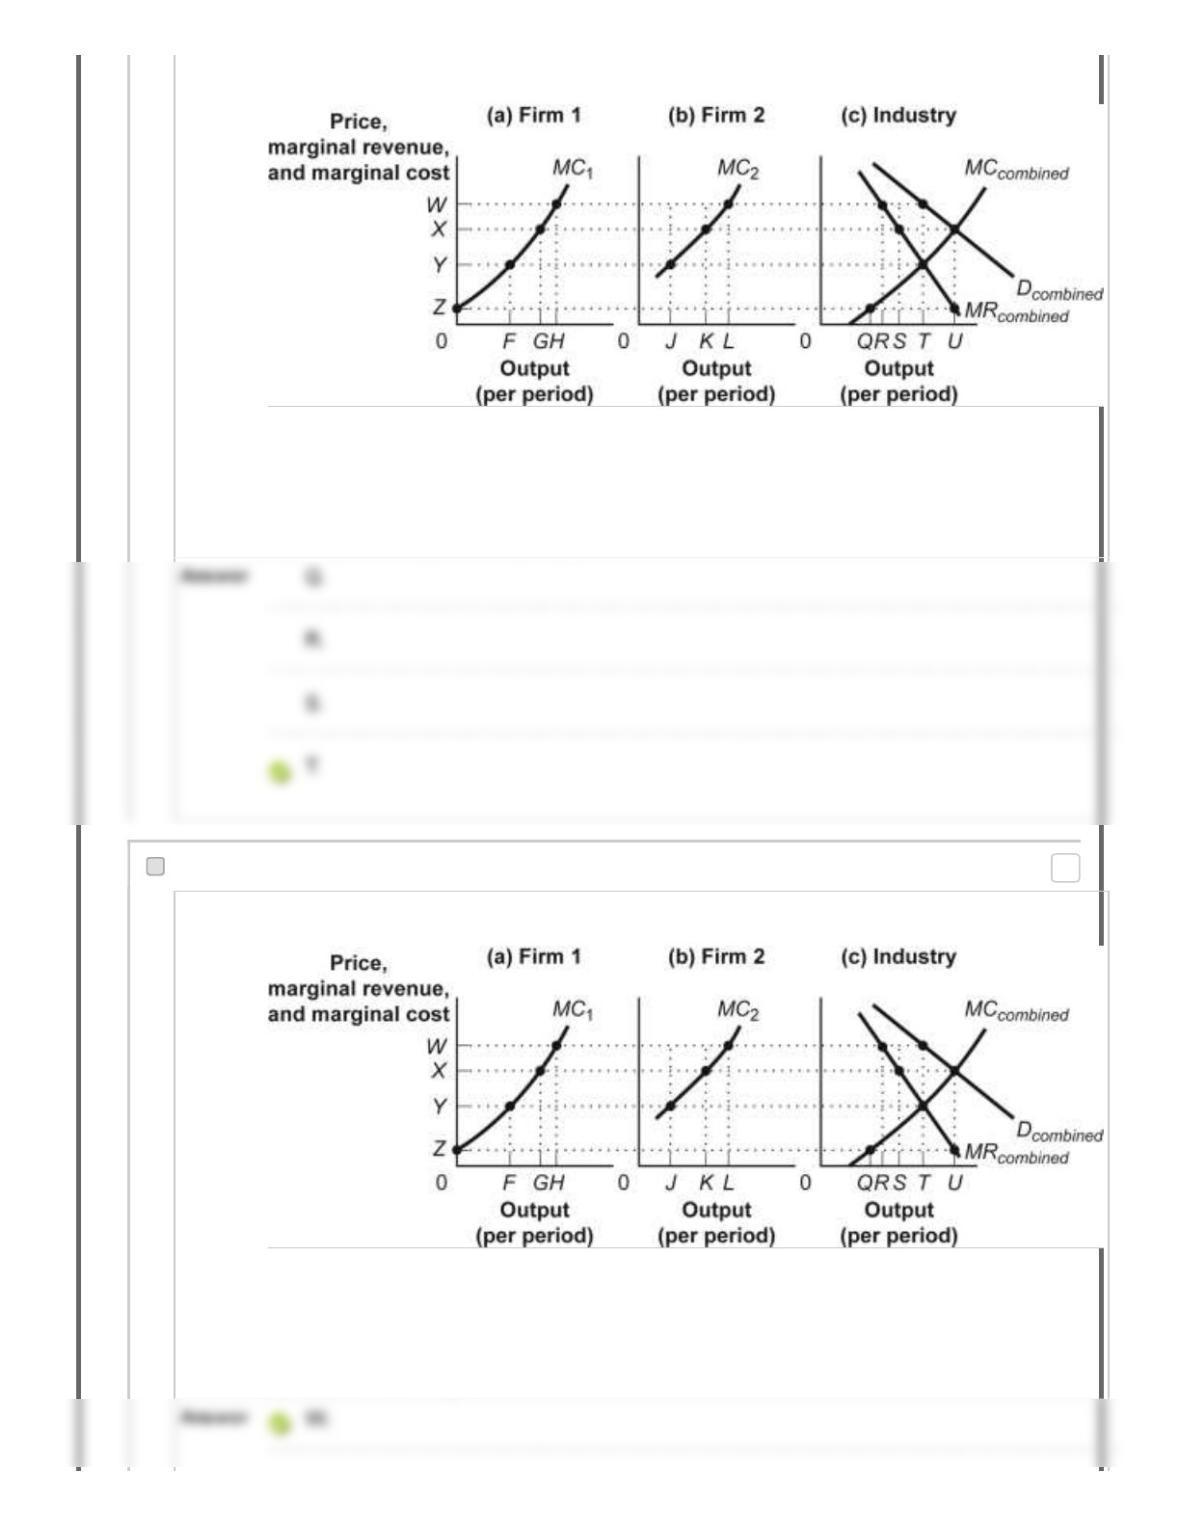
Figure: Collusion
Reference: Ref 14-3
(Figure: Collusion) In the figure Collusion, panel (c) gives the combined marginal revenue,
demand, and marginal cost curves for an industry containing several firms. Panels (a) and (b)
give marginal cost curves for two of those firms. The quantity of output produced by the
industry with collusion is shown by:
97. Multiple Choice: Figure: Collusion Reference: Ref 14–3...
Question Figure: Collusion
Reference: Ref 14-3
(Figure: Collusion) In the figure Collusion, panel (c) gives the combined marginal revenue,
demand, and marginal cost curves for an industry containing several firms. Panels (a) and (b)
give marginal cost curves for two of those firms. The price charged by the industry with
collusion is shown by:
Points: 0
98. Multiple Choice: Figure: Collusion Reference: Ref 14–3...
Question Figure: Collusion
Reference: Ref 14-3
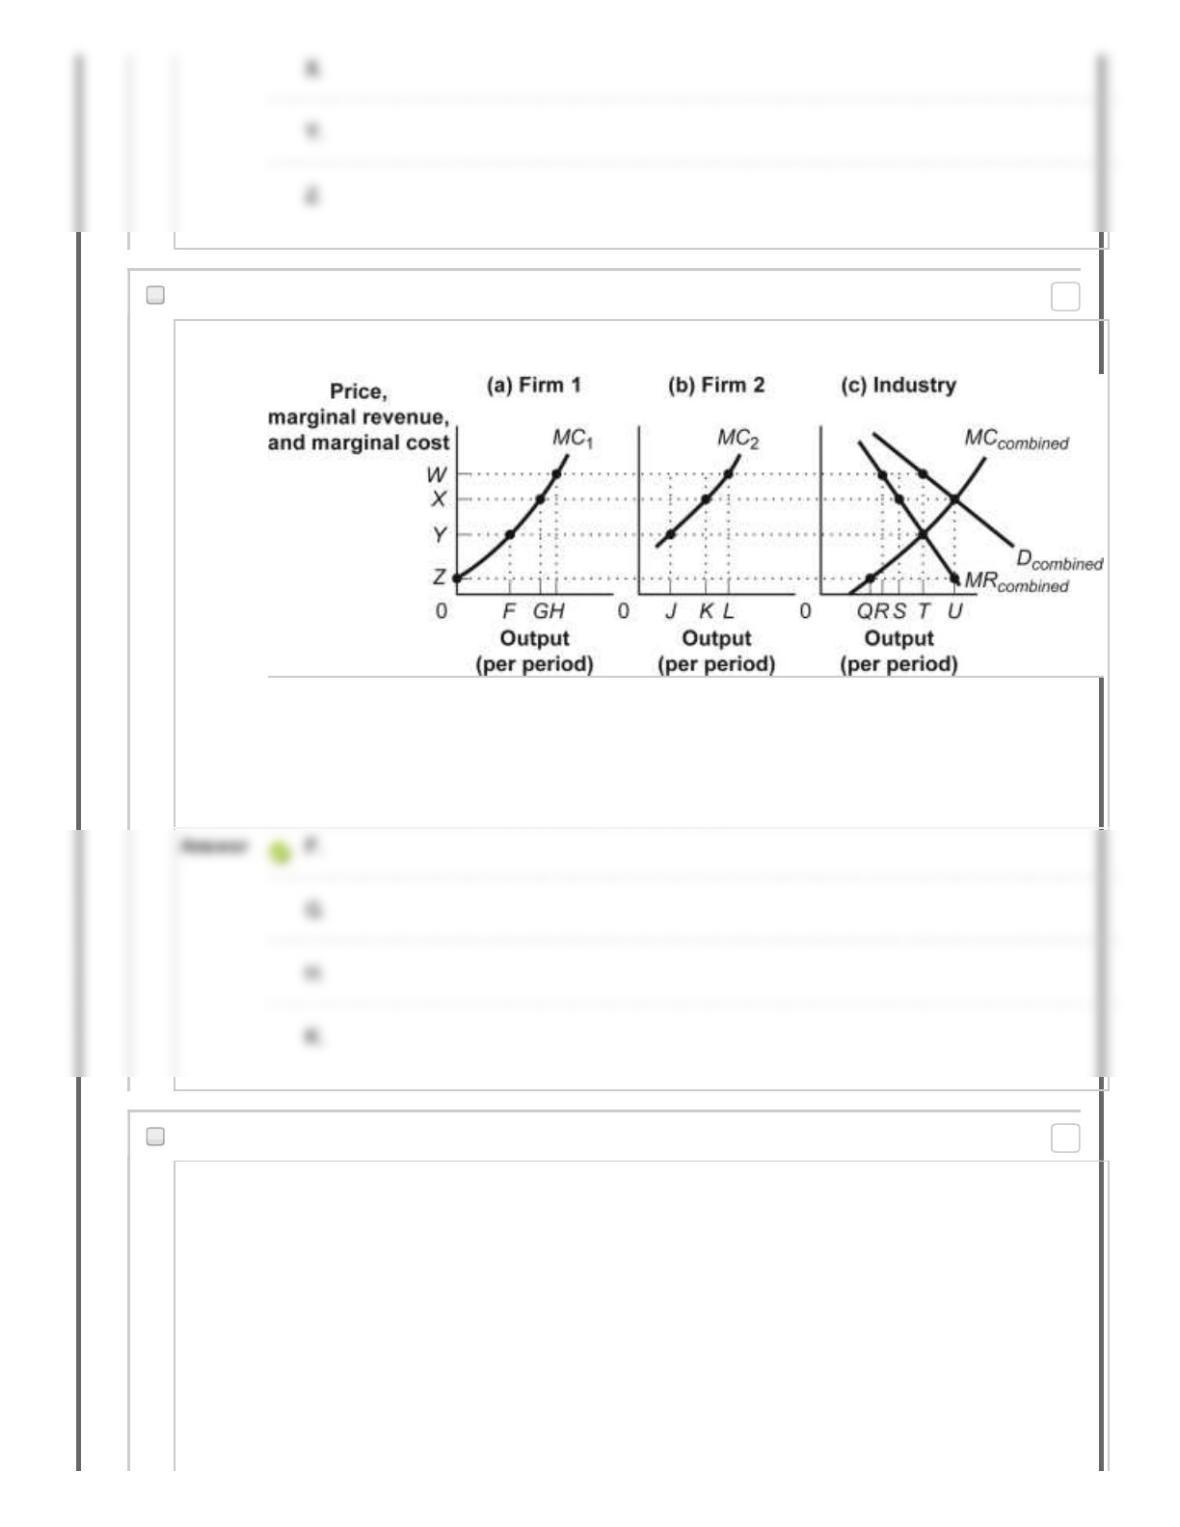
(Figure: Collusion) In the figure Collusion, panel (c) gives the combined marginal revenue,
demand, and marginal cost curves for an industry containing several firms. Panels (a) and (b)
give marginal cost curves for two of those firms. The quantity of output produced by firm 1
when there is collusion in the industry is shown by:
99. Multiple Choice: Figure: Collusion Reference: Ref 14–3...
Question
Points: 0
Points: 0
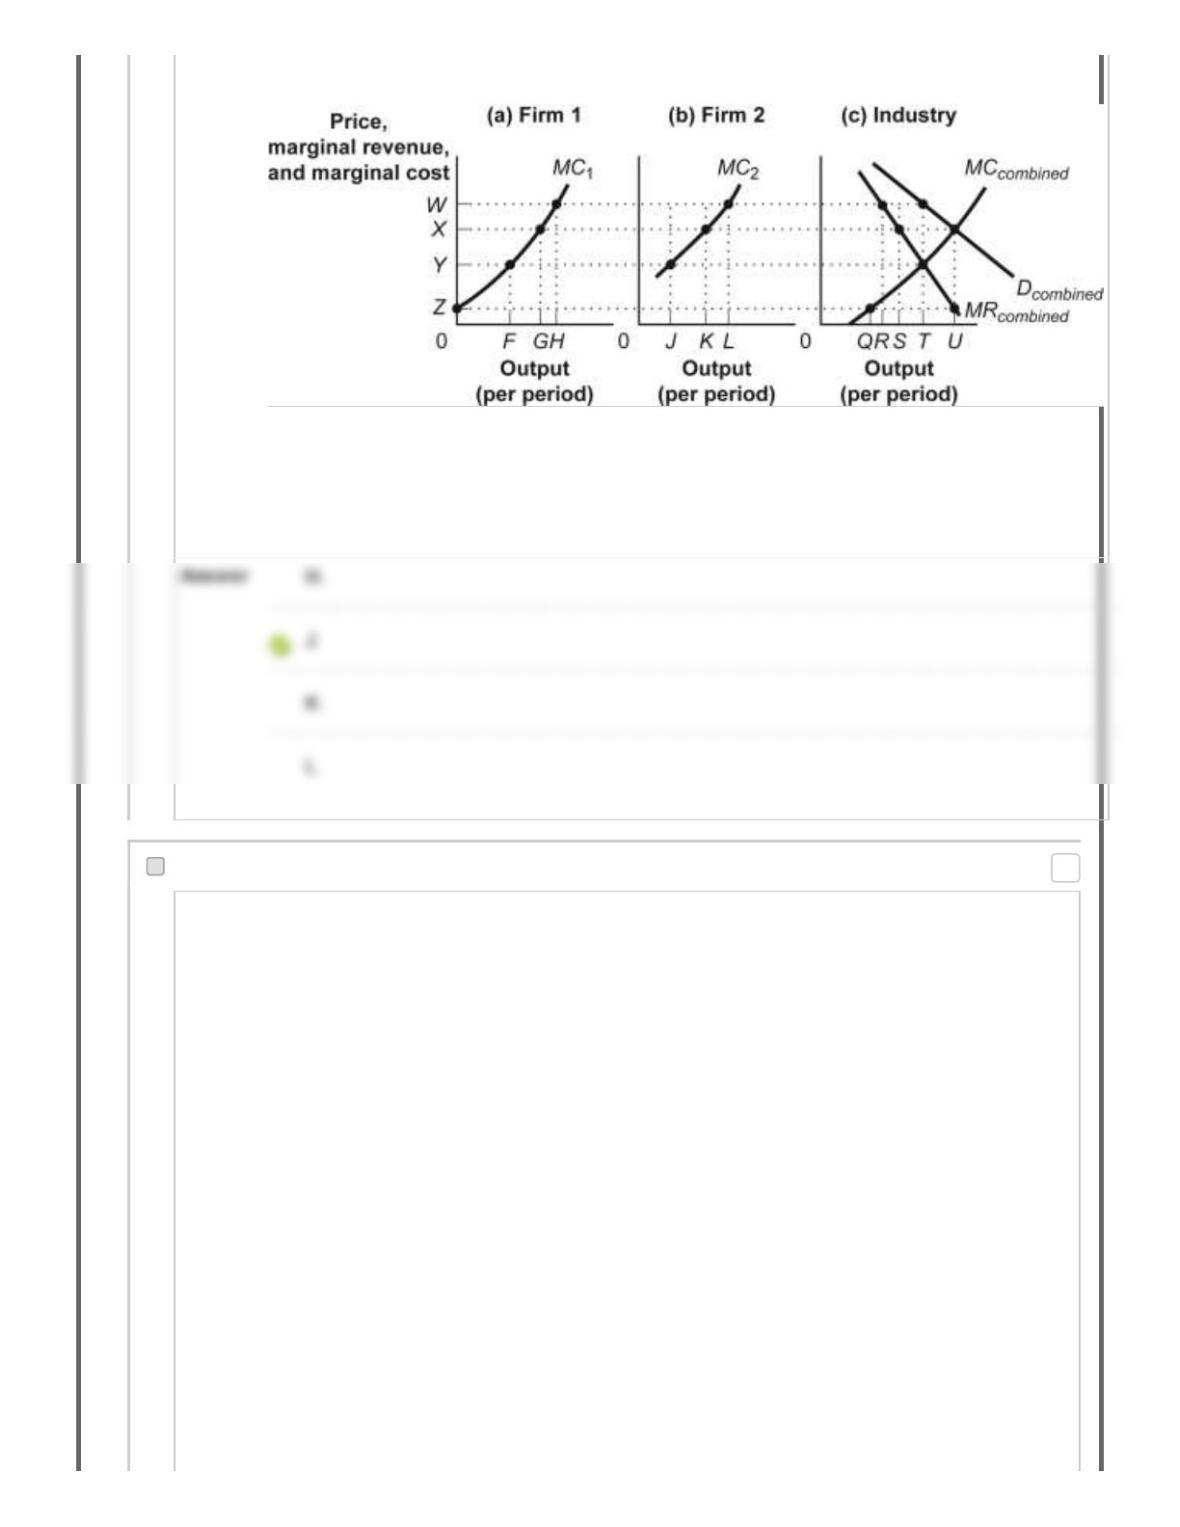
Figure: Collusion
Reference: Ref 14-3
(Figure: Collusion) In the figure Collusion, panel (c) gives the combined marginal revenue,
demand, and marginal cost curves for an industry containing several firms. Panels (a) and (b)
give marginal cost curves for two of those firms. The quantity of output produced by firm 2
when there is collusion in the industry is shown by:
100. Multiple Choice: Reference: Ref 14-4 (Table: Demand f...
Question
Points: 0
Reference: Ref 14-4
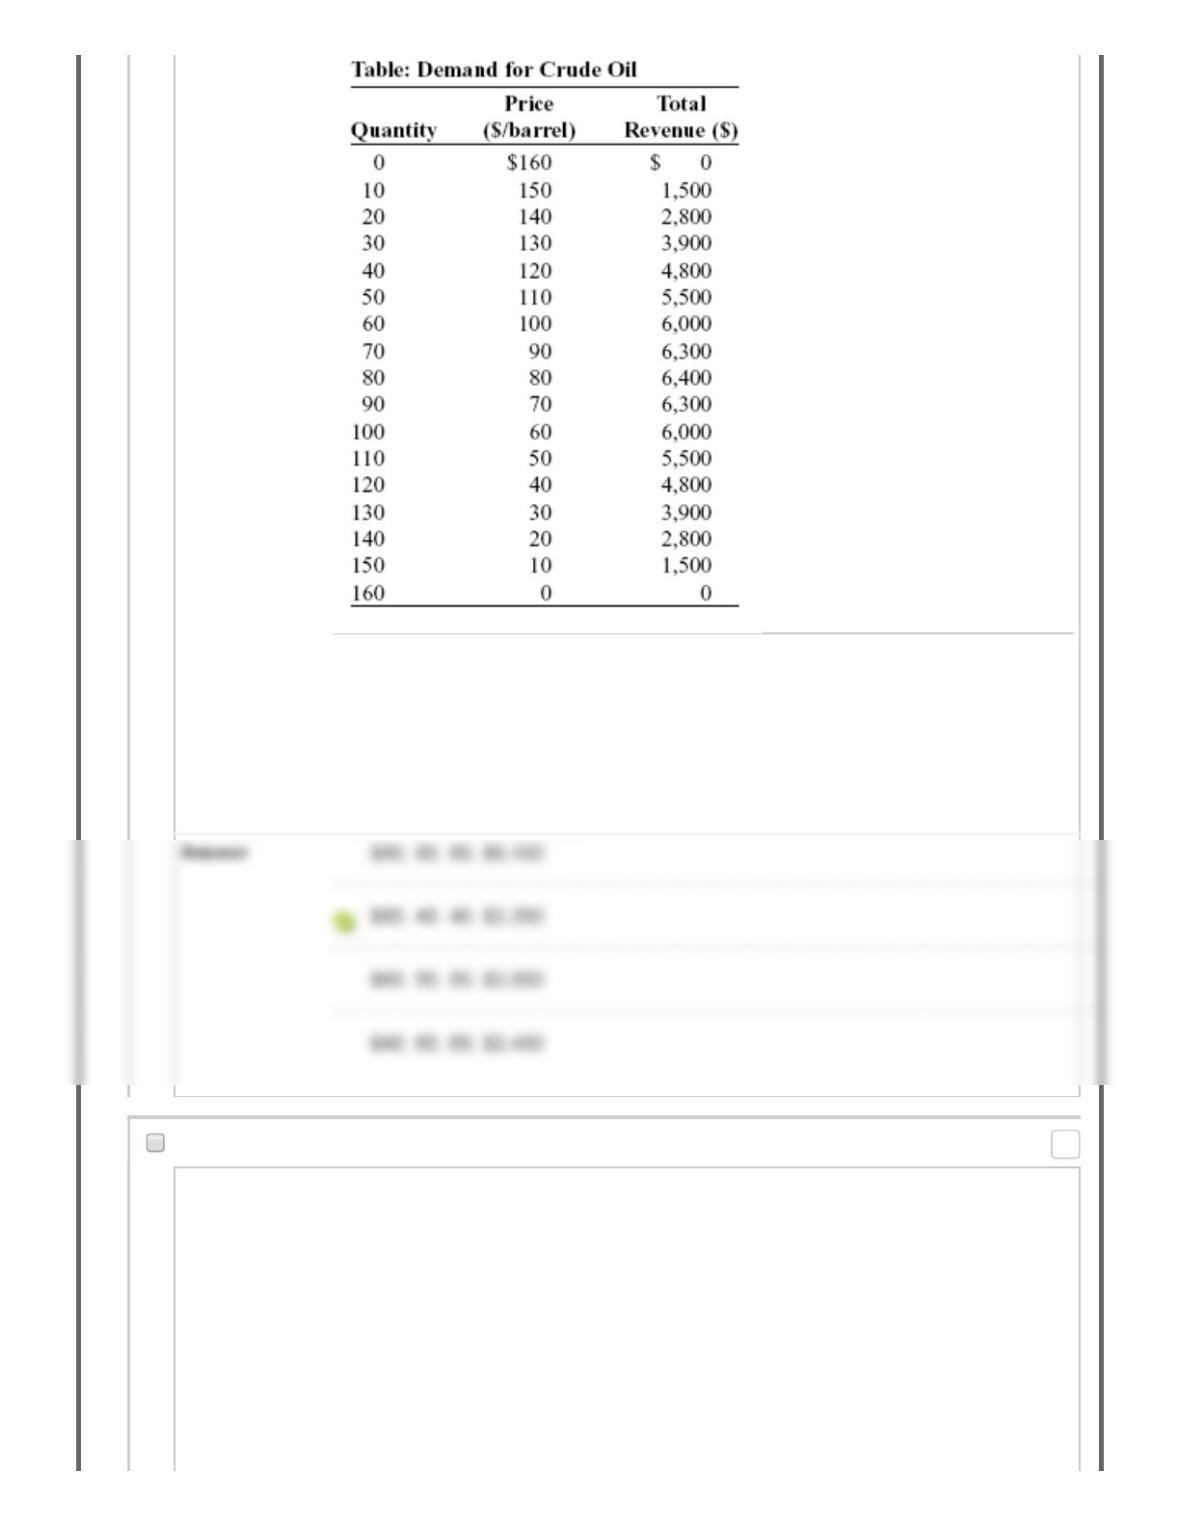
(Table: Demand for Crude Oil) The table Demand for Crude Oil shows the demand
schedule for crude oil. Assume that the crude oil industry is a duopoly and the
marginal cost of producing crude oil equals zero. If the two firms collude to share
the market equally, the price of crude oil will be ________, firm 1 will produce
________ barrels, firm 2 will produce ________barrels, and each firm will earn
revenue equal to ________.
101. Multiple Choice: Reference: Ref 14-4 (Table: Demand f...
Question
Points: 0
Reference: Ref 14-4
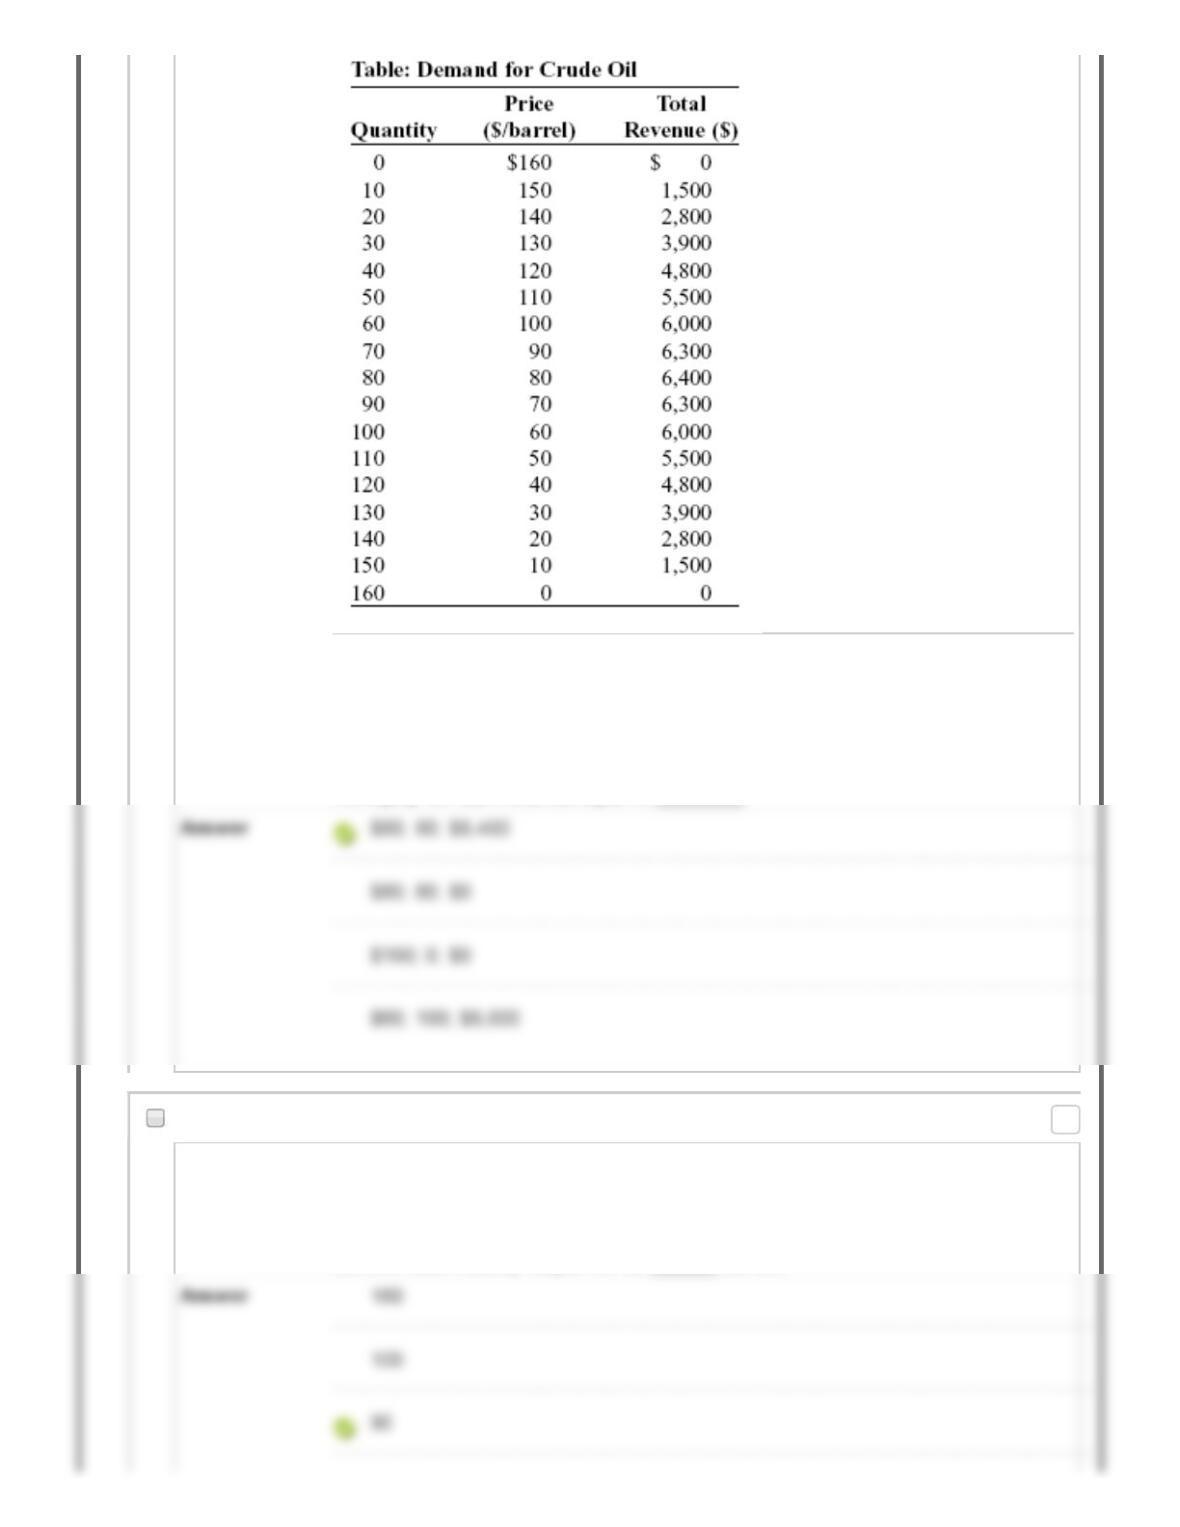
(Table: Demand for Crude Oil) The table Demand for Crude Oil shows the demand
schedule for crude oil. The marginal cost of producing crude oil equals zero. If the
crude oil industry is a monopoly, the price of crude oil will be ________, the total
quantity of crude oil produced by the monopoly will be ________ barrels, and the
monopoly will earn revenue equal to ________.
102. Multiple Choice: (Table: Demand for Crude Oil) Look a…
Question (Table: Demand for Crude Oil) Look at the table Demand for Crude Oil. Assume
that the crude oil industry is a duopoly and the marginal cost of producing crude oil
equals zero. Suppose that the two firms are maximizing industry profit and splitting
the profit evenly. If firm 1 decides to cheat and increase production by 10 more
barrels, total industry output will be ______ barrels.
Points: 0

103. Multiple Choice: (Table: Demand for Crude Oil) Look a…
Question (Table: Demand for Crude Oil) Look at the table Demand for Crude Oil. Assume
that the crude oil industry is a duopoly and the marginal cost of producing crude oil
equals zero. Suppose that the two firms are maximizing industry profit and splitting
the profit evenly. If firm 1 decides to cheat and increase production by 10 more
barrels, the price of crude oil will be:
104. Multiple Choice: (Table: Demand for Crude Oil) Look a…
Question (Table: Demand for Crude Oil) Look at the table Demand for Crude Oil. Assume
that the crude oil industry is a duopoly and the marginal cost of producing crude oil
equals zero. Suppose that the two firms are maximizing industry profit and splitting
the profit evenly. If firm 1 decides to cheat and increase production by 10 more
barrels, firm 1 will earn profits of:
105. Multiple Choice: (Table: Demand for Crude Oil) Look a…
Question (Table: Demand for Crude Oil) Look at the table Demand for Crude Oil. Assume
that the crude oil industry is a duopoly and the marginal cost of producing crude oil
equals zero. Suppose that the two firms are maximizing industry profit and splitting
the profit evenly. If firm 1 decides to cheat and increase production by 10 more
barrels and firm 2 continues to produce 40 barrels, firm 2 will earn profits of:
Points: 0
Points: 0
Points: 0

106. Multiple Choice: (Table: Demand for Crude Oil) Look a…
Question (Table: Demand for Crude Oil) Look at the table Demand for Crude Oil. Assume
that the crude oil industry is a duopoly and the marginal cost of producing crude oil
equals zero. Suppose that the two firms are maximizing industry profit and splitting
the profit evenly. If both firms decide to cheat and produce 10 more barrels each,
industry output will be ______ barrels.
107. Multiple Choice: (Table: Demand for Crude Oil) Look a…
Question (Table: Demand for Crude Oil) Look at the table Demand for Crude Oil. Assume
that the crude oil industry is a duopoly and the marginal cost of producing crude oil
equals zero. Suppose that the two firms are maximizing industry profit and splitting
the profit evenly. If both firms decide to cheat and produce 10 more barrels each,
the price of crude oil will be:
108. Multiple Choice: (Table: Demand for Crude Oil) Look a…
Question (Table: Demand for Crude Oil) Look at the table Demand for Crude Oil. Assume
that the crude oil industry is a duopoly and the marginal cost of producing crude oil
equals zero. Suppose that the two firms are maximizing industry profit and splitting
the profit evenly. If both firms decide to cheat and produce 10 more barrels each,
firm 1′s profit will be _____, and firm 2′s profit will be ______.
Points: 0
Points: 0
Points: 0