13) Which of the following is NOT a characteristic of monopolistic competition?
A) There is easy entry and exit.
B) Firms may make an economic profit in the short run.
C) There is product differentiation in the market.
D) Firms set the price of their product equal to their marginal cost.
14) Firms in monopolistic competition have rivals that
A) match their price increases.
B) match their price decreases.
C) agree on a common price.
D) set their prices according to the demand curves they face.
15) In the short run, a monopolistically competitive firm chooses
A) both its price and its quantity.
B) its price but not its quantity.
C) its quantity but not its price.
D) neither its price nor its quantity.
16) In monopolistic competition, in the short run a firm maximizes its profit by selecting an
output at which marginal cost equals
A) average total cost.
B) marginal revenue.
C) price.
D) zero.
17) In monopolistic competition, profit is maximized when the amount produced is such that
A) marginal revenue equals marginal cost.
B) marginal revenue is greater than marginal cost.
C) total revenue equals total cost.
D) total revenue is maximized.
18) In the short run, a firm in monopolistic competition produces where
A) MR = MC and economic profit is equal to zero.
B) MR = MC.
C) the given market price is equal to MC and economic profit is equal to zero.
D) the given market price is equal to MC.
19) The profit maximizing condition for a firm in monopolistic competition is to produce so that
A) marginal cost equals marginal revenue.
B) marginal cost equals price.
C) average total cost equals price.
D) price equals marginal revenue.
20) Which of the following is ALWAYS true regarding a profit maximizing monopolistically
competitive firm in short-run equilibrium?
A) P = ATC.
B) P = MR.
C) MR = MC.
D) MC = ATC.
21) Which of the following statements is CORRECT for a monopolistically competitive firm in
the short run?
A) Its total revenue is maximized.
B) Its total fixed cost is 0.
C) Its marginal cost is equal to its marginal revenue.
D) Its price is equal to its marginal cost.
22) A monopolistically competitive firm will always choose to produce where
A) marginal revenue equals marginal cost.
B) marginal cost meets the demand curve.
C) average total cost meets the demand curve.
D) average total cost is minimized.
23) How is a monopolistically competitive firm similar to a monopoly firm?
A) Both produce where marginal revenue equals marginal cost.
B) Both will observe entry into the industry if economic profit is positive.
C) Both produce a unique good.
D) Both produce where price equals marginal cost.
24) In the short run, a firm in a monopolistic competition will produce the amount of output
where its
A) marginal revenue equals marginal cost and will set its price according to the demand for that
amount of output.
B) marginal revenue equals marginal cost and takes the market price as given.
C) average revenue equals average cost and will set its price according to the demand for that
amount of output.
D) average revenue equals its average cost and takes the market price as given.
25) In the short run, for a firm in monopolistic competition
A) the firm’s economic profit must equal zero.
B) marginal revenue exceeds marginal cost.
C) price exceeds marginal cost.
D) the firm is a price taker.
26) Which of the following statements regarding a profit-maximizing monopolistically
competitive firm is NOT true?
A) The MR curve lies below the demand curve.
B) The firm produces the quantity at which the MR curve intersects the MC curve.
C) The MC curve intersects the ATC curve at the ATC curve’s lowest point.
D) The firm’s price equals the price at which the MR curve intersects the MC curve.
27) If a monopolistically competitive firm’s marginal cost curve shifts upward, then the amount
of output it produces
A) increases.
B) stays the same.
C) decreases.
D) could increase, decrease, or stay the same but more information is needed.
28) When firms in monopolistic competition incur an economic loss, some firms will
A) enter the industry and produce more products.
B) exit the industry, and demand will increase for the firms that remain.
C) exit the industry, and demand will decrease for the firms that remain.
D) enter the industry, and demand will become more elastic for the original firms.
29) If firms in a monopolistically competitive industry are making an economic profit, then
A) some customers will exit the market.
B) some workers will leave the industry’s labor force.
C) some firms will leave the industry.
D) new firms will enter the industry.
30) When firms in monopolistic competition are making an economic profit, firms will
A) enter the industry, and demand will increase for the original firms.
B) exit the industry, and demand will increase for the firms that remain.
C) exit the industry, and demand will decrease for the firms that remain.
D) enter the industry, and demand will decrease for the original firms.
31) In monopolistic competition, firms can make an economic profit in
A) the short run and in the long run.
B) the short run but not in the long run.
C) the long run but not in the short run.
D) neither the long run nor the short run.
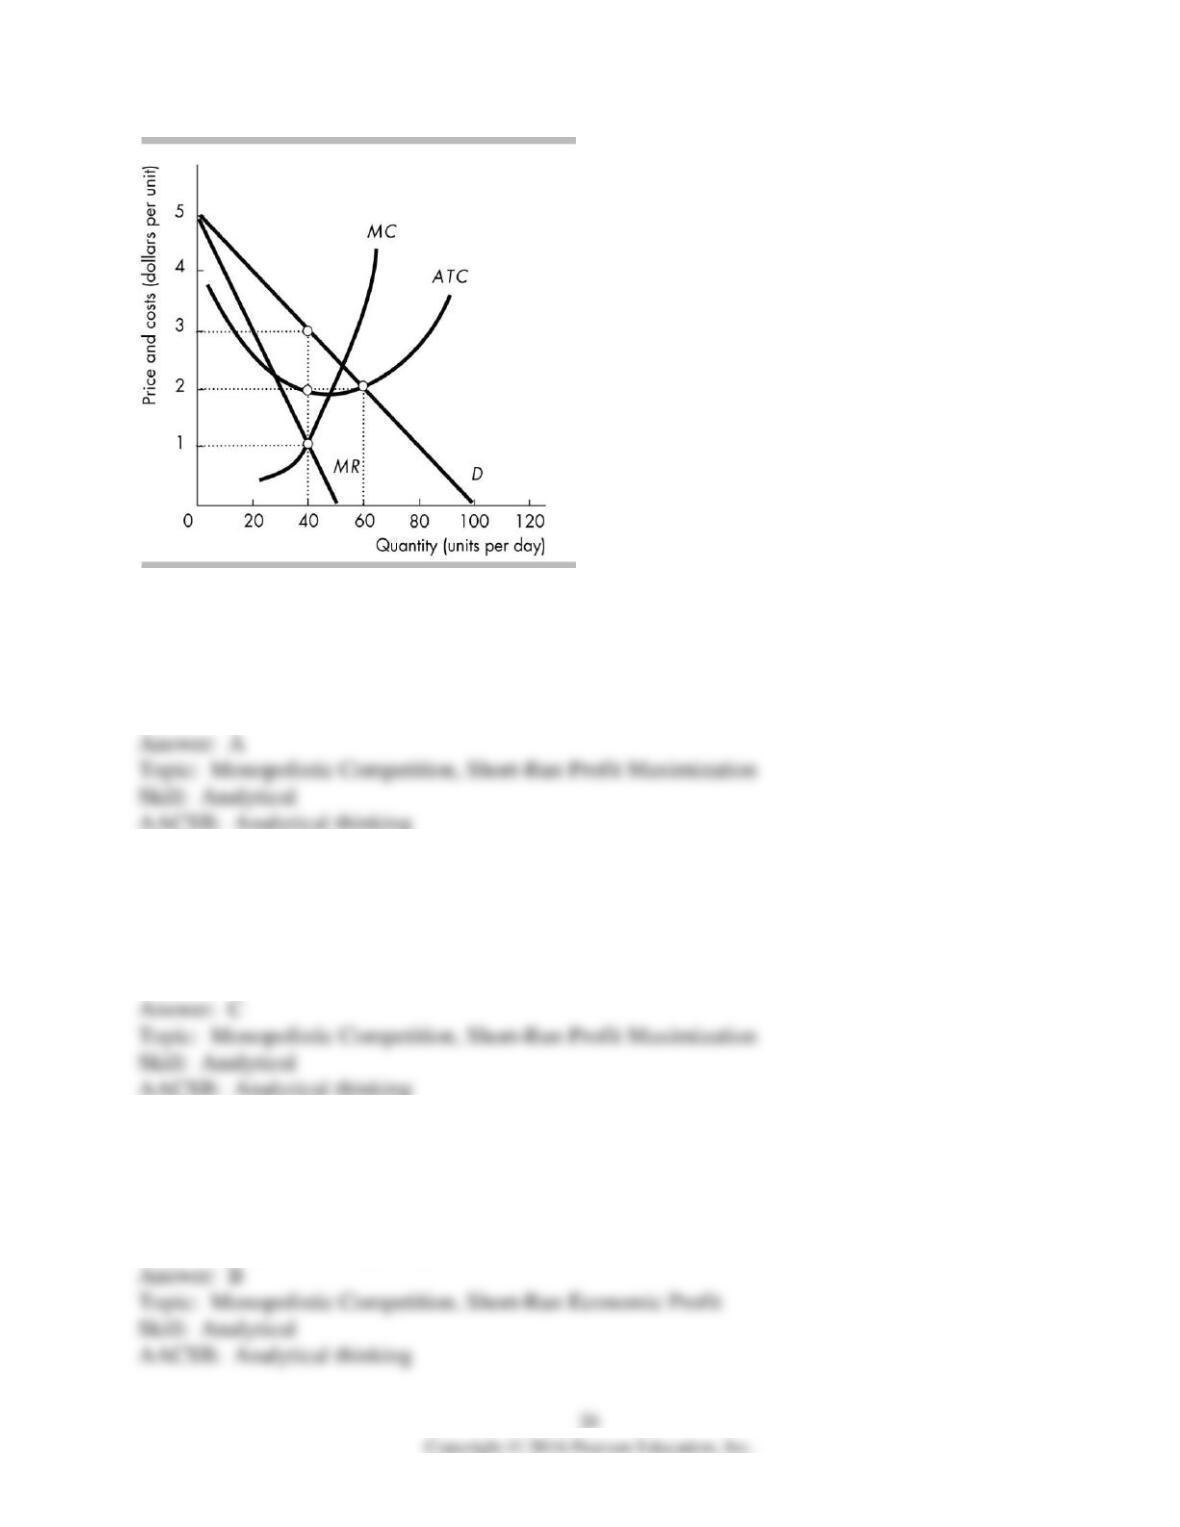
32) In the above figure, if the firm is in monopolistic competition, it will produce
A) 40 units.
B) 60 units.
C) between 61 and 99 units.
D) 100 units.
33) In the above figure, if the firm is in monopolistic competition, its price will be
A) $1.
B) $2.
C) $3.
D) $4.
34) In the above figure, the monopolistically competitive firm makes an economic profit of
A) $0.
B) between $0 and $50 per day.
C) between $50.01 and $100 per day.
D) greater than $100.01 per day.
35) The above figure is for a firm in monopolistic competition. The diagram represents the short
run rather than the long run because the
A) MR curve cuts the ATC curve from below.
B) MR curve and the D curve do not coincide.
C) firm is incurring an economic loss.
D) firm is making an economic profit.
36) The figure above shows a monopolistically competitive firm in the short run. During the
transition to the long run, the demand curve will shift ________ and the MR curve will shift
________.
A) leftward; leftward
B) leftward; rightward
C) rightward; leftward
D) rightward; rightward
37) The figure above shows Bill’s Hotdogs, a monopolistically competitive firm. If other firms
enter the market and have hot dogs that are very close substitutes for Bill’s Hotdogs, then the
demand curve for Bill’s Hotdogs will ________.
A) shift leftward and become more elastic
B) shift rightward and become more elastic
C) shift rightward and be parallel to the original demand curve
D) shift leftward and be parallel to the original demand curve
38) If all firms in a monopolistically competitive industry faced the same demand and cost
curves pictured in the above figure
A) new firms will enter the industry.
B) some firms will exit the industry.
C) their economic profit would be zero.
D) they would each produce 60 units.
39) In the above figure, the firm is a monopolistically competitive firm. In the long run, its
economic profit will be
A) zero.
B) between zero and $50 per day.
C) greater than $50 per day.
D) some amount that cannot be determined without more information.
40) The figure above could represent the long-run equilibrium for a
A) perfectly competitive firm.
B) monopolistically competitive firm.
C) monopoly.
D) firm facing inelastic demand at all outputs.
41) The above figure shows the demand and cost curves for a firm in ________ in the ________.
A) perfect competition; short run
B) monopolistic competition; long run
C) perfect competition; long run
D) monopolistic competition; short run
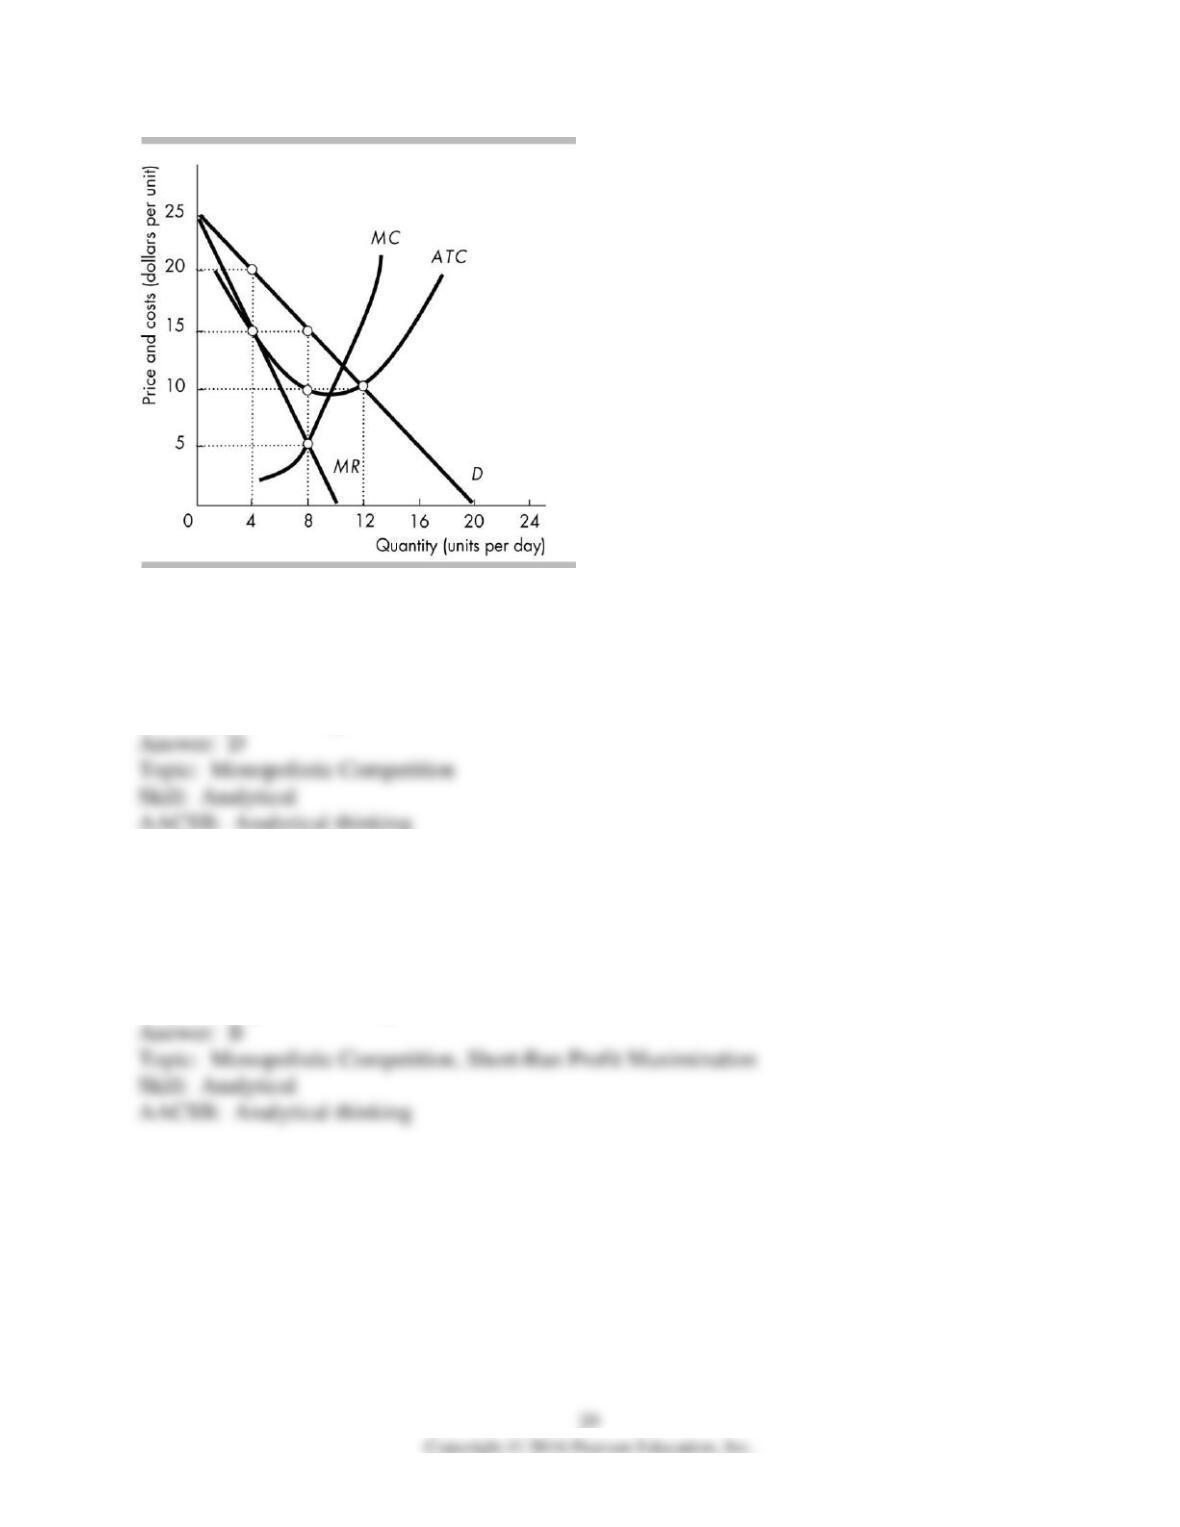
42) The above figure shows the demand and cost curves for a firm in monopolistic competition.
The firm maximizes its profit by
A) producing 8 units at a price of $5 each.
B) producing 8 units at a price of $15 each.
C) producing 4 units at a price of $20 each.
D) producing 12 units at a price of $10 each.
43) The above figure shows the demand and cost curves for a firm in monopolistic competition.
The firm earns total revenue of
A) $120.
B) $40.
C) $160.
D) $0.
44) The above figure shows the demand and cost curves for a firm in monopolistic competition.
The firm makes the maximum profit when the marginal cost of last item produced equals
A) $5.
B) $10.
C) $15.
D) $20.
45) The above figure shows the demand and cost curves for a firm in monopolistic competition.
The graph represents the firm’s situation in
A) only the short run.
B) only the long run.
C) either the short run or the long run.
D) neither the short run nor the long run.
46) The above figure shows the demand and cost curves for a firm in monopolistic competition.
In the figure, the firm makes an economic profit of
A) $0.
B) $20.
C) $40.
D) $120.
47) The above figure shows the demand and cost curves for a firm. The figure shows a
A) monopolistically competitive firm in the long run.
B) perfectly competitive firm earning zero profit.
C) monopolistically competitive firm in the short run.
D) perfectly competitive firm in the short run.
48) The above figure shows the demand and cost curves for a firm in monopolistic competition.
In the long run, the demand for this firm’s product will
A) decrease as other firms enter the industry.
B) decrease as product differences disappear.
C) become less elastic as firms exit the industry.
D) become less elastic as other firms enter the industry.
49) In a monopolistically competitive industry, the firms are currently making an economic
profit. When this market moves to its long-run equilibrium, the firms’ demand curves will have
________ and their economic profit will have ________.
A) shifted leftward; decreased to zero
B) shifted leftward; decreased but remain greater than zero
C) shifted rightward; decreased to zero
D) remained the same; decreased to zero
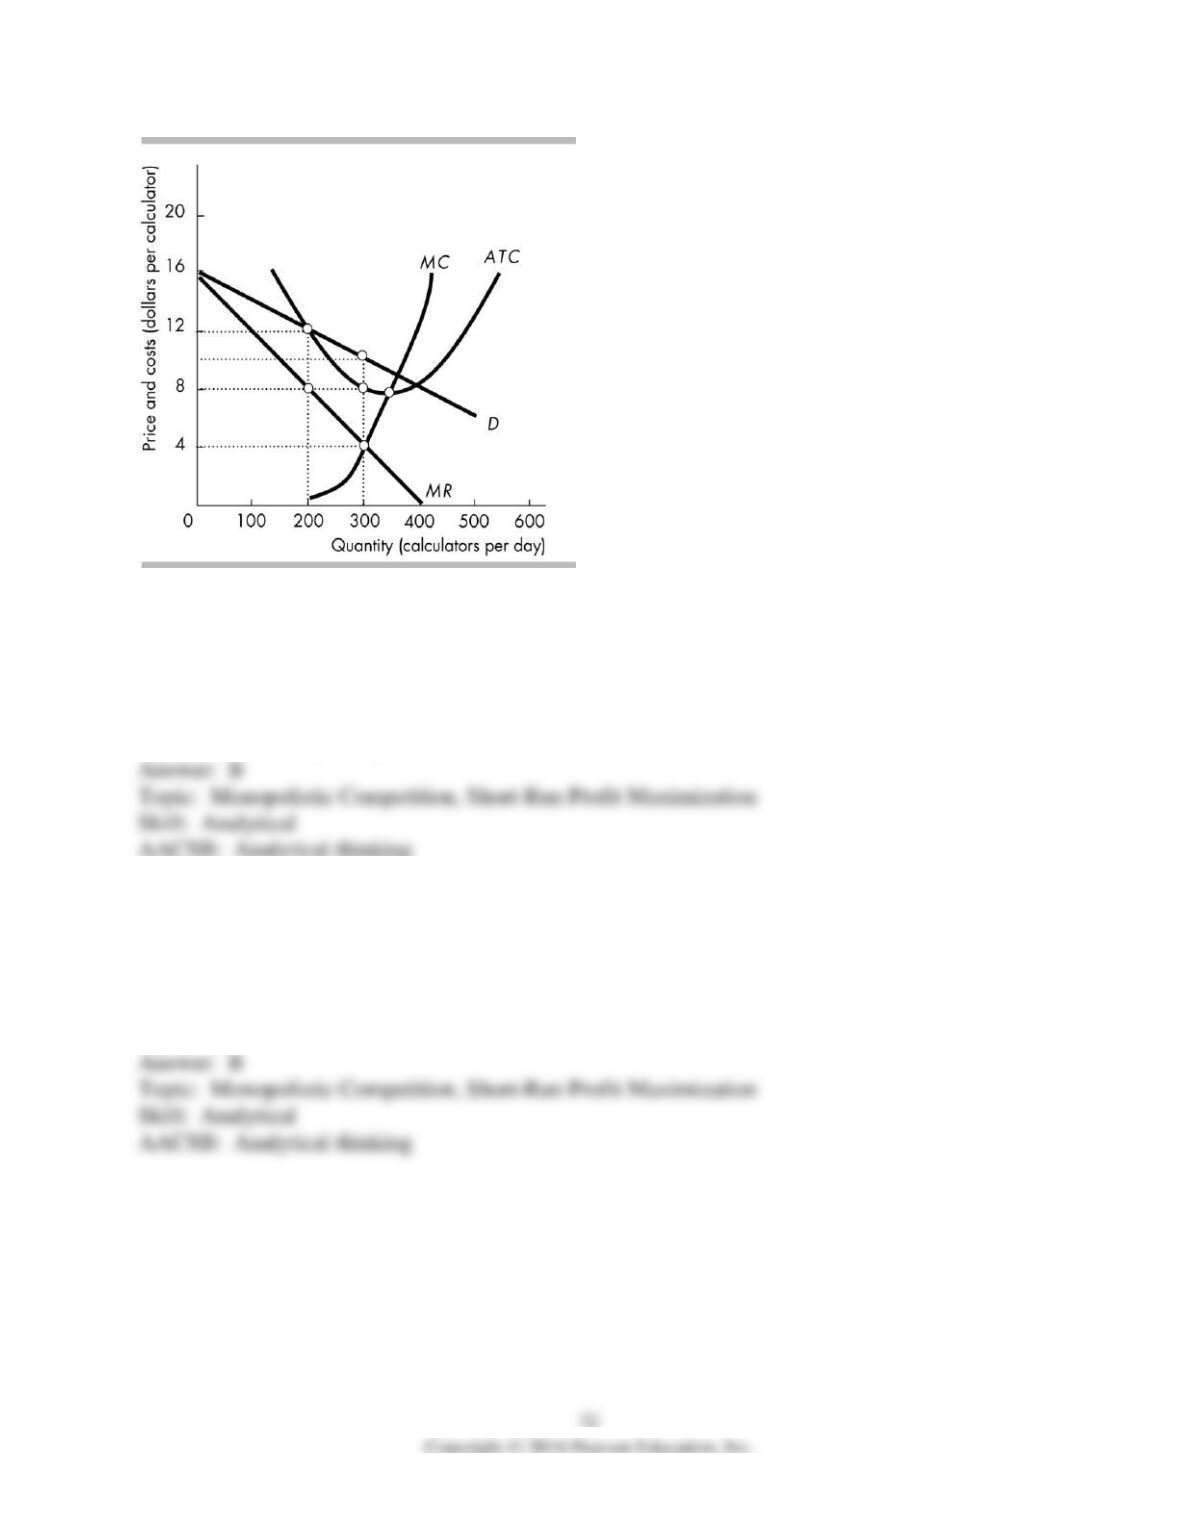
50) The figure above shows the situation facing Smart Digit, Inc., a firm in monopolistic
competition that produces calculators. What quantity does the firm produce?
A) 200 calculators per day
B) 300 calculators per day
C) more than 300 calculators per day and less than 400 calculators per day
D) 400 calculators per day
51) The figure above shows the situation facing Smart Digit, Inc., a firm in monopolistic
competition that produces calculators. What is the firm’s profit-maximizing price?
A) $12
B) $10
C) $8
D) $4
52) The figure above shows the situation facing Smart Digit, Inc., a firm in monopolistic
competition that produces calculators. What is the firm’s economic profit per day?
A) zero
B) between $1 and $700
C) between $701 and $900
D) more than $901
53) The figure above shows the situation facing Smart Digit, Inc., a firm in monopolistic
competition that produces calculators. The firm’s markup is ________ per calculator.
A) zero
B) $2
C) $4
D) $6
54) The figure above shows the situation facing Smart Digit, Inc., a firm in monopolistic
competition that produces calculators. The firm’s economic profit in the long run is
A) zero.
B) $600.
C) $900.
D) $2,400.
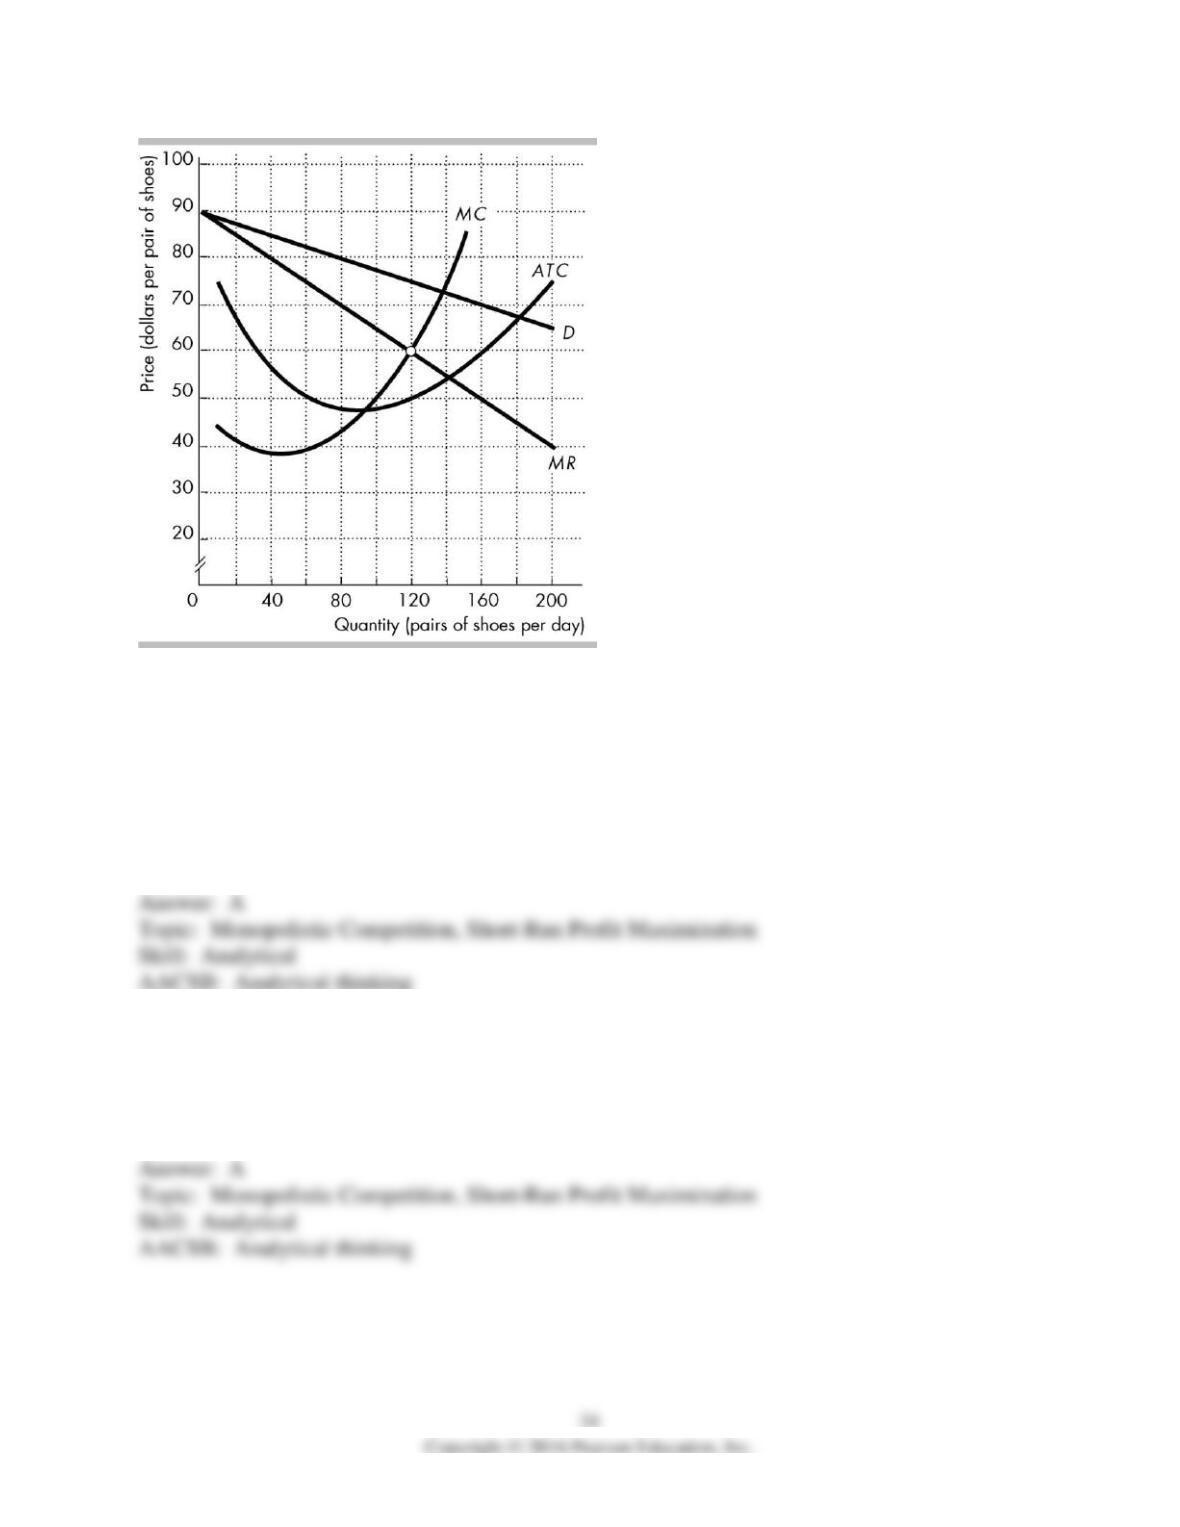
The figure shows the demand curve for Nike shoes (D), and Nike’s marginal revenue curve
(MR), marginal cost curve (MC), and average total cost curve (ATC).
55) In the figure above, Nike maximizes its profit if it sells ________ pairs of shoes per day.
A) 120
B) 87
C) 137
D) 150
56) In the figure above, Nike maximizes its profit if it charges ________ per pair of shoes.
A) $75
B) $60
C) $72
D) $42
57) In the figure above, Nike’s economic profit is ________.
A) $3,000
B) $1,800
C) $9,000
D) zero
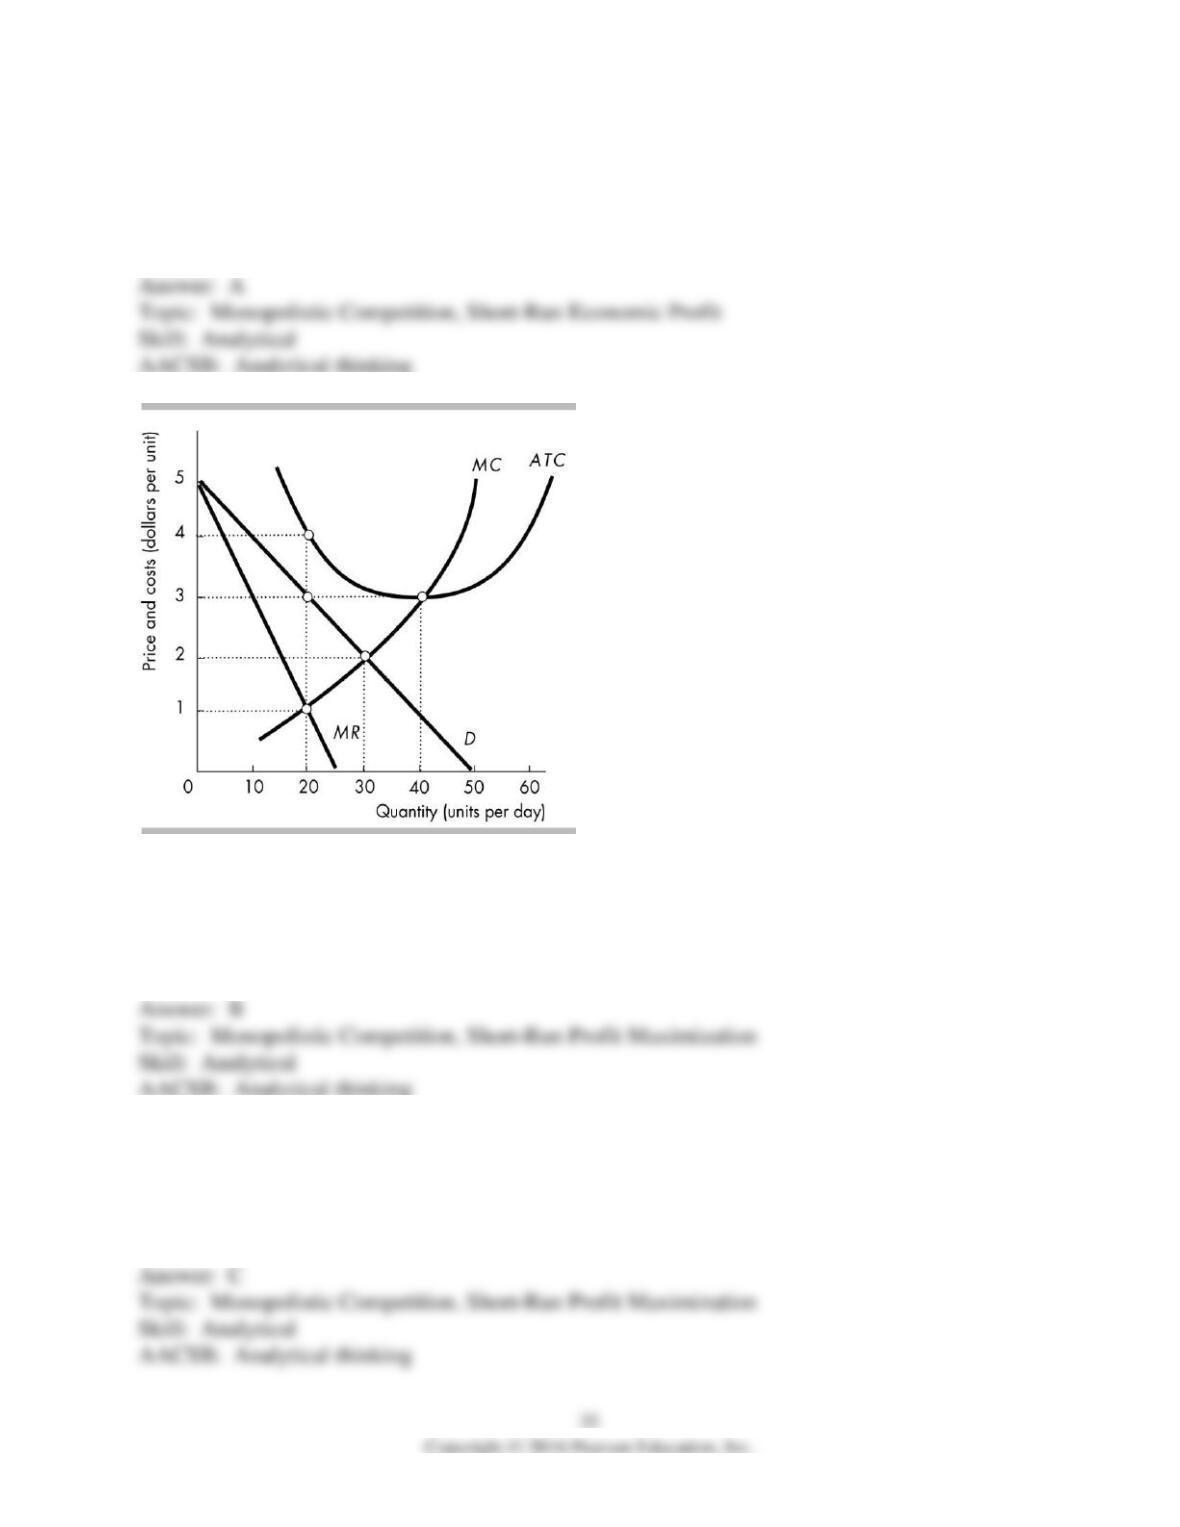
58) In the figure above, assuming that the firm does not shut down, the firm will produce
A) fewer than 19 units.
B) 20 units.
C) 30 units.
D) 40 units.
59) In the figure above, assuming that the firm does not shut down, it will charge a price of
A) $1.
B) $2.
C) $3.
D) $4.
60) In the figure above, the firm’s economic
A) loss will be greater than $30 per day.
B) loss will be $30 or less per day.
C) profit will be between $0 and $30 per day.
D) profit will be greater than $30.01 per day.
61) The figure above shows a firm in monopolistic competition. If all firms in the industry have
the demand and cost curves illustrated in the figure, then in the long run
A) some firms will have exited the industry.
B) some firms will have entered the industry.
C) firms will have neither entered nor exited the industry.
D) we cannot tell if firms will either have entered or exited the industry.
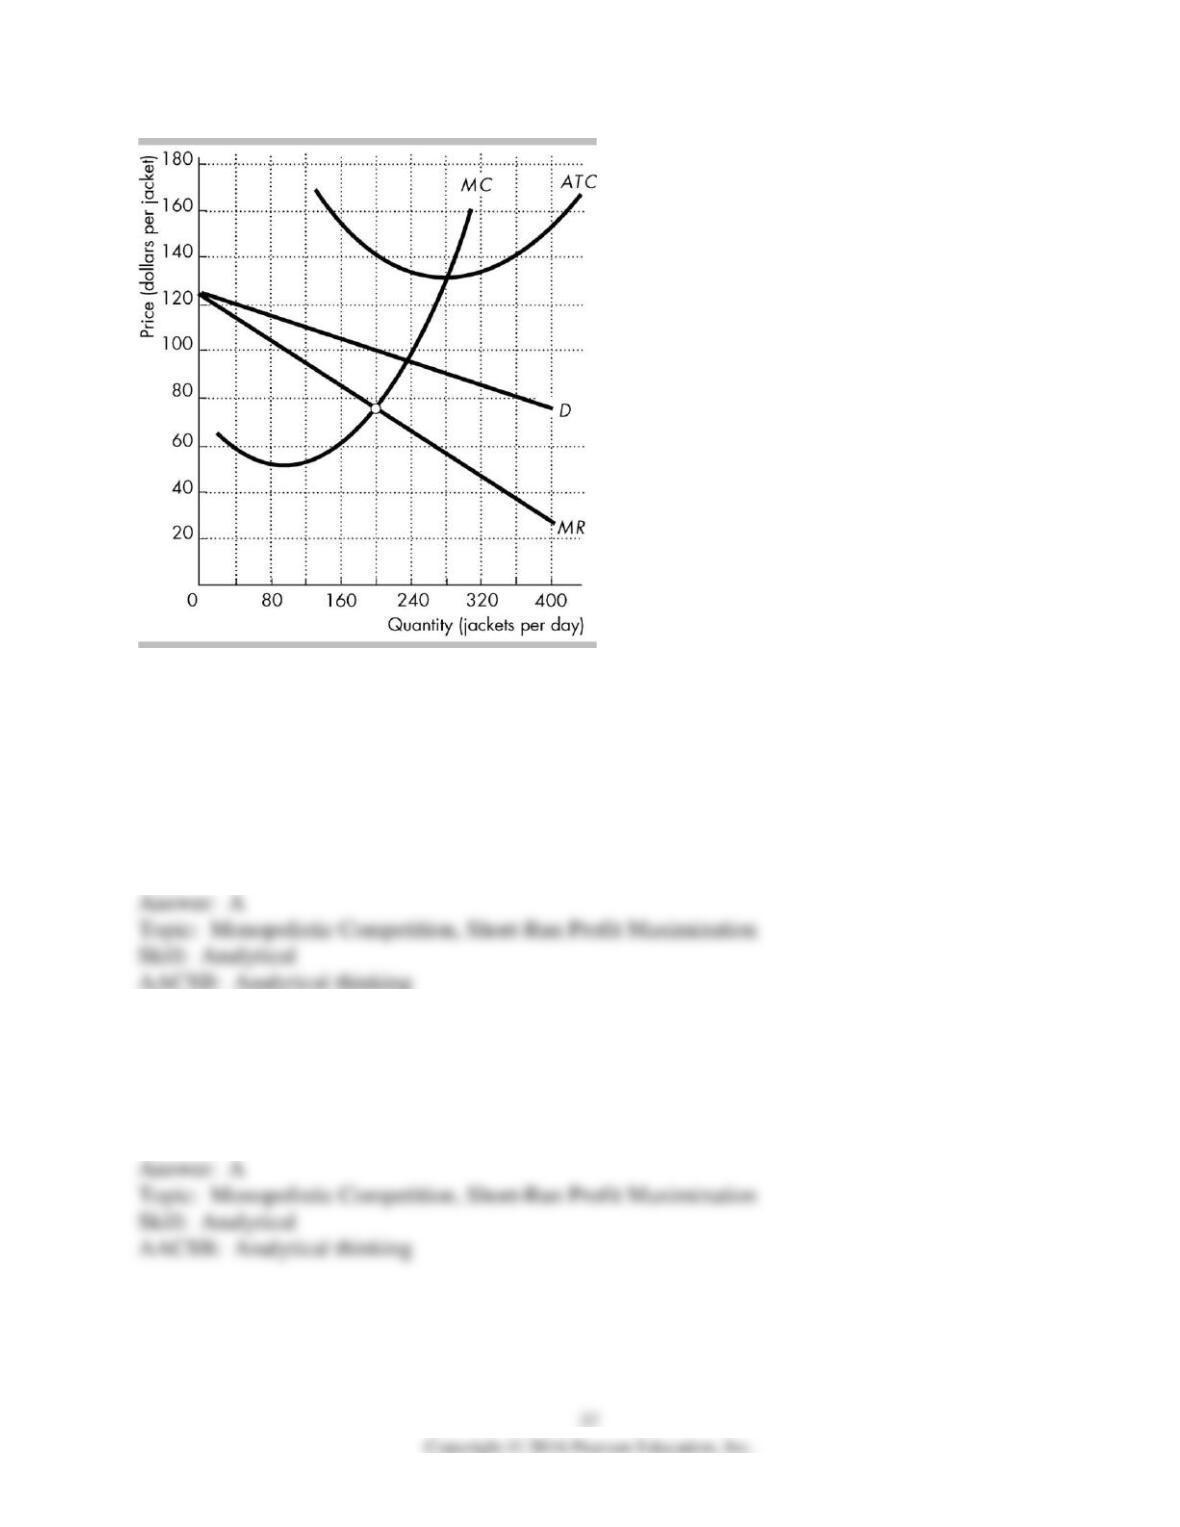
The figure shows the demand curve for Gap jackets (D), and Gap’s marginal revenue curve
(MR), marginal cost curve (MC), and average total cost curve (ATC).
62) In the figure above, Gap maximizes its profit if it sells ________ jackets per day.
A) 200
B) 240
C) 275
D) 140
63) In the figure above, Gap maximizes its profit if it charges ________ per jacket.
A) $100
B) $95
C) $75
D) $120
64) In the figure above, Gap’s economic ________ is ________.
A) loss; $8,000
B) loss; $13,000
C) profit; $7,200
D) profit; $13,000
65) If the market demand in a monopolistically competitive industry increases, a likely result in
the long run will be
A) less elastic demand curves facing each firm.
B) a higher ratio of price to average cost.
C) a larger number of firms producing a similar product.
D) a transition from monopolistic competition to oligopoly.
66) Which of the following is FALSE regarding the long run for a firm in monopolistic
competition?
A) The firm’s economic profit equals zero.
B) Marginal cost equals average total cost.
C) Price exceeds marginal cost.
D) Price equals average total cost.
67) Which of the following statements regarding the long run for a profit-maximizing
monopolistically competitive firm is FALSE?
A) The firm is making zero economic profit.
B) The firm produces the quantity of output for which marginal revenue equals marginal cost.
C) The average total cost equals the price.
D) The firm produces the quantity at which the marginal revenue curve intersects the demand
curve.
68) Which of the following is FALSE regarding the long run for a firm in monopolistic
competition?
A) The firm makes zero economic profit.
B) Price equals average total cost.
C) Output is not produced at minimum average total cost.
D) None of the above is a false statement.
69) Which of the following is TRUE regarding the long run for a firm in monopolistic
competition?
A) The firm can make an economic profit because of product differentiation.
B) Marginal cost equals average total cost.
C) Output is produced at minimum average total cost.
D) Price equals average total cost.
70) Consider a monopolistically competitive industry which is in long-run equilibrium. Which of
the following is TRUE?
A) All firms charge a price equal to average total cost.
B) All firms charge a price equal to marginal cost.
C) All firms earn positive economic profit.
D) Demand, average total cost, and marginal cost all intersect.
71) In the long run, a firm in monopolistic competition has its price equal to ________ and also
has its price ________.
A) marginal cost; exceeding its average total cost.
B) marginal cost; equal to its average total cost
C) average total cost; exceeds its marginal cost
D) average total cost; less than its marginal cost
72) In the long run, a firm in a monopolistically competitive industry produces where its
marginal cost
A) is less than its average cost.
B) equals its average cost.
C) exceeds its average cost.
D) equals its price.
73) Freedom of entry and exit in monopolistic competition
A) means that firms’ price and average total cost of producing are always equal.
B) never allows firms to earn economic profits.
C) leads to falling prices when new firms enter the market.
D) forces firms to abandon product differentiation but only in the long run.
74) In the long run, a firm in monopolistic competition produces where the slope of the average
total cost curve is
A) negative.
B) zero.
C) positive.
D) equal to the marginal cost.
75) In the long-run, a firm in monopolistic competition produces an amount of output that sets
A) P > ATC and MR = MC.
B) P > ATC and MR > MC.
C) P = ATC and MR = MC.
D) P = ATC and MR > MC.