Chapter 14 Test Bank KEY
1. Diamonds are expensive because:
2. DeBeers was able to profit the most from the diamond market by selling a:
3. Monopoly power in a market causes:
4. Monopoly power in a market causes:
5. Most U.S. firms face:
6. A firm that is the sole producer of a good or service with no close substitutes is called a:
7. A monopoly is a firm that:
8. A monopoly has:
9. A perfect monopoly:
10. A monopoly:
11. A perfect monopoly:
12. A perfect monopoly:
13. Firms can have a high degree of monopoly power and not be a perfect monopoly if they:
14. An essential characteristic of a monopoly is:
15. One of the key reasons why monopolies exist is:
16. One barrier to entry into a monopoly market is:
14-4
17. One barrier to entry into a monopoly market is:
18. Which of the following is not considered a barrier to entry into a monopoly market?
19. One barrier to entry into a monopoly market is:
20. A natural monopoly is a market in which a single firm:
21. A market in which a single firm can produce, at a lower cost than multiple firms, the entire quantity of
output demanded is called:
22. Natural monopolies are the natural result of:
23. Government regulations:
24. All of the following are reasons a government might choose to protect monopoly rights in an industry
except:
25. All of the following are ways a government might protect monopoly rights except:
26. One way a government might protect monopoly rights is by:
27. Protecting intellectual property rights:
28. Protecting intellectual property rights:
29. Protecting intellectual property rights:
30. One way DeBeers managed to maintain control over the diamond industry was to:
31. Predatory pricing is:
32. Predatory pricing:
33. A monopoly:
34. At any price the monopolist sets, it will sell:
35. When the monopolist decides to supply a given amount to the market, it will:
36. The monopolist faces a:
37. If the monopolist charges a high price, he will sell:
38. The most a monopolist can sell at any given price is:
39. The monopolist is always constrained by:
40. This table represents the revenues faced by a monopolist.
Price
Quantity
Sold
Total
Revenue
Average
Revenue
Marginal
Revenue
$1,000
1
$1,000
$900
2
$1,800
$800
3
$2,400
$700
4
$2,800
$600
5
$3,000
$500
6
$3,000
$400
7
$2,800
Using the information in the table shown, the marginal revenue for the 3rd unit is:
14-9
41. This table represents the revenues faced by a monopolist.
Price
Quantity
Sold
Total
Revenue
Average
Revenue
Marginal
Revenue
$1,000
1
$1,000
$900
2
$1,800
$800
3
$2,400
$700
4
$2,800
$600
5
$3,000
$500
6
$3,000
$400
7
$2,800
Using the information in the table shown, the average revenue for 5 units is:
42. This table represents the revenues faced by a monopolist.
Price
Quantity
Sold
Total
Revenue
Average
Revenue
Marginal
Revenue
$1,000
1
$1,000
$900
2
$1,800
$800
3
$2,400
$700
4
$2,800
$600
5
$3,000
$500
6
$3,000
$400
7
$2,800
14–10
Using the information in the table shown, the average revenue for this firm:
43. This table represents the revenues faced by a monopolist.
Price
Quantity
Sold
Total
Revenue
Average
Revenue
Marginal
Revenue
$1,000
1
$1,000
$900
2
$1,800
$800
3
$2,400
$700
4
$2,800
$600
5
$3,000
$500
6
$3,000
$400
7
$2,800
Using the information in the table shown, the marginal revenue for the 4th unit is:
44. This table represents the revenues faced by a monopolist.
Price
Quantity
Sold
Total
Revenue
Average
Revenue
Marginal
Revenue
$1,000
1
$1,000
$900
2
$1,800
$800
3
$2,400
$700
4
$2,800
$600
5
$3,000
$500
6
$3,000
$400
7
$2,800
Using the information in the table shown, the marginal revenue of the 6th unit is:
45. This table represents the revenues faced by a monopolist.
Price
Quantity
Sold
Total
Revenue
Average
Revenue
Marginal
Revenue
$1,000
1
$1,000
$900
2
$1,800
$800
3
$2,400
$700
4
$2,800
$600
5
$3,000
$500
6
$3,000
$400
7
$2,800
Using the information in the table shown, the marginal revenue:
14–12
46. This table represents the revenues faced by a monopolist.
Price
Quantity Sold
Total Revenue
Average Revenue
Marginal Revenue
$1,000
1
$1,000
$900
2
$1,800
$800
3
$2,400
$700
4
$2,800
$600
5
$3,000
$500
6
$3,000
$400
7
$2,800
Using the information in the table shown, if you were to graph the first two columns, you would have
graphed which curve?
47. For a monopolist, total revenues will:
48. For a monopolist, average revenues:
49. Total revenues increase as output increases along sections of the demand curve that are:
50. Total revenue decreases as output increases when demand is:
51. For a monopolist, the price effect:
52. For a monopolist, the quantity effect:
53. If a monopoly wishes to sell more output, it must:
54. When a monopolist increases output, total revenue will:
55. When a perfectly competitive firm increases output, total revenue:
56. For a monopolist, marginal revenue for all units greater than 1 is:
57. For a monopoly, marginal revenue for all units greater than 1 is always:
58. For a monopoly, marginal revenue for all units greater than 1:
59. For a monopoly, for all units greater than one, the marginal revenue curve:
60. For a monopoly producing any output level greater than one, the marginal revenue curve:
61. For a monopoly producing any output level greater than one, the average revenue curve:
62. For a monopoly producing any output level greater than one, the average revenue curve:
63. For a monopoly, a negative marginal revenue implies:
64. For a monopoly, when the price effect outweighs the quantity effect of increased production:
65. For a monopoly, when marginal revenue is zero:
66. A monopolist can maximize profits by:
67. The monopolist’s cost curves differ from those of a perfectly competitive firm in that the:
68. The revenue curves that a monopoly faces are different from those that a perfectly competitive firm
faces in that the:
69. The profit-maximizing decision for the monopoly is:
70. At any quantity of output below the intersection of the marginal revenue and marginal cost curves:
71. At any quantity of output above the intersection of the marginal revenue and marginal cost curves:
72. For a monopolist, at the profit-maximizing level of output:
73. For a monopolist, at the profit-maximizing level of output:
74. For a monopolist, at the profit-maximizing level of output price is:
75. When a monopolist chooses the level of output where marginal cost equals marginal revenue:
76. When a monopolist chooses the level of output where marginal cost equals marginal revenue the
price:
77. The monopolist and the perfectly competitive firm both choose to maximize profits by choosing the
level of output where:
78. The monopolist is able to enjoy profits in the long run because:
79. The monopolist’s outcome in the long run differs from that of the perfectly competitive firm in that it:
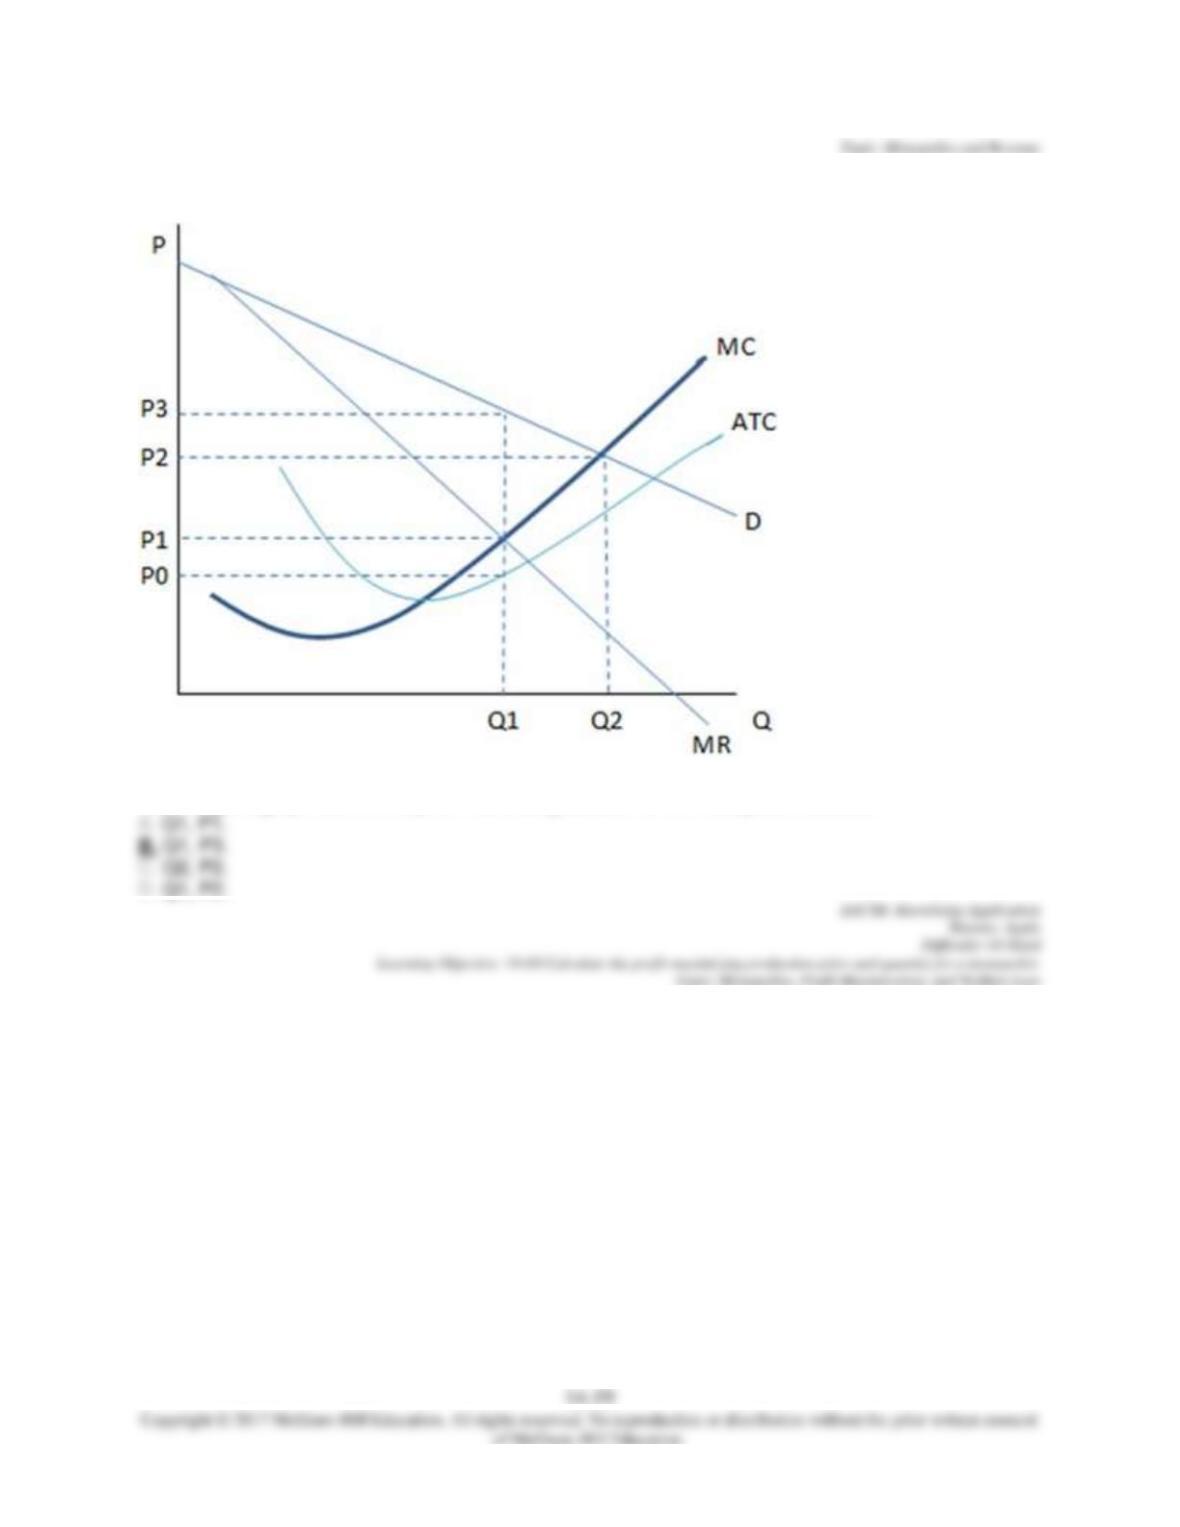
80. This graph shows the cost and revenue curves faced by a monopoly.
According the graph shown, the profit-maximizing decision of the monopolist would be:
81. This graph shows the cost and revenue curves faced by a monopoly.