Chapter 13/The Costs of Production ❖ 21
97. Refer to Scenario 13-9. An accountant would calculate the total profit for one photo frame to be
a.
$10.
b.
$15.
c.
$20.
d.
$25.
98. Refer to Scenario 13-9. An economist would calculate the total profit for one photo frame to be
a.
$10.
b.
$15.
c.
$20.
d.
$25.
Scenario 13–10
Walter builds birdhouses. He spends $5 on the materials for each birdhouse. He can build one in 30 minutes.
He is semi-retired but earns $8 per hour at the local hardware store. He can sell a birdhouse for $20 each.
99. Refer to Scenario 13-10. The explicit cost for one birdhouse is
a.
$4.
b.
$5.
c.
$8.
d.
$9.
100. Refer to Scenario 13-10. The implicit cost for one birdhouse is
a.
$4.
b.
$5.
c.
$8.
d.
$9.
101. Refer to Scenario 13-10. An accountant would calculate the total cost for one birdhouse to be
a.
$5.
b.
$8.
c.
$9.
d.
$13.
102. Refer to Scenario 13-10. An economist would calculate the total cost for one birdhouse to be
a.
$5.
b.
$8.
c.
$9.
d.
$13.
22 ❖ Chapter 13/The Costs of Production
103. Refer to Scenario 13-10. An accountant would calculate the total profit for one birdhouse to be
a.
$7.
b.
$11.
c.
$12.
d.
$15.
104. Refer to Scenario 13-10. An economist would calculate the total profit for one birdhouse to be
a.
$7.
b.
$11.
c.
$12.
d.
$15.
Scenario 13–11
Zach withdrew $400,000 out of his personal savings account and used it to start his new cookie business. The
bank account pays 3 percent interest per year. During the first year of his business, Zach sold 6,000 boxes of
cookies for $2.50 per box. Also during the first year, the cookie business made monetary outlays of $9,000.
You may assume that there is no opportunity cost to Zach’s time.
105. Refer to Scenario 13-11. Zach’s accounting profit for the year was
a.
$-494,000.
b.
$-6,000.
c.
$6,000.
d.
$12,000.
106. Refer to Scenario 13–11. Zach’s economic profit for the year was
a.
$-506,000.
b.
$-6,000.
c.
$3,000.
d.
$6,000.
PRODUCTION AND COSTS
1. Which of these assumptions is often realistic for a firm in the short run?
a.
The firm can vary both the size of its factory and the number of workers it employs.
b.
The firm can vary the size of its factory but not the number of workers it employs.
c.
The firm can vary the number of workers it employs but not the size of its factory.
d.
The firm can vary neither the size of its factory nor the number of workers it employs.
Chapter 13/The Costs of Production ❖ 23
2. Assume a certain firm regards the number of workers it employs as variable but regards the size of its factory
as fixed. This assumption is often realistic
a.
in the short run but not in the long run.
b.
in the long run but not in the short run.
c.
both in the short run and in the long run.
d.
neither in the short run nor in the long run.
3. Suppose that a “doggie day care” firm uses only two inputs: hourly workers (labor) and a building (capital).
In the short run, the firm most likely considers
a.
both labor and capital to be fixed.
b.
both labor and capital to be variable.
c.
labor to be variable and capital to be fixed.
d.
capital to be variable and labor to be fixed.
4. A production function describes
a.
how a firm maximizes profits.
b.
how a firm turns inputs into output.
c.
the minimal cost of producing a given level of output.
d.
the relationship between cost and output.
5. A production function is a relationship between inputs and
a.
quantity of output.
b.
revenue.
c.
costs.
d.
profit.
6. If a firm uses labor to produce output, the firm’s production function depicts the relationship between
a.
the number of workers and the quantity of output.
b.
marginal product and marginal cost.
c.
the maximum quantity that the firm can produce as it adds more capital to a fixed quantity of labor.
d.
fixed inputs and variable inputs in the short run.
7. For a firm, the production function represents the relationship between
a.
implicit costs and explicit costs.
b.
quantity of inputs and total cost.
c.
quantity of inputs and quantity of output.
d.
quantity of output and total cost.
24 ❖ Chapter 13/The Costs of Production
8. For a firm, the relationship between the quantity of inputs and quantity of output is called the
a.
profit function.
b.
production function.
c.
total-cost function.
d.
quantity function.
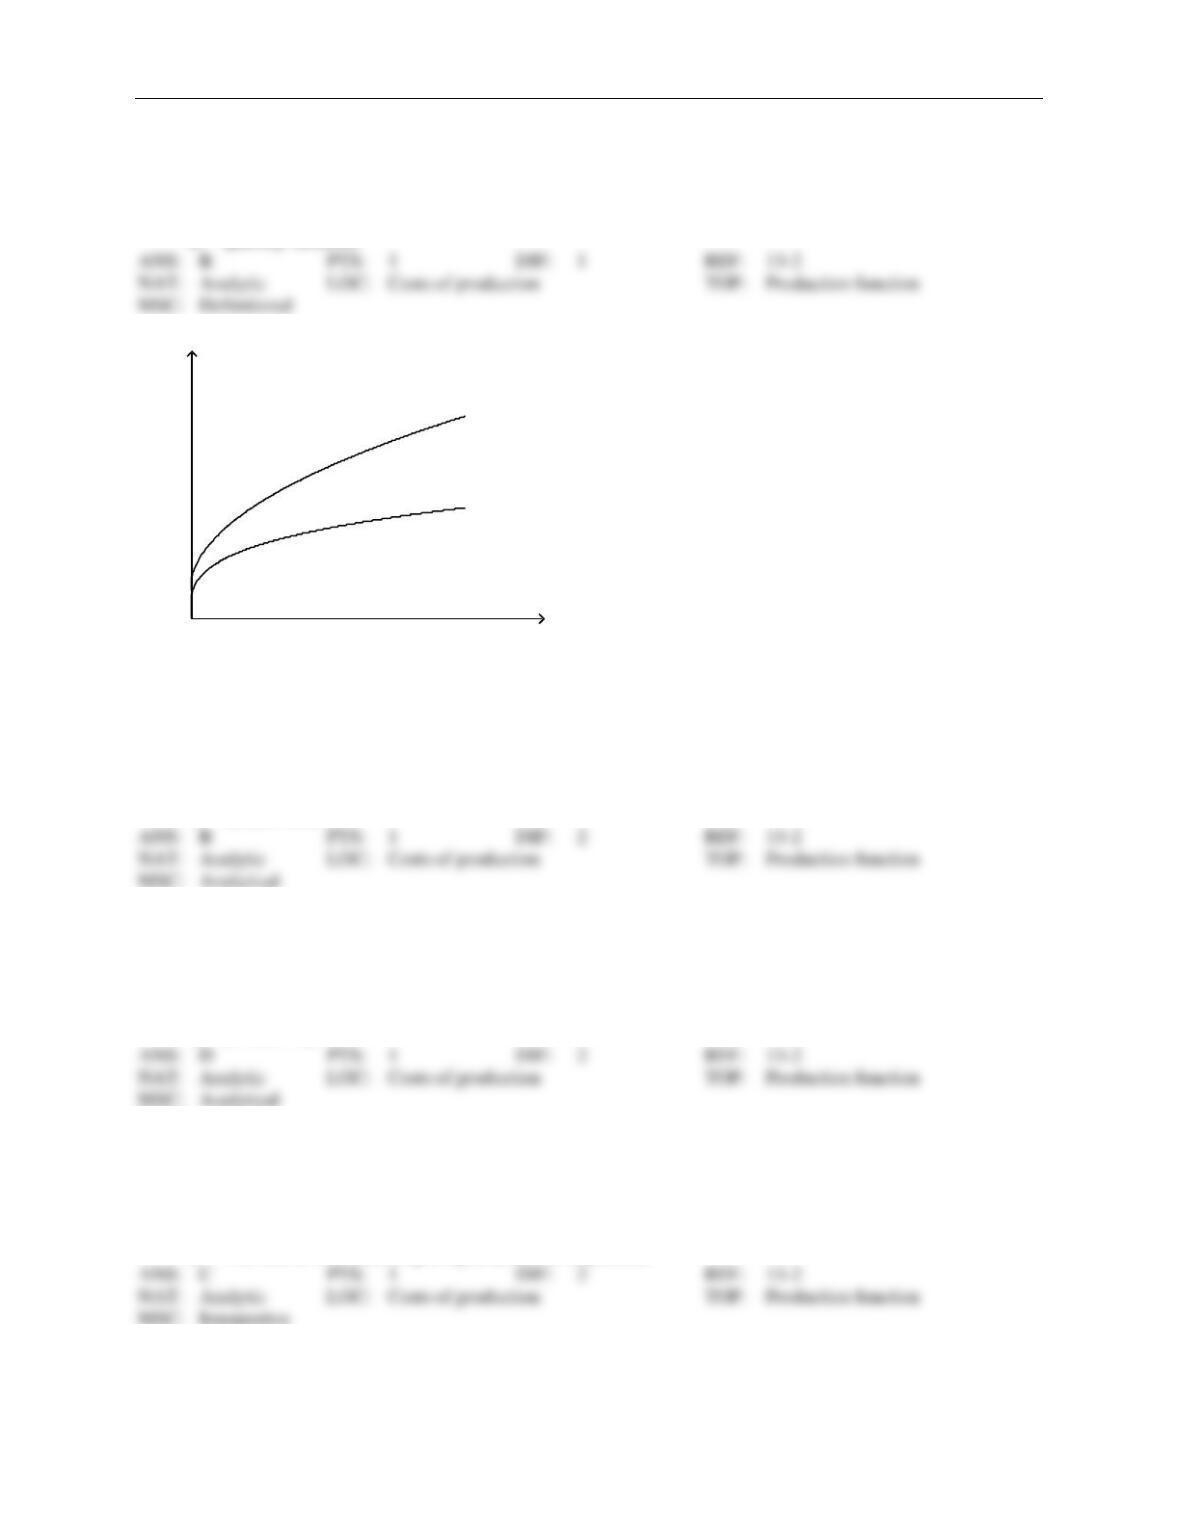
Figure 13-1
9. Refer to Figure 13-1. Suppose the production function shifts from TP1 to TP2. Such a shift in the total prod-
uct curve is most likely due to an increase in the firm’s
a.
costs of production.
b.
productivity.
c.
product price.
d.
market share.
10. Refer to Figure 13-1. Suppose the production function shifts from TP2 to TP1. Such a shift in the total prod-
uct curve is most likely due to a decrease in the firm’s
a.
costs of production.
b.
product price.
c.
market share.
d.
productivity.
11. Refer to Figure 13-1. Which of the following could explain why the total product curve would shift from TP1
to TP2?
a.
There is less capital equipment available to the firm.
b.
Labor skills have become rusty and outdated in the firm.
c.
The firm has developed improved production technology.
d.
The firm is now receiving a higher price for its product.
TP2
TP1
Inputs
Output
Chapter 13/The Costs of Production ❖ 25
12. Refer to Figure 13-1. Which of the following could explain why the total product curve would shift from TP2
to TP1?
a.
There is additional capital equipment available to the firm.
b.
Labor skills have become rusty and outdated in the firm.
c.
The firm has developed improved production technology.
d.
The firm is now receiving a higher price for its product.
13. Grace is a self-employed artist. She can make 20 pieces of pottery per week. She is considering hiring her
sister Kate to work for her. Both she and Kate can make 35 pieces of pottery per week. What is Kate’s mar-
ginal product?
a.
55 pieces of pottery
b.
35 pieces of pottery
c.
22.5 pieces of pottery
d.
15 pieces of pottery
14. Grace is a self-employed artist. She can make 20 pieces of pottery per week. She is considering hiring her
sister Kate to work for her. Kate can make 18 pieces of pottery per week. What would be the total output of
Grace’s firm if she hired her sister?
a.
18 pieces of pottery
b.
19 pieces of pottery
c.
20 pieces of pottery
d.
38 pieces of pottery
15. The marginal product of labor is equal to the
a.
incremental cost associated with a one unit increase in labor.
b.
incremental profit associated with a one unit increase in labor.
c.
increase in labor necessary to generate a one unit increase in output.
d.
increase in output obtained from a one unit increase in labor.
16. The marginal product of labor can be defined as the change in
a.
profit divided by the change in labor.
b.
output divided by the change in labor.
c.
labor divided by the change in output.
d.
labor divided by the change in total cost.
26 ❖ Chapter 13/The Costs of Production
17. The marginal product of an input in the production process is the increase in
a.
total revenue obtained from an additional unit of that input.
b.
profit obtained from an additional unit of that input.
c.
total revenue obtained from an additional unit of that input.
d.
quantity of output obtained from an additional unit of that input.
18. When a firm’s only variable input is labor, then the slope of the production function measures the
a.
quantity of labor.
b.
quantity of output.
c.
total cost.
d.
marginal product of labor.
19. Let L represent the number of workers hired by a firm, and let Q represent that firm’s quantity of output. As-
sume two points on the firm’s production function are (L = 12, Q = 122) and (L = 13, Q = 132). Then the mar-
ginal product of the 13th worker is
a.
8 units of output.
b.
10 units of output.
c.
122 units of output.
d.
132 units of output.
20. Let L represent the number of workers hired by a firm, and let Q represent that firm’s quantity of output. As-
sume two points on the firm’s production function are (L = 5, Q = 125) and (L = 6, Q = 162). Then the mar-
ginal product of the 6th worker is
a.
25 units of output.
b.
27 units of output.
c.
37 units of output.
d.
162 units of output.
21. Let L represent the number of workers hired by a firm, and let Q represent that firm’s quantity of output. As-
sume two points on the firm’s production function are (L=6,Q=147) and (L=7,Q=174). The marginal product
of the seventh worker is
a.
25 units of output.
b.
27 units of output.
c.
37 units of output.
d.
174 units of output.
Chapter 13/The Costs of Production ❖ 27
22. Suppose a certain firm is able to produce 165 units of output per day when 15 workers are hired. The firm is
able to produce 176 units of output per day when 16 workers are hired, holding other inputs fixed. The mar-
ginal product of the 16th worker is
a.
10 units of output.
b.
11 units of output.
c.
16 units of output.
d.
176 units of output.
23. Suppose a firm currently produces 225 units of output per day with 15 workers. The firm is able to produce
235 units of output with a 16th worker. What is the marginal product of the 16th worker?
a.
10 units of output
b.
15 units of output
c.
16 units of output
d.
25 units of output
24. The marginal product of any input is the
a.
increase in total cost associated with a one-unit increase in production.
b.
change in total output associated with a $1.00 increase in total cost.
c.
increase in total cost resulting from the hiring of an additional worker.
d.
increase in total output obtained from one additional unit of that input.
25. Eldin is a house painter. He can paint three houses per week. He is considering hiring his friend Murphy. To-
gether, Eldin and Murphy can paint five houses per week. What is Murphy’s marginal product?
a.
2 houses
b.
3 houses
c.
5 houses
d.
8 houses
26. Eldin is a house painter. He can paint three houses per week. He is considering hiring his friend Murphy. Mur-
phy can paint five houses per week. What is the maximum total output possible if Eldin hires Murphy?
a.
2 houses
b.
3 houses
c.
5 houses
d.
8 houses
28 ❖ Chapter 13/The Costs of Production
Table 13-1
Number of Workers
Total Output
Marginal Product
0
0
—
1
30
2
40
3
50
4
40
5
30
27. Refer to Table 13-1. What is total output when 1 worker is hired?
a.
30
b.
40
c.
120
d.
160
28. Refer to Table 13-1. What is total output when 2 workers are hired?
a.
10
b.
40
c.
70
d.
120
29. Refer to Table 13-1. What is total output when 3 workers are hired?
a.
10
b.
40
c.
70
d.
120
30. Refer to Table 13-1. What is total output when 4 workers are hired?
a.
–10
b.
70
c.
120
d.
160
31. Refer to Table 13-1. What is total output when 5 workers are hired?
a.
–10
b.
120
c.
160
d.
190
Chapter 13/The Costs of Production ❖ 29
Table 13-2
Number of
Workers
Total
Output
Marginal
Product
0
0
—
1
200
2
450
3
600
4
650
32. Refer to Table 13-2. What is the marginal product of the first worker?
a.
250 units
b.
200 units
c.
150 units
d.
50 units
33. Refer to Table 13-2. What is the marginal product of the second worker?
a.
250 units
b.
200 units
c.
150 units
d.
50 units
34. Refer to Table 13-2. What is the marginal product of the third worker?
a.
250 units
b.
200 units
c.
150 units
d.
50 units
35. Refer to Table 13-2. What is the marginal product of the fourth worker?
a.
250 units
b.
200 units
c.
150 units
d.
50 units
36. Refer to Table 13-2. At which number of workers does diminishing marginal product begin?
a.
1
b.
2
c.
3
d.
4
30 ❖ Chapter 13/The Costs of Production
Table 13-3
Number of
Workers
Output
Fixed
Cost
Variable
Cost
Total
Cost
0
0
$50
$0
$50
1
90
$50
$20
$70
2
170
$50
$40
$90
3
230
$50
$60
$110
4
240
$50
$80
$130
37. Refer to Table 13–3. The marginal product of the second worker is
a.
90 units.
b.
85 units.
c.
80 units.
d.
20 units.
38. Refer to Table 13–3. The marginal product of the third worker is
a.
230 units.
b.
100 units.
c.
77 units.
d.
60 units.
39. Refer to Table 13-3. The marginal product of the fourth worker is
a.
10 units.
b.
60 units.
c.
230 units.
d.
240 units.
40. Refer to Table 13-3. At which number of workers does diminishing marginal product begin?
a.
1
b.
2
c.
3
d.
4
41. Refer to Table 13–3. If the firm can sell its output for $1 per unit, what is the profit-maximizing level of out-
put?
a.
240 units
b.
230 units
c.
190 units
d.
170 units
Chapter 13/The Costs of Production ❖ 31
42. When adding another unit of labor leads to an increase in output that is smaller than the increases in output
that resulted from adding previous units of labor, the firm is experiencing
a.
diminishing labor.
b.
diminishing output.
c.
diminishing marginal product.
d.
negative marginal product.
43. On a 100-acre farm, a farmer is able to produce 3,000 bushels of wheat when he hires 2 workers. He is able to
produce 4,400 bushels of wheat when he hires 3 workers. Which of the following possibilities is consistent
with the property of diminishing marginal product?
a.
The farmer is able to produce 5,600 bushels of wheat when he hires 4 workers.
b.
The farmer is able to produce 5,800 bushels of wheat when he hires 4 workers.
c.
The farmer is able to produce 6,000 bushels of wheat when he hires 4 workers.
d.
Any of the above could be correct.
44. On a 100-acre farm, a farmer is able to produce 3,000 bushels of wheat when he hires 2 workers. He is able to
produce 4,400 bushels of wheat when he hires 3 workers. Which of the following possibilities is consistent
with the property of diminishing marginal product?
a.
The farmer is able to produce 5,600 bushels of wheat when he hires 4 workers.
b.
The farmer is able to produce 5,400 bushels of wheat when he hires 4 workers.
c.
The farmer is able to produce 5,200 bushels of wheat when he hires 4 workers.
d.
Any of the above could be correct.
45. When the marginal product of an input declines as the quantity of that input increases, the production function
exhibits
a.
increasing marginal product.
b.
diminishing marginal product.
c.
diminishing total product.
d.
Both b and c are correct.
46. As Bubba’s Bubble Gum Company adds workers while using the same amount of machinery, some workers
may be underutilized because they have little work to do while waiting in line to use the machinery. When this
occurs, Bubba’s Bubble Gum Company encounters
a.
economies of scale.
b.
diseconomies of scale.
c.
increasing marginal product.
d.
diminishing marginal product.
32 ❖ Chapter 13/The Costs of Production
47. If a production function shows declining marginal product of an input as the quantity of the input increases,
then the production function exhibits
a.
diminishing profitability.
b.
increasing returns to scale.
c.
increasing marginal product.
d.
decreasing marginal product.
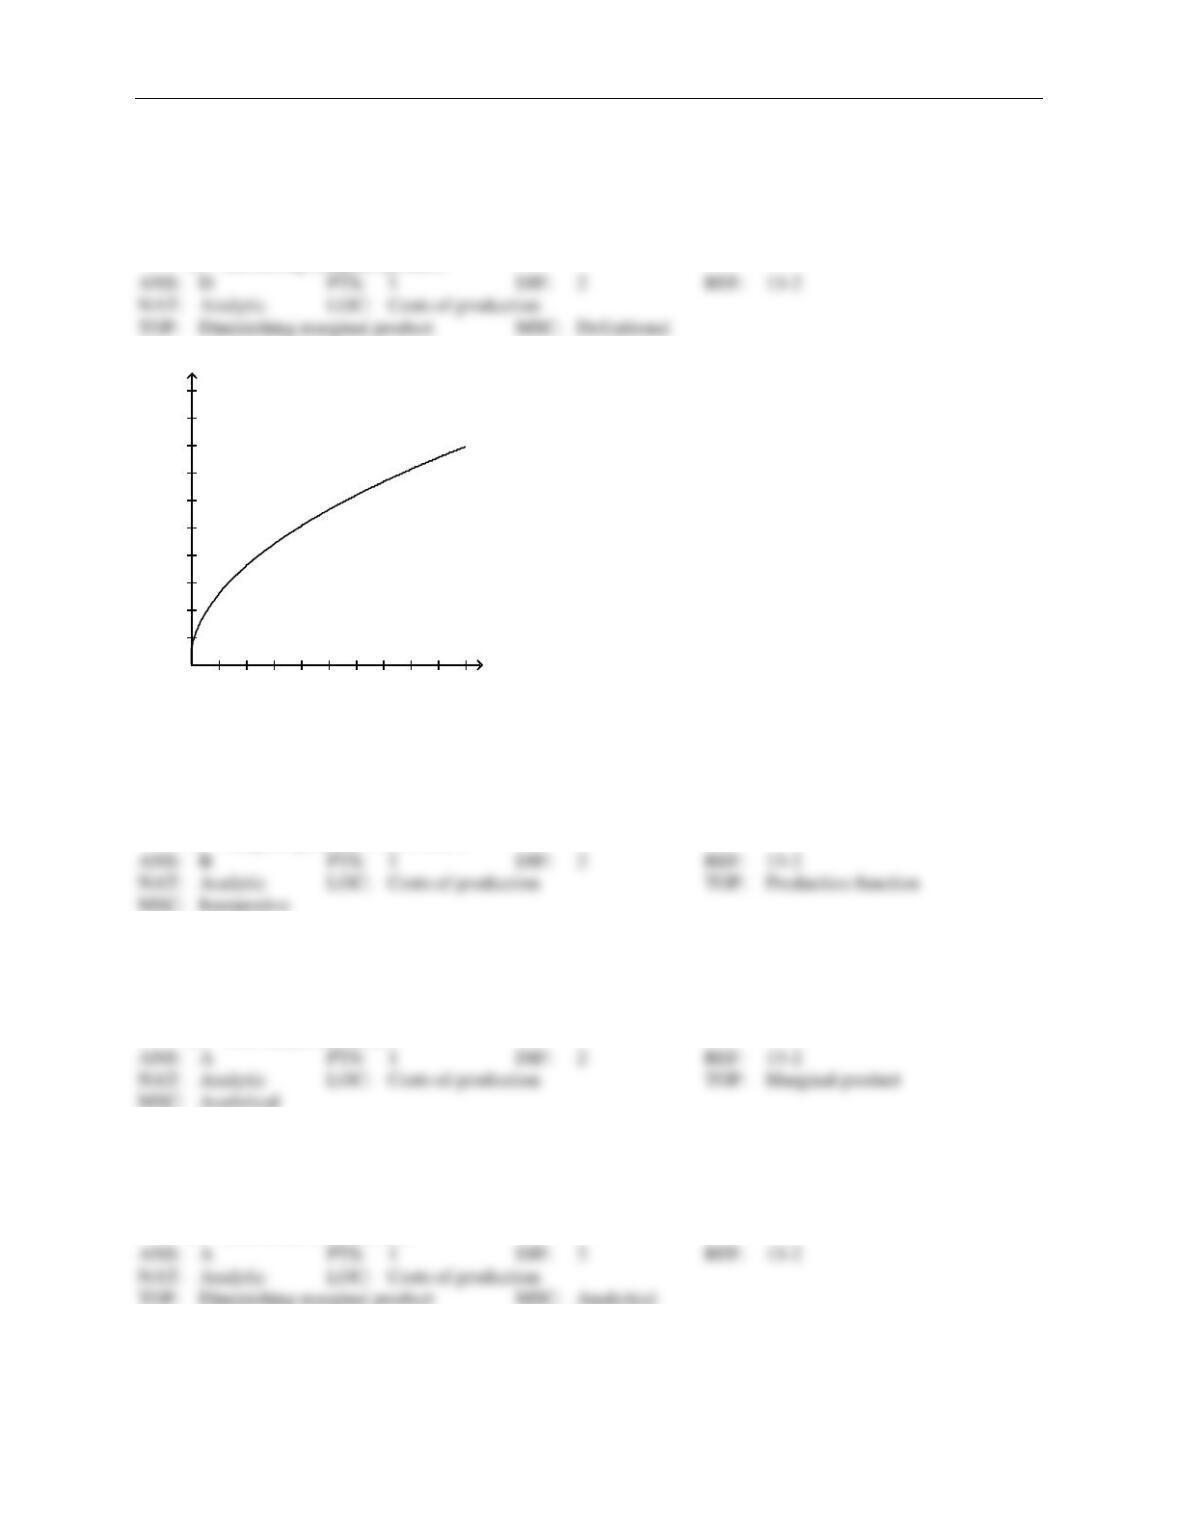
Figure 13-2
48. Refer to Figure 13-2. The graph illustrates a typical
a.
total-cost curve.
b.
production function.
c.
production possibilities frontier.
d.
marginal product of labor curve.
49. Refer to Figure 13-2. As the number of workers increases,
a.
total output increases but at a decreasing rate.
b.
marginal product increases but at a decreasing rate.
c.
marginal product increases at an increasing rate.
d.
total output decreases.
50. Refer to Figure 13-2. As the number of workers increases,
a.
marginal product decreases.
b.
total output decreases.
c.
marginal product increases but at a decreasing rate.
d.
Both a and b are correct.
1 2 3 4 5 6 7 8 W orkers
10
20
30
40
50
60
70
80
90
100 Output
Chapter 13/The Costs of Production ❖ 33
51. Refer to Figure 13-2. If the figure represented production at a cookie factory, the factory would be experienc-
ing
a.
diminishing marginal product of workers.
b.
diminishing marginal cost of cookie production.
c.
decreasing cost of cookie production.
d.
decreasing output of cookies.
52. Refer to Figure 13-2. The graph illustrates a typical production function. Based on its shape, what does the
corresponding total cost curve look like?
a.
an upward-sloping curve that increases at an increasing rate
b.
an upward-sloping curve that increases at a decreasing rate
c.
a downward-sloping curve
d.
a horizontal straight line
Table 13-4
Charles’s Math Tutoring
Number of
Workers
Output (number
of students tutored per
week)
0
0
1
20
2
45
3
60
4
70
53. Refer to Table 13–4. What is the marginal product of the second worker?
a.
15 students
b.
20 students
c.
22.5 students
d.
25 students
54. Refer to Table 13–4. What is the marginal product of the third worker?
a.
15 students
b.
20 students
c.
35 students
d.
60 students
34 ❖ Chapter 13/The Costs of Production
55. Refer to Table 13–4. Charles’s math tutoring company experiences diminishing marginal productivity with
the addition of the
a.
first worker.
b.
second worker.
c.
third worker.
d.
fourth worker.
56. Refer to Table 13–4. Suppose that Charles’s math tutoring company has a fixed cost of $50 per month for his
cell phone. Each worker costs Charles $60 per day. As output increases from 0 to 45 students, Charles’s total
cost curve
a.
increases but gets flatter.
b.
increases and gets steeper.
c.
decreases and gets flatter.
d.
decreases but gets steeper.
57. Refer to Table 13–4. Suppose that Charles’s math tutoring company has a fixed cost of $50 per month for his
cell phone. Each worker costs Charles $60 per day. As output increases from 45 to 70 students, Charles’s
total cost curve
a.
increases but gets flatter.
b.
increases and gets steeper.
c.
decreases and gets flatter.
d.
decreases but gets steeper.
Table 13-5
Number of
Workers
Output
0
0
1
1,000
2
2,000
3
2,700
4
3,200
5
3,500
6
3,600
58. Refer to Table 13-5. The marginal product of the third worker is
a.
1,000 units.
b.
900 units.
c.
700 units.
d.
500 units.
Chapter 13/The Costs of Production ❖ 35
59. Refer to Table 13-5. The marginal product of the fourth worker is
a.
900 units.
b.
800 units.
c.
700 units.
d.
500 units.
60. Refer to Table 13-5. Diminishing marginal product begins with the addition of the
a.
second worker.
b.
third worker.
c.
fourth worker.
d.
fifth worker.
61. Refer to Table 13-5. Assume that fixed costs are $500, and variable costs are $100 per worker. For this firm,
what are the shapes of the production function and the total-cost curve?
a.
Both the production function and total-cost curve are increasing at an increasing rate.
b.
Both the production function and total-cost curve are increasing at a decreasing rate.
c.
The production function is increasing at a decreasing rate, whereas the total-cost function is
increasing at an increasing rate.
d.
The production function is increasing at an increasing rate, whereas the total-cost function is
increasing at a decreasing rate.
Table 13-6
Wooden Chair Factory
Number
of
Workers
Number
of
Machines
Output
(chairs
produced
per hour)
Marginal
Product of
Labor
Cost of
Workers
Cost of
Machines
Total
Cost
1
2
5
2
2
10
3
2
20
4
2
35
5
2
55
6
2
70
7
2
80
62. Refer to Table 13-6. Each worker at the Wooden Chair Factory costs $12 per hour. The cost of each machine
is $20 per day regardless of the number of chairs produced. If the factory produces at a rate of 70 chairs per
hour and operates 8 hours per day, what is the factory’s total labor cost per day?
a.
$72
b.
$112
c.
$576
d.
$616
36 ❖ Chapter 13/The Costs of Production
63. Refer to Table 13-6. Each worker at the Wooden Chair Factory costs $12 per hour. The cost of each machine
is $20 per day regardless of the number of chairs produced. What is the total daily cost of producing at a rate
of 55 chairs per hour if the factory operates 8 hours per day?
a.
$480
b.
$576
c.
$520
d.
$616
64. Refer to Table 13-6. Each worker at the Wooden Chair Factory costs $12 per hour. The cost of each machine
is $20 per day regardless of the number of chairs produced. Assume the number of machines does not change.
If the factory produces at a rate of 78 chairs per hour, what is the total machine cost per day?
a.
$20
b.
$40
c.
$240
d.
We are unable to determine total machine costs from the information given.
65. Refer to Table 13-6. Each worker at the Wooden Chair Factory costs $12 per hour. The cost of each machine
is $20 per day regardless of the number of chairs produced. If the factory produces at a rate of 35 chairs per
hour, what is the total labor cost per hour?
a.
$40
b.
$48
c.
$384
d.
$424
66. Refer to Table 13-6. Assume the Wooden Chair Factory currently employs 5 workers. What is the marginal
product of labor when the factory adds a 6th worker?
a.
5 chairs per hour
b.
15 chairs per hour
c.
25 chairs per hour
d.
70 chairs per hour
67. Refer to Table 13-6. Assume the Wooden Chair Factory currently employs 2 workers. What is the marginal
product of labor when the factory adds a 3rd worker?
a.
5 chairs per hour
b.
10 chairs per hour
c.
20 chairs per hour
d.
25 chairs per hour
Chapter 13/The Costs of Production ❖ 37
68. Refer to Table 13-6. The Wooden Chair Factory experiences diminishing marginal product of labor with the
addition of which worker?
a.
the third worker
b.
the fourth worker
c.
the fifth worker
d.
the sixth worker
Figure 13-3
69. Refer to Figure 13-3. The graph illustrates a typical
a.
total-cost curve.
b.
production function.
c.
production possibilities frontier.
d.
fixed-cost curve.
70. Refer to Figure 13-3. The graph illustrates a typical total cost curve. Based on its shape, what does the cor-
responding production function look like?
a.
an upward-sloping curve that increases at an increasing rate
b.
an upward-sloping curve that increases at a decreasing rate
c.
a downward-sloping curve
d.
a horizontal straight line
2 4 6 8 10 12 14 16 Quantity
10
20
30
40
50
60
70
80
90
100 Cost
38 ❖ Chapter 13/The Costs of Production
71. Refer to Figure 13-3. Which of the following is true of the production function (not pictured) that underlies
this total cost function?
(i)
Total output increases as the quantity of inputs increases but at a decreasing rate.
(ii)
Marginal product is diminishing for all levels of input usage.
(iii)
The slope of the production function decreases as the quantity of inputs increases.
a.
(i) only
b.
(ii) and (iii) only
c.
(i) and (iii) only
d.
(i), (ii), and (iii)
72. Refer to Figure 13-3. The changing slope of the total cost curve reflects
a.
decreasing average variable cost.
b.
decreasing average total cost.
c.
decreasing marginal product.
d.
increasing fixed cost.
73. Refer to Figure 13-3. Which of the following statements best captures the nature of the underlying production
function (not pictured)?
a.
Output increases at a decreasing rate with additional units of input.
b.
Output increases at an increasing rate with additional units of input.
c.
Output decreases at a decreasing rate with additional units of input.
d.
Output decreases at an increasing rate with additional units of input.
74. Refer to Figure 13-3. Assuming that the firm depicted produces cookies, which of the statements below is
most consistent with the shape of the total cost curve?
a.
Producing an additional cookie is always more costly than producing the previous cookie.
b.
Total production of cookies decreases with additional units of input.
c.
Producing additional cookies is equally costly, regardless of how many cookies are already being
produced.
d.
Producing additional cookies becomes increasingly costly only when the number of cookies already
Scenario 13–12
If Farmer Brown plants no seeds on his farm, he gets no harvest. If he plants 1 bag of seeds, he gets 5 bushels
of wheat. If he plants 2 bags, he gets 9 bushels. If he plants 3 bags, he gets 12 bushels. A bag of seeds costs
$120, and seeds are his only cost.
75. Refer to Scenario 13-12. Farmer Brown’s production function exhibits
a.
increasing marginal product.
b.
constant marginal product.
c.
diminishing marginal product.
d.
The production function is unrelated to the marginal product.
Chapter 13/The Costs of Production ❖ 39
76. Refer to Scenario 13–12. Farmer Brown’s total-cost curve is
a.
increasing at an increasing rate.
b.
increasing at a decreasing rate.
c.
increasing at a constant rate.
d.
decreasing.
Scenario 13–13
Joan grows pumpkins. If Joan plants no seeds on her farm, she gets no harvest. If she plants 1 bag of seeds,
she gets 500 pumpkins. If she plants 2 bags, she gets 800 pumpkins. If she plants 3 bags, she gets 900
pumpkins. A bag of seeds costs $100, and seeds are her only cost.
77. Refer to Scenario 13-13. Joan’s production function exhibits
a.
increasing marginal product.
b.
decreasing marginal product.
c.
constant marginal product.
d.
Any of the above could be correct.
78. Refer to Scenario 13-13. Joan’s total-cost curve is
a.
increasing at an increasing rate.
b.
increasing at a decreasing rate.
c.
increasing at a constant rate.
d.
decreasing.
79. Which of the following statements about a production function is correct for a firm that uses labor to produce
output?
a.
The production function depicts the relationship between the quantity of labor and the quantity of
output.
b.
The slope of the production function measures marginal product.
c.
The slopes of the production function and the total cost curve are inversely related; if one is
increasing, the other is decreasing.
d.
All of the above are correct.
80. A total-cost curve shows the relationship between the
a.
quantity of an input used and the total cost of production.
b.
quantity of output produced and the total cost of production.
c.
total cost of production and profit.
d.
total cost of production and total revenue.
40 ❖ Chapter 13/The Costs of Production
81. If the total cost curve gets steeper as output increases, the firm is experiencing
a.
diseconomies of scale.
b.
economies of scale.
c.
diminishing marginal product.
d.
increasing marginal product.
82. David’s firm experiences diminishing marginal product for all ranges of inputs. The total cost curve associ-
ated with David’s firm
a.
gets flatter as output increases.
b.
gets steeper as output increases.
c.
is constant for all ranges of output.
d.
is unrelated to the production function.
THE VARIOUS MEASURES OF COST
1. Some costs do not vary with the quantity of output produced. Those costs are called
a.
marginal costs.
b.
average costs.
c.
fixed costs.
d.
explicit costs.
2. Which of the following costs do not vary with the amount of output a firm produces?
a.
average fixed costs
b.
fixed costs and average fixed costs
c.
marginal costs and average fixed costs
d.
fixed costs
3. Fixed costs can be defined as costs that
a.
vary inversely with production.
b.
vary in proportion with production.
c.
are incurred only when production is large enough.
d.
are incurred even if nothing is produced.
4. In the short run, a firm incurs fixed costs
a.
only if it incurs variable costs.
b.
only if it produces no output.
c.
only if it produces a positive quantity of output.
d.
whether it produces output or not.