d.
$360
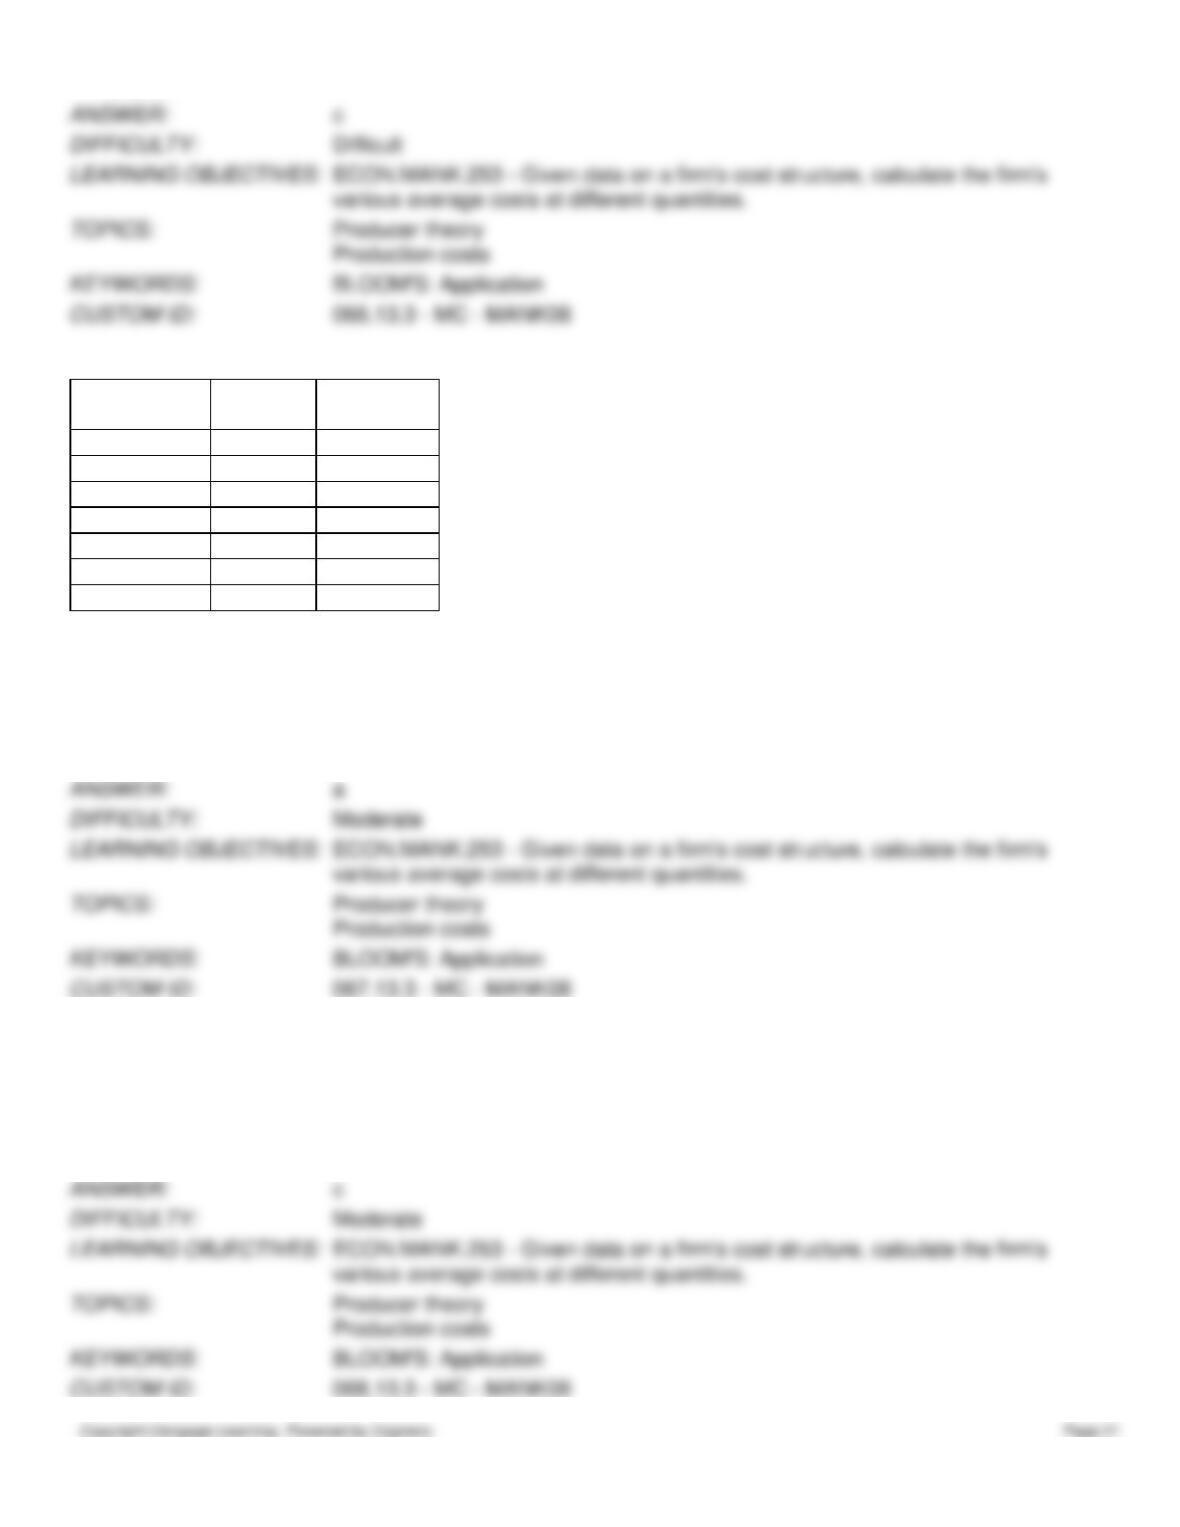
Table 13-8
Quantity
of Output
Fixed
Cost
Variable
Cost
0
$20
$0
1
$20
$10
2
$20
$40
3
$20
$80
4
$20
$130
5
$20
$200
6
$20
$300
67. Refer to Table 13–8. What is the average fixed cost of producing 5 units of output?
a.
$4
b.
$5
c.
$40
d.
$44
68. Refer to Table 13–8. What is the average variable cost of producing 5 units of output?
a.
$4
b.
$5
c.
$40
d.
$44
69. Refer to Table 13–8. What is the marginal cost of producing the fifth unit of output?
a.
$4
b.
$40
c.
$50
d.
$70
70. Refer to Table 13–8. What is the shape of the marginal cost curve for this firm?
a.
constant
b.
upward-sloping
c.
downward-sloping
d.
U-shaped
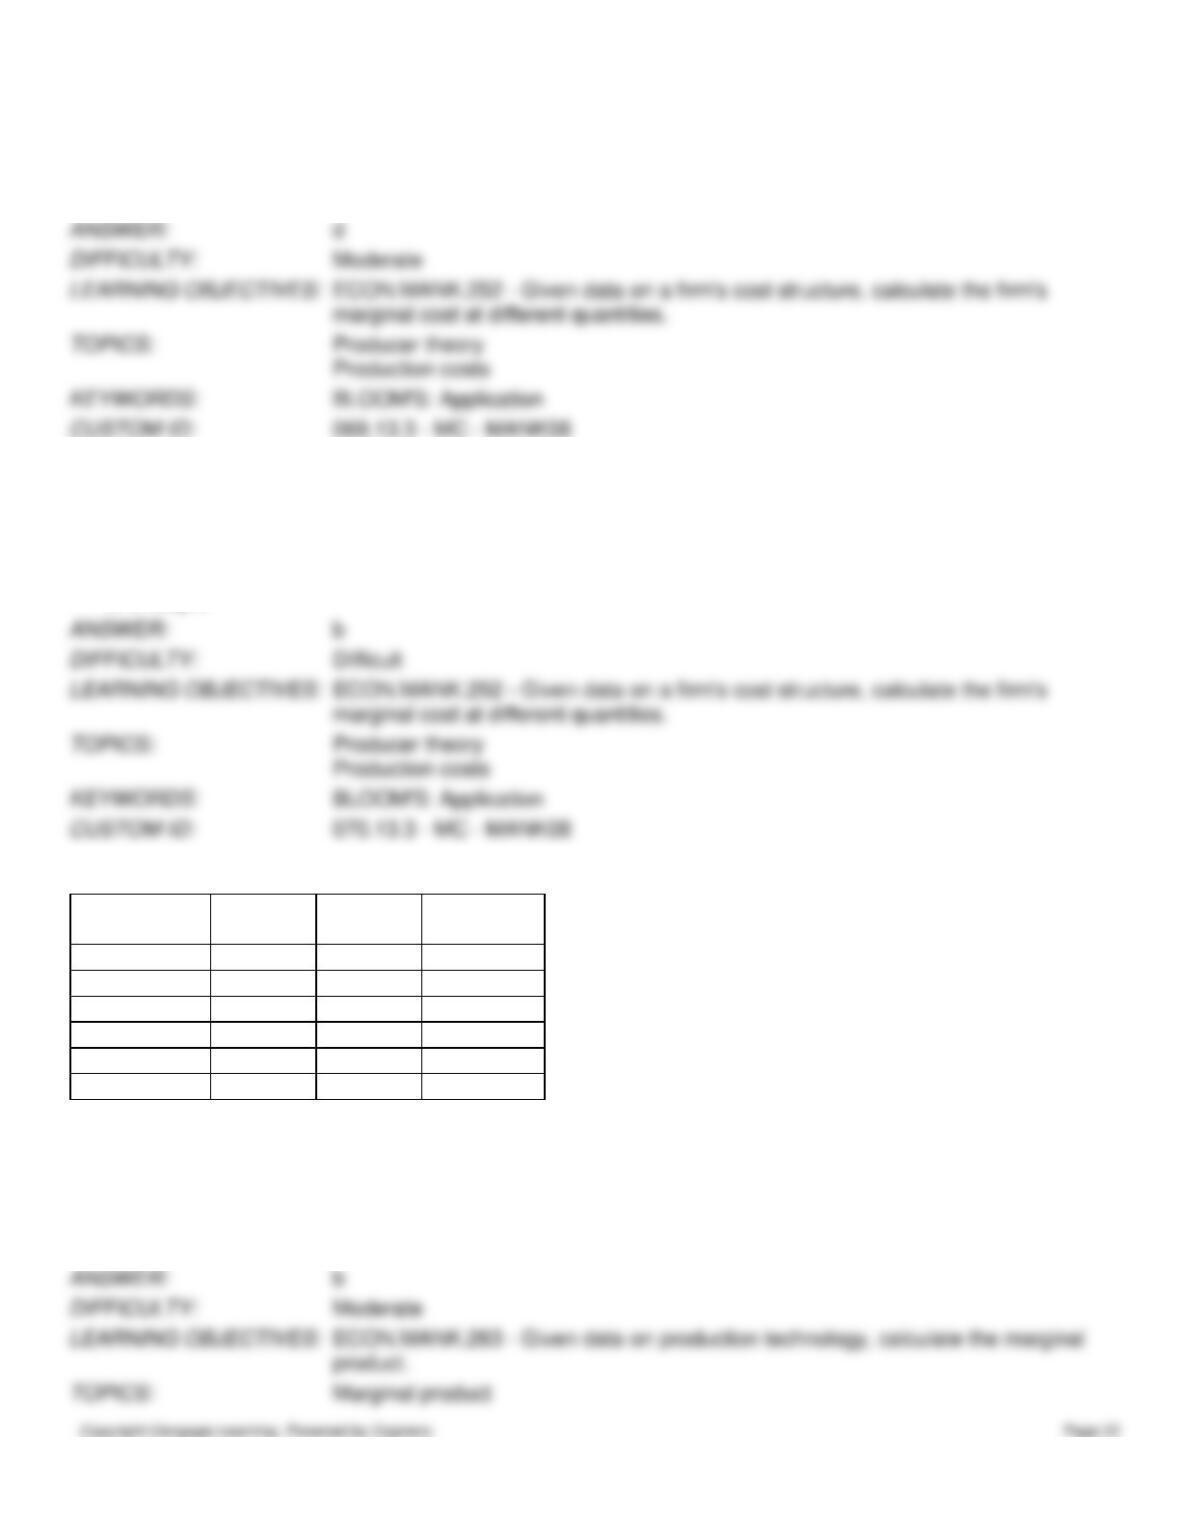
Table 13-9
Number of
Workers
Output
Fixed
Cost
Variable
Cost
0
0
$30
$0
1
100
$30
$15
2
180
$30
$30
3
240
$30
$45
4
280
$30
$60
5
300
$30
$75
71. Refer to Table 13–9. What is the marginal product of the third worker?
a.
80 units
b.
60 units
c.
40 units
d.
20 units
72. Refer to Table 13–9. The marginal products of hiring additional workers are
a.
increasing at an increasing rate.
b.
increasing at a decreasing rate.
c.
decreasing.
d.
constant.
73. Refer to Table 13–9. For the firm whose production function and costs are specified in the table, its total-cost curve is
a.
constant.
b.
increasing at a decreasing rate.
c.
increasing at an increasing rate.
d.
unknown because there is no relationship between a firm’s production function and its total-cost curve.
74. Refer to Table 13–9. The average variable cost of producing 240 units is
a.
$0.13.
b.
$0.19.
c.
$0.32.
d.
$0.80.
75. Refer to Table 13–9. The average total cost of producing 240 units is
a.
$0.13.
b.
$0.19.
c.
$0.32.
d.
$0.80.
76. Refer to Table 13–9. For the firm whose production function and costs are specified in the table, its average-variable-
cost curve is
a.
constant.
b.
decreasing.
c.
increasing.
d.
U-shaped.
77. Refer to Table 13–9. For the firm whose production function and costs are specified in the table, its average-total-cost
curve is
a.
constant.
b.
decreasing.
c.
increasing.
d.
U-shaped.
Table 13–10
Number of
Workers
Output
Fixed
Cost
Variable
Cost
0
0
$15
$0
1
100
$15
$30
2
180
$15
$60
3
240
$15
$90
4
280
$15
$120
5
300
$15
$150
78. Refer to Table 13–10. What is the marginal product of the fourth worker?
a.
80 units
b.
60 units
c.
40 units
d.
20 units
79. Refer to Table 13–10. The average variable cost of producing 240 units of output is
a.
$0.06.
b.
$0.38.
c.
$0.44.
d.
$30.
80. Refer to Table 13–10. What is the marginal cost of producing 280 units of output?
a.
$0.48
b.
$0.75
c.
$30
d.
$40
81. Refer to Table 13–10. The average total cost of producing 240 units is
a.
$0.06.
b.
$0.38.
c.
$0.44.
d.
$30.
Table 13–11
Measures of Cost for Very Brady Poster Factory
Quantity
of Posters
Variable
Costs
Total
Costs
Fixed
Costs
0
$10
1
$1
2
$3
$13
3
$6
$16
4
$10
5
$25
6
$21
$10
82. Refer to Table 13–11. The average fixed cost of producing 5 posters is
a.
$1.
b.
$2.
c.
$3.
d.
$5.
83. Refer to Table 13–11. The average variable cost of producing 4 posters is
a.
$2.00.
b.
$2.50.
c.
$3.33.
d.
$5.00.
84. Refer to Table 13–11. The total cost of producing 1 poster is
a.
$1.
b.
$10.
c.
$11.
d.
$22.
85. Refer to Table 13–11. The marginal cost of producing the 6th poster is
a.
$1.00.
b.
$3.50.
c.
$5.00.
d.
$6.00.
86. Refer to Table 13–11. What is the variable cost of producing 0 posters?
a.
$0
b.
$1
c.
$10
d.
$100
87. Refer to Table 13–11. What is the marginal cost of producing the 1st poster?
a.
$1
b.
$10
c.
$11
d.
It can’t be determined from the information given.
88. Refer to Table 13–11. What is the variable cost of producing 5 posters?
a.
$13
b.
$14
c.
$15
d.
It can’t be determined from the information given.
Table 13–12
Eileen’s Elegant Earrings produces pairs of earrings for its mail order catalogue business. Each pair is shipped in a
separate box. She rents a small room for $150 a week in the downtown business district that serves as her factory. She can
hire workers for $275 a week. There are no implicit costs.
Number of
Workers
Boxes of
Earrings
Produced per
Week
Marginal
Product
of Labor
Cost of
Factory
Cost
of
Workers
Total Cost
of
Inputs
0
0
1
330
$150
$275
$425
2
630
3
150
$825
$975
4
890
5
950
60
$1,375
6
10
$1,800
89. Refer to Table 13–12. What is the marginal product of the second worker?
a.
110
b.
200
c.
260
d.
300
90. Refer to Table 13–12. What is the total cost associated with making 890 boxes of earrings per week?
a.
$1,250
b.
$1,325
c.
$1,400
d.
$1,575
91. Refer to Table 13–12. During the week of July 4th, Eileen doesn’t produce any earrings. What are her costs during the
week?
a.
$0
b.
$150
c.
$275
d.
$425
92. Refer to Table 13–12. One week, Eileen earns a profit of $125. If her revenue for the week is $1100, how many boxes
of earrings did she produce?
a.
140
b.
330
c.
780
d.
950
93. Refer to Table 13–12. Eileen has received an order for 3,000 boxes of earrings for next week. If she expects that the
trend in the marginal product of labor will continue in the same direction, it is most likely that her best decision will be to
a.
not commit to meeting the order until she can move to a larger room and hire more workers to produce the
earrings.
b.
close her business until she is able to hire more productive workers.
c.
hire about 12 new workers and hope she can satisfy the order.
d.
commit to meeting the order and then take three weeks to complete the job.
Table 13–13
Teacher’s Helper is a small company that has a subcontract to produce instructional materials for disabled children in
public school districts. The owner rents several small rooms in an office building in the suburbs for $600 a month and has
leased computer equipment that costs $480 a month.
Output
(Instructional
Modules
per Month)
Fixed
Costs
Variable
Costs
Total
Cost
Average
Fixed
Cost
Average
Variable
Cost
Average
Total
Cost
Marginal
Cost
0
$1,080
1
$1,080
$ 400
$1,480
$400
2
$965
$450
3
$1,350
$2,430
4
$1,900
$475
5
$2,500
$216
6
$4,280
$700
7
$4,100
8
$5,400
$135
9
$7,300
10
$10,880
$980
94. Refer to Table 13–13. What is the marginal cost of creating the tenth instructional module in a given month?
a.
$900
b.
$1,250
c.
$2,500
d.
$3,060
95. Refer to Table 13–13. What is the average variable cost for the month if 6 instructional modules are produced?
a.
$180.00
b.
$533.33
c.
$700.00
d.
$713.33
96. Refer to Table 13–13. What is the average fixed cost for the month if 9 instructional modules are produced?
a.
$108.00
b.
$120.00
c.
$150.00
d.
$811.11
97. Refer to Table 13–13. How many instructional modules are produced when marginal cost is $1,300?
a.
4
b.
5
c.
7
d.
8
98. Refer to Table 13–13. One month, Teacher’s Helper produced 18 instructional modules. What was the average fixed
cost for that month?
a.
$60
b.
$108
c.
$811
d.
It can’t be determined from the information given.
Table 13–14
Quantity
of
Output
Fixed
Cost
Variable
Cost
Total
Cost
Average
Fixed
Cost
Average
Variable
Cost
Average
Total
Cost
Marginal
Cost
1
$23
$33
2
$38
3
$70
4
$64
5
$110
6
$118
7
$143
8
$185
99. Refer to Table 13–14. What is the fixed cost of production for this firm?
a.
$10
b.
$20
c.
$23
d.
$33
100. Refer to Table 13-14. What is the variable cost of producing 5 units of output?
a.
$10
b.
$20
c.
$100
d.
$110
101. Refer to Table 13-14. What is the variable cost of producing 8 units of output?
a.
$143
b.
$153
c.
$175
d.
$185
102. Refer to Table 13-14. What is the total cost of producing 2 units of output?
a.
$10
b.
$15
c.
$38
d.
$48
103. Refer to Table 13-14. What is the total cost of producing 7 units of output?
a.
$10
b.
$143
c.
$153
d.
$185
104. Refer to Table 13-14. What is the average variable cost of producing 3 units of output?
a.
$20
b.
$30
c.
$35
d.
$60
105. Refer to Table 13-14. What is the average variable cost of producing 6 units of output?
a.
$1.67
b.
$18
c.
$19.67
d.
$21.33
106. Refer to Table 13-14. What is the average fixed cost of producing 3 units of output?
a.
$1.67
b.
$3.33
c.
$10
d.
$20
107. Refer to Table 13-14. What is the average fixed cost of producing 8 units of output?
a.
$1.25
b.
$3.13
c.
$20.00
d.
$24.37
108. Refer to Table 13-14. What is the average total cost of producing 2 units of output?
a.
$15
b.
$19
c.
$24
d.
$48
109. Refer to Table 13-14. What is the average total cost of producing 6 units of output?
a.
$19.67
b.
$20.00
c.
$21.33
d.
$21.86
110. Refer to Table 13-14. What is the marginal cost of the 2nd unit of output?
a.
$10
b.
$15
c.
$24
d.
$38
111. Refer to Table 13-14. What is the marginal cost of the 4th unit of output?
a.
$4
b.
$10
c.
$14
d.
$16
112. Refer to Table 13-14. What is the marginal cost of the 8th unit of output?
a.
$20.00
b.
$21.86
c.
$23.13
d.
$32.00
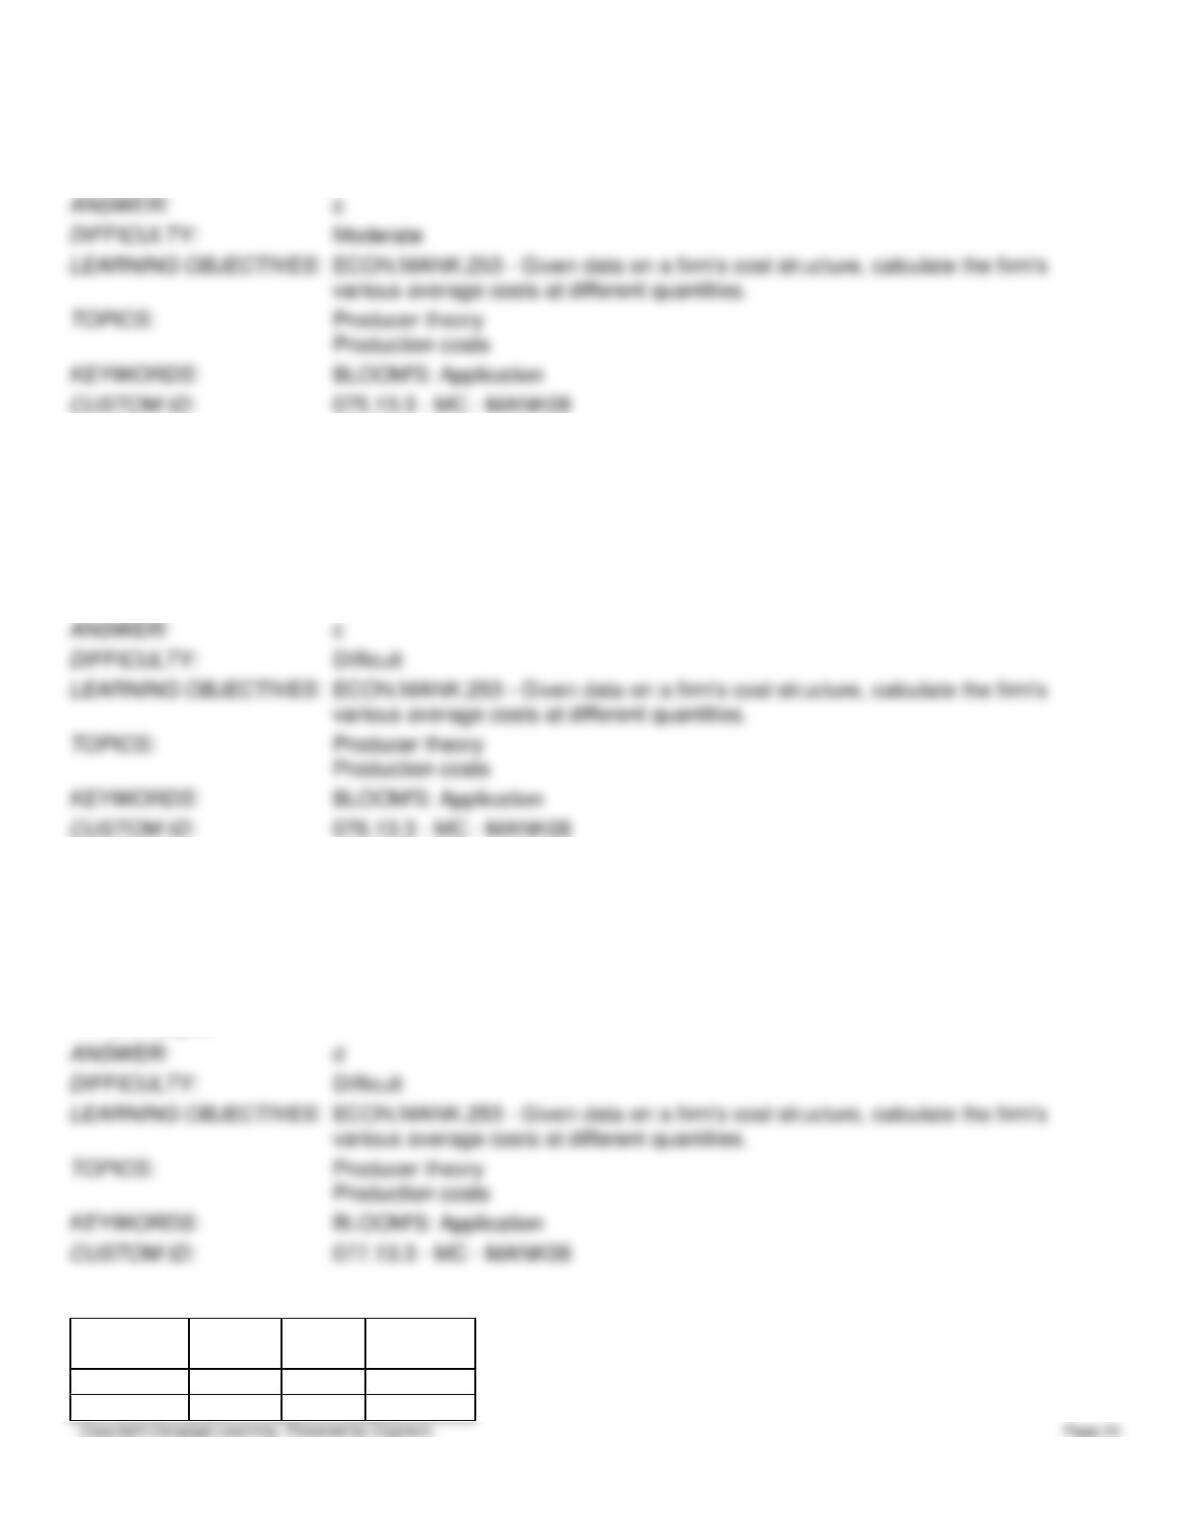
Table 13–15
Output
Total Cost
0
$40
10
$60
20
$90
30
$130
40
$180
50
$240
113. Refer to Table 13–15. What is the total fixed cost for this firm?
a.
$20
b.
$30
c.
$40
d.
$50
114. Refer to Table 13–15. What is average fixed cost when output is 40 units?
a.
$1.00
b.
$3.32
c.
$5.00
d.
$8.00
115. Refer to Table 13–15. What is average variable cost when output is 50 units?
a.
$3.60
b.
$4.00
c.
$4.40
d.
$4.80
116. Refer to Table 13–15. What is variable cost when output equals 30 units?
a.
$4
b.
$40
c.
$90
d.
$130
Scenario 13–16
Barney builds custom wooden birdhouses. He can make 150 birdhouses per month and sell them for $50 each. His
average total cost is $30 per birdhouse.
117. Refer to Scenario 13–16. Barney’s monthly total revenue is
a.
$12,000.
b.
$7,500.
c.
$4,500.
d.
$1,500.
118. Refer to Scenario 13–16. Barney is considering hiring his best friend Fred to work for him. Fred can build 125
birdhouses per month. If Barney hires Fred, what will be the monthly total output of his birdhouse business?
a.
25 birdhouses
b.
125 birdhouses
c.
150 birdhouses
d.
275 birdhouses
119. Refer to Scenario 13–16. Barney is considering hiring his best friend Fred to work for him. Fred can build 125
birdhouses per month. If Barney hires Fred, what will be the monthly marginal product?
a.
25 birdhouses
b.
125 birdhouses
c.
150 birdhouses
d.
275 birdhouses
120. Refer to Scenario 13–16. Barney’s monthly total profit is
a.
$1,500.
b.
$3,000.
c.
$4,500.
d.
$7,500.
Scenario 13–17
If Farmer Brown plants no seeds on his farm, he gets no harvest. If he plants 1 bag of seeds, he gets 5 bushels of wheat. If
he plants 2 bags, he gets 9 bushels. If he plants 3 bags, he gets 12 bushels. A bag of seeds costs $120, and seeds are his
only cost.
121. Refer to Scenario 13–17. Farmer Brown’s marginal-cost curve is
a.
increasing.
b.
decreasing.
c.
constant.
d.
U-shaped.
122. Refer to Scenario 13–17. Farmer Brown’s marginal cost of producing 9 units of output (using 2 bags of seed) is
a.
$240.
b.
$120.
c.
$40.
d.
$30.
Scenario 13–18
Farmer Jack is a watermelon farmer. If Jack plants no seeds on his farm, he gets no harvest. If he plants 1 bag of seeds, he
gets 30 watermelons. If he plants 2 bags of seeds, he gets 50 watermelons. If he plants 3 bags of seeds he gets 60
watermelons. A bag of seeds costs $100, and the costs of seeds are his only costs.
123. Refer to Scenario 13–18. Which of the following statements is (are) true?
(i)
Farmer Jack experiences decreasing marginal product.
(ii)
Farmer Jack’s production function is nonlinear.
(iii)
Farmer Jack’s total cost curve is linear.
a.
(i) only
b.
(i) and (ii) only
c.
(ii) only
d.
(i) and (iii) only
124. Refer to Scenario 13–18. Farmer Jack’s marginal cost
(i)
curve is U-shaped.
(ii)
decreases with increased watermelon output.
(iii)
reflects diminishing marginal product.
a.
(ii) only
b.
(iii) only
c.
(i) and (iii) only
d.
(i) and (ii) only
125. Refer to Scenario 13–18. Farmer Jack’s production function will
a.
decrease at a decreasing rate.
b.
decrease at an increasing rate.
c.
increase at a decreasing rate.
d.
increase at an increasing rate.
126. Refer to Scenario 13–18. What is the shape of Farmer Jack’s marginal cost curve?