Chapter 13/The Costs of Production ❖ 81
11. The long-run average total cost curve is always
a.
flatter than the short-run average total cost curve, but not necessarily horizontal.
b.
horizontal.
c.
falling as output increases.
d.
rising as output increases.
12. When comparing short-run average total cost with long-run average total cost at a given level of output,
a.
short-run average total cost is typically above long-run average total cost.
b.
short-run average total cost is typically the same as long-run average total cost.
c.
short-run average total cost is typically below long-run average total cost.
d.
the relationship between short-run and long-run average total cost follows no clear pattern.
13. Which of the following explains why long-run average cost at first decreases as output increases?
a.
diseconomies of scale
b.
less-efficient use of inputs
c.
fixed costs becoming spread out over more units of output
d.
gains from specialization of inputs
14. The most likely explanation for economies of scale is
a.
coordination problems.
b.
specialization of labor.
c.
increasing marginal cost.
d.
decreasing marginal cost.
15. When a firm is experiencing economies of scale, long-run
a.
average total cost is minimized.
b.
average total cost is greater than long-run marginal cost.
c.
average total cost is less than long-run marginal cost.
d.
marginal cost is minimized.
16. Economies of scale occur when a firm’s
a.
marginal costs are constant as output increases.
b.
long-run average total costs are decreasing as output increases.
c.
long-run average total costs are increasing as output increases.
d.
marginal costs are equal to average total costs for all levels of output.
82 ❖ Chapter 13/The Costs of Production
17. Economies of scale occur when
a.
long-run average total costs rise as output increases.
b.
long-run average total costs fall as output increases.
c.
average fixed costs are falling.
d.
average fixed costs are constant.
18. A firm that wants to achieve economies of scale could do so by
a.
assigning limited tasks to its employees, so they can master those tasks.
b.
employing a smaller number of workers.
c.
producing a smaller quantity of output.
d.
producing an output level higher than the efficient scale.
19. Economies of scale arise when
a.
an economy is self-sufficient in production.
b.
individuals in a society are self-sufficient.
c.
fixed costs are large relative to variable costs.
d.
workers are able to specialize in a particular task.
20. If long-run average total cost decreases as the quantity of output increases, the firm is experiencing
a.
economies of scale.
b.
diseconomies of scale.
c.
coordination problems arising from the large size of the firm.
d.
fixed costs greatly exceeding variable costs.
21. In the long run Firm A incurs total costs of $1,050 when output is 30 units and $1,200 when output is 40 units.
Firm A exhibits
a.
diseconomies of scale because total cost is rising as output rises.
b.
diseconomies of scale because average total cost is rising as output rises.
c.
economies of scale because total cost is rising as output rises.
d.
economies of scale because average total cost is falling as output rises.
22. In the long run Firm A incurs total costs of $1,200 when output is 30 units and $1,400 when output is 40 units.
Firm A exhibits
a.
diseconomies of scale because total cost is rising as output rises.
b.
diseconomies of scale because average total cost is rising as output rises.
c.
economies of scale because total cost is rising as output rises.
d.
economies of scale because average total cost is falling as output rises.
Chapter 13/The Costs of Production ❖ 83
23. Since the 1980s, Wal-Mart stores have appeared in almost every community in America. Wal-Mart buys its
goods in large quantities and, therefore, at cheaper prices. Wal-Mart also locates its stores where land prices
are low, usually outside of the community business district. Many customers shop at Wal-Mart because of low
prices. Local retailers, like the neighborhood drug store, often go out of business because they lose customers.
This story demonstrates that
a.
consumers do not react to changing prices.
b.
there are diseconomies of scale in retail sales.
c.
there are economies of scale in retail sales.
d.
there are diminishing returns to producing and selling retail goods.
24. Which of the following statements is not correct?
a.
In the long run, there are no fixed costs.
b.
Marginal cost is independent of fixed costs.
c.
Economies of scale is a short-run concept.
d.
Diminishing marginal product explains increasing marginal cost.
25. In the long run Al’s Sandwich Shop incurs total costs of $2,500 when output is 1,250 units and $3,000 when
output is 1,500 units. For this range of output, Al’s exhibits
a.
economies of scale.
b.
constant returns to scale.
c.
diseconomies of scale.
d.
efficient scale.
26. In the long run Irene’s Ice Cream Parlor incurs total costs of $2,500 when output is 1,250 units and $4,000
when output is 1,500 units. For this range of output, Irine’s exhibits
a.
economies of scale.
b.
constant returns to scale.
c.
diseconomies of scale.
d.
efficient scale.
27. In the long run Willie’s Chocolate Factory incurs total costs of $2,500 when output is 1,250 units and $2,750
when output is 1,500 units. For this range of output, Willie’s exhibits
a.
economies of scale.
b.
constant returns to scale.
c.
diseconomies of scale.
d.
efficient scale.
84 ❖ Chapter 13/The Costs of Production
28. At low levels of production, the firm
a.
benefits from increased size because it can take advantage of greater specialization.
b.
has the potential for economies of scale.
c.
is unlikely to experiences acute problems with coordination.
d.
All of the above are correct.
29. The Big Blue Sky jet company has long-run total costs of $20 million if it produces 5 jets and long-run total
costs of $24 million if it produces 6 jets. The Big Blue Sky jet company is experiencing
a.
economies of scale.
b.
constant returns to scale.
c.
diseconomies of scale.
d.
negative profits.
30. When a firm experiences constant returns to scale,
a.
long-run average total cost is unchanged, even when output increases.
b.
long-run marginal cost is greater than long-run average total cost.
c.
long-run marginal cost is less than long-run average total cost.
d.
the firm is likely to experience coordination problems.
31. Constant returns to scale occur when a firm’s
a.
marginal costs are constant as output increases.
b.
long-run average total costs are decreasing as output increases.
c.
long-run average total costs are increasing as output increases.
d.
long-run average total costs do not vary as output increases.
32. Constant returns to scale occur when the firm’s long-run
a.
total costs are constant as output increases.
b.
average total costs are constant as output increases.
c.
average cost curve is falling as output increases.
d.
average cost curve is rising as output increases.
33. If a firm experiences constant returns to scale at all output levels, then its long-run average total cost curve
would
a.
slope downward.
b.
be horizontal.
c.
slope upward.
d.
slope downward for low output levels and upward for high output levels.
Chapter 13/The Costs of Production ❖ 85
34. When a firm’s long–run average total costs do not vary as output increases, the firm exhibits
a.
economies of scale.
b.
constant returns to scale.
c.
diseconomies of scale.
d.
an efficient use of resources.
35. In the long run Firm A incurs total costs of $1,200 when output is 30 units and $1,600 when output is 40 units.
Firm A exhibits
a.
diseconomies of scale because total cost is rising as output rises.
b.
constant returns to scale because average total cost is constant as output rises.
c.
diseconomies of scale because average total cost is rising as output rises.
d.
economies of scale because average total cost is falling as output rises.
36. In the long run Firm A incurs total costs of $900 when output is 30 units and $1,200 when output is 40 units.
Firm A exhibits
a.
diseconomies of scale because total cost is rising as output rises.
b.
constant returns to scale because average total cost is constant as output rises.
c.
diseconomies of scale because average total cost is rising as output rises.
d.
economies of scale because average total cost is falling as output rises.
37. When a firm experiences diseconomies of scale,
a.
short-run average total cost is minimized.
b.
long-run average total cost is minimized.
c.
long-run average total cost increases as output increases.
d.
long-run average total cost decreases as output increases.
38. When a firm is experiencing diseconomies of scale, long-run
a.
average total cost is minimized.
b.
average total cost is greater than long-run marginal cost.
c.
average total cost is less than long-run marginal cost.
d.
marginal cost is minimized.
39. Diseconomies of scale occur when a firm’s
a.
marginal costs are constant as output increases.
b.
long-run average total costs are decreasing as output increases.
c.
long-run average total costs are increasing as output increases.
d.
marginal costs are equal to average total costs for all levels of output.
86 ❖ Chapter 13/The Costs of Production
40. Diseconomies of scale occur when
a.
average fixed costs are falling.
b.
average fixed costs are constant.
c.
long-run average total costs rise as output increases.
d.
long-run average total costs fall as output increases.
41. In the long run, when marginal cost is above average total cost, the average total cost curve exhibits
a.
economies of scale.
b.
diseconomies of scale.
c.
constant returns to scale.
d.
efficient scale.
42. In the long run Firm A incurs total costs of $1,200 when output is 30 units and $1,650 when output is 40 units.
Firm A exhibits
a.
diseconomies of scale because total cost is rising as output rises.
b.
diseconomies of scale because average total cost is rising as output rises.
c.
economies of scale because total cost is rising as output rises.
d.
economies of scale because average total cost is falling as output rises.
43. Firms may experience diseconomies of scale when
a.
they are too small to take advantage of specialization.
b.
large management structures are bureaucratic and inefficient.
c.
there are too few employees, and managers do not have enough to do.
d.
average fixed costs begin to rise again.
Chapter 13/The Costs of Production ❖ 87
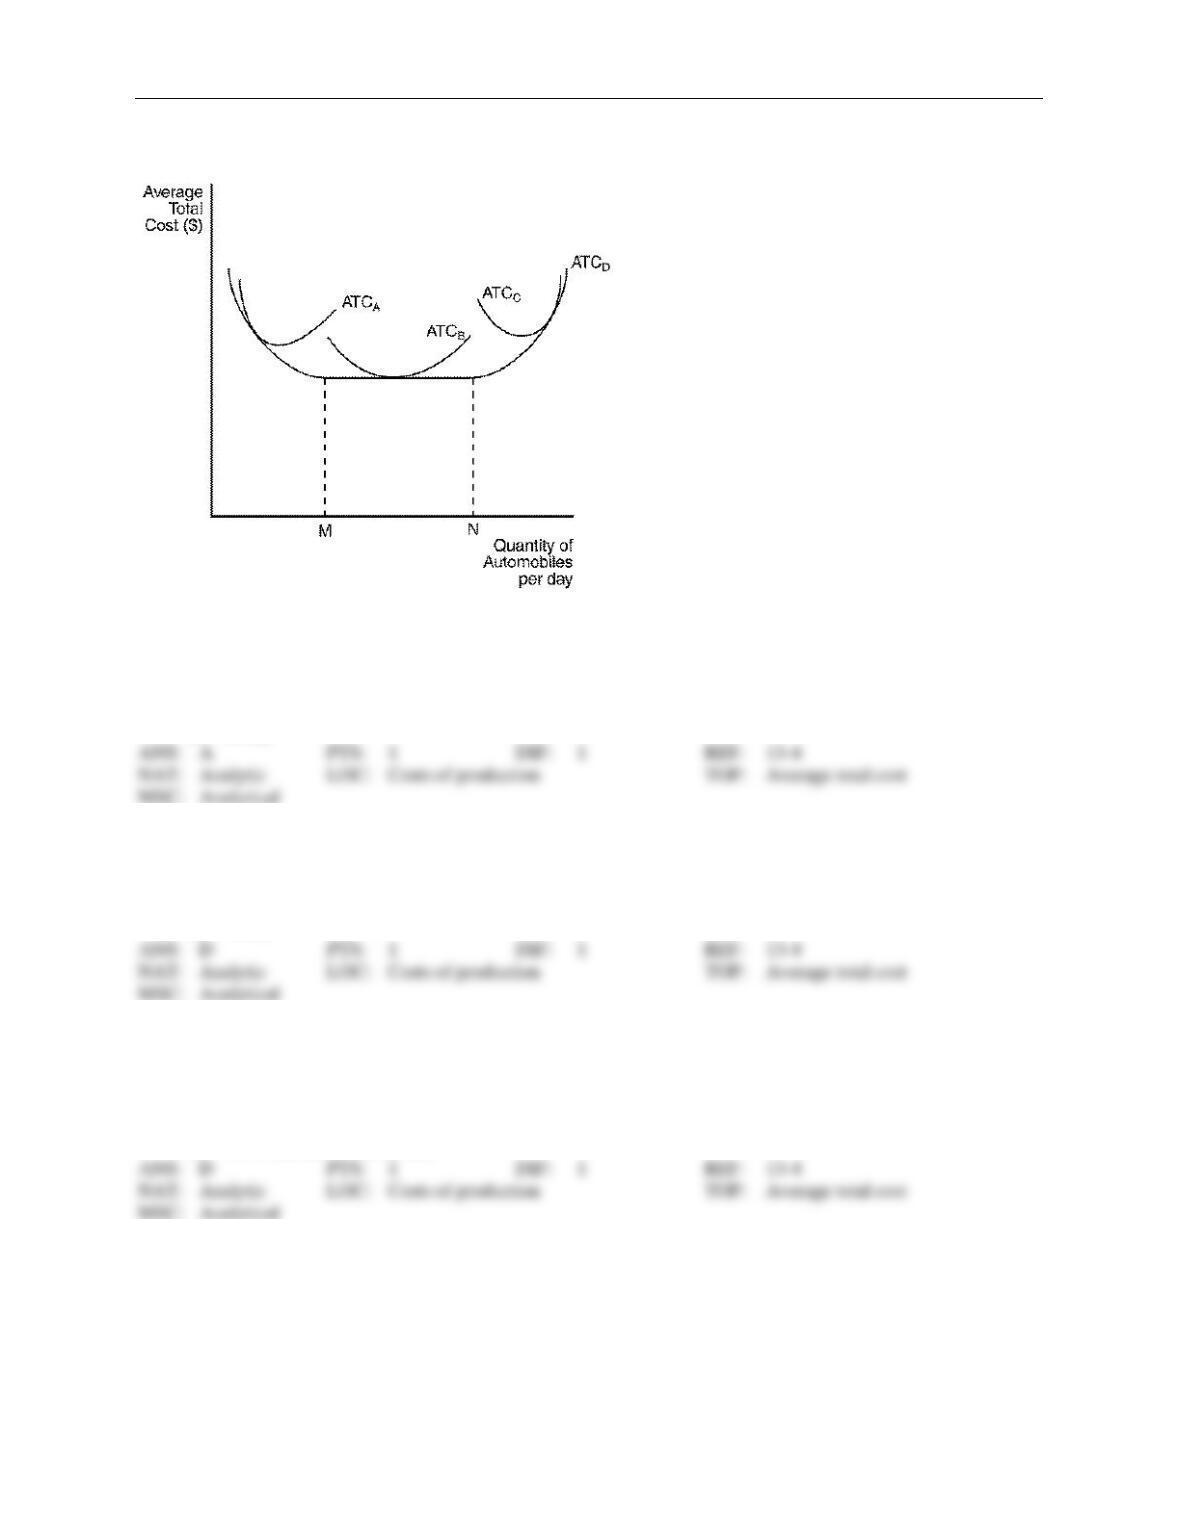
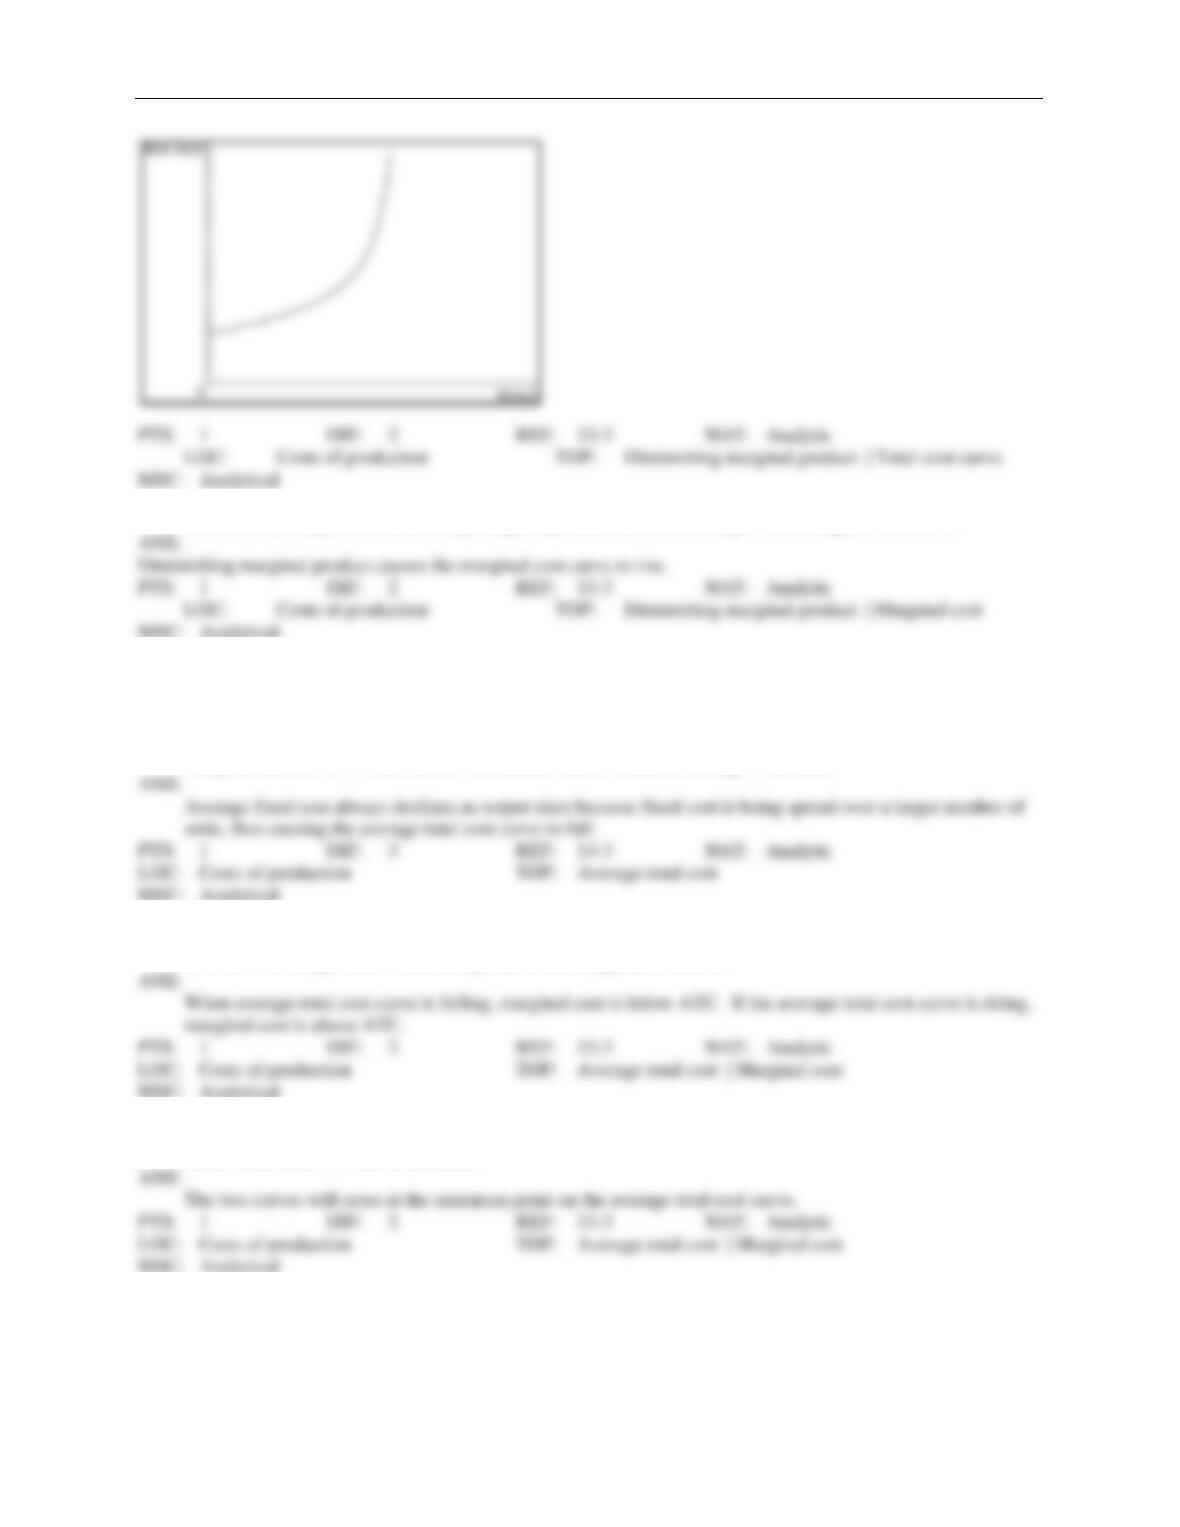
Figure 13-9
The figure below depicts average total cost functions for a firm that produces automobiles.
44. Refer to Figure 13-9. Which of the curves is most likely to characterize the short-run average total cost curve
of the smallest factory?
a.
ATCA
b.
ATCB
c.
ATCC
d.
ATCD
45. Refer to Figure 13-9. Which curve represents the long-run average total cost?
a.
ATCA
b.
ATCB
c.
ATCC
d.
ATCD
46. Refer to Figure 13-9. In the long run, the firm can operate on which of the following average total cost
curves?
a.
ATCA
b.
ATCB
c.
ATCC
d.
All of the above are correct.
88 ❖ Chapter 13/The Costs of Production
47. Refer to Figure 13-9. The firm experiences economies of scale at which output levels?
a.
output levels less than M
b.
output levels between M and N
c.
output levels greater than N
d.
All of the above are correct as long as the firm is operating in the long run.
48. Refer to Figure 13-9. At levels of output less than M, the firm experiences
a.
economies of scale.
b.
diseconomies of scale.
c.
constant returns to scale.
d.
both diminishing marginal productivity and coordination problems.
49. Refer to Figure 13-9. The firm experiences constant returns to scale at which output levels?
a.
output levels less than M
b.
output levels between M and N
c.
output levels greater than N
d.
All of the above are correct as long as the firm is operating in the long run.
50. Refer to Figure 13-9. At levels of output between M and N, the firm experiences
a.
economies of scale.
b.
diseconomies of scale.
c.
constant returns to scale.
d.
both the benefits of specialization and diminishing marginal productivity.
51. Refer to Figure 13-9. This firm experiences diseconomies of scale at what output levels?
a.
output levels greater than N
b.
output levels between M and N
c.
output levels less than M
d.
All of the above are correct as long as the firm is operating in the long run.
52. Refer to Figure 13-9. At output levels greater than N, the firm experiences
a.
economies of scale.
b.
constant returns to scale.
c.
diseconomies of scale.
d.
minimum efficient scale.
Chapter 13/The Costs of Production ❖ 89
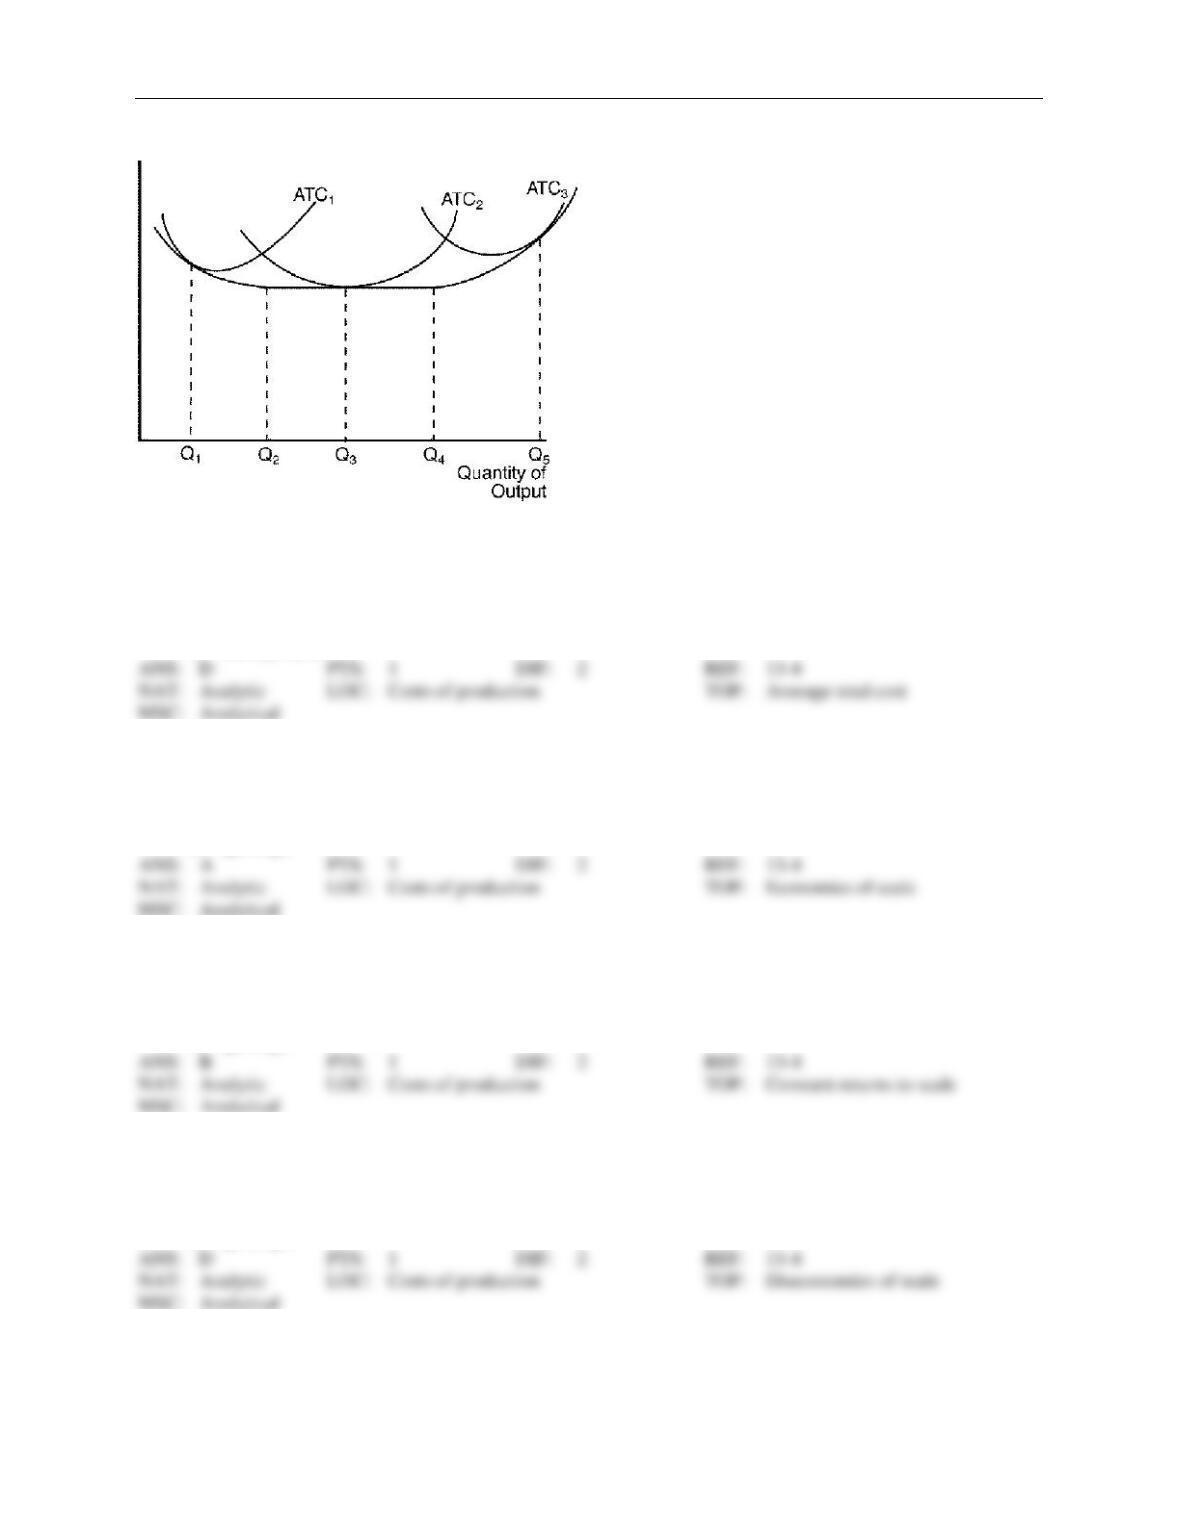
Figure 13-10
53. Refer to Figure 13-10. The three average total cost curves on the diagram labeled ATC1, ATC2, and ATC3
most likely correspond to three different
a.
time horizons.
b.
products.
c.
firms.
d.
factory sizes.
54. Refer to Figure 13-10. The firm experiences economies of scale if it changes its level of output from
a.
Q1 to Q2.
b.
Q2 to Q3.
c.
Q3 to Q4.
d.
Q4 to Q5.
55. Refer to Figure 13-10. The firm experiences constant returns to scale if it changes its level of output from
a.
Q1 to Q2.
b.
Q2 to Q4.
c.
Q1 to Q3.
d.
Q4 to Q5.
56. Refer to Figure 13-10. The firm experiences diseconomies of scale if it changes its level of output from
a.
Q1 to Q2.
b.
Q2 to Q3.
c.
Q3 to Q4.
d.
Q4 to Q5.
90 ❖ Chapter 13/The Costs of Production
Table 13–14
Listed in the table are the long-run total costs for three different firms.
Quantity
1
2
3
4
5
Firm A
100
100
100
100
100
Firm B
100
200
300
400
500
Firm C
100
300
600
1,000
1,500
57. Refer to Table 13-14. Which firm is experiencing diseconomies of scale?
a.
Firm A only
b.
Firm B only
c.
Firm C only
d.
Firm A and Firm B only
58. Refer to Table 13-14. Which firm is experiencing constant returns to scale?
a.
Firm A only
b.
Firm B only
c.
Firm C only
d.
Firm A and Firm B only
Table 13–15
Consider the following table of long-run total cost for four different firms:
Quantity
1
2
3
4
5
6
7
Firm 1
$210
$340
$490
$660
$850
$1,060
$1,290
Firm 2
$180
$350
$510
$660
$800
$930
$1,050
Firm 3
$120
$250
$390
$540
$700
$870
$1,050
Firm 4
$150
$300
$450
$600
$750
$900
$1,050
59. Refer to Table 13–13. Which firm has constant returns to scale over the entire range of output?
a.
Firm 1
b.
Firm 2
c.
Firm 3
d.
Firm 4
60. Refer to Table 13–13. Which firm has diseconomies of scale over the entire range of output?
a.
Firm 1 only
b.
Firms 1 and 2 only
c.
Firm 3 only
d.
Firm 4 only
Chapter 13/The Costs of Production ❖ 91
61. Refer to Table 13–13. Which firm has economies of scale over the entire range of output?
a.
Firm 1 only
b.
Firms 1 and 2 only
c.
Firm 2 only
d.
Firm 3 only
62. Refer to Table 13–13. Which firm has economies of scale and then diseconomies of scale as output increases
from 1 to 7?
a.
Firm 1
b.
Firm 2
c.
Firm 3
d.
Firm 4
63. Refer to Table 13–13. Which firm’s long-run marginal cost decreases as output increases?
a.
Firm 1
b.
Firm 2
c.
Firm 3
d.
Firm 4
64. Refer to Table 13–13. Firm 1’s efficient scale occurs at what quantity?
a.
2
b.
3
c.
4
d.
5
CONCLUSION
1. In his book, An Inquiry into the Nature and Causes of the Wealth of Nations, Adam Smith described a visit he
made to a
a.
car factory.
b.
pin factory.
c.
washing machine factory.
d.
farm.
2. In his book, An Inquiry into the Nature and Causes of the Wealth of Nations, Adam Smith credits economies
of scale to
a.
competition.
b.
opportunity costs.
c.
specialization.
d.
incentives.
92 ❖ Chapter 13/The Costs of Production
3. In setting the production level, a firm’s cost curves
a.
by themselves do not tell us what decisions the firm will make.
b.
dictate what decisions the firm will make.
c.
have no bearing on what decisions the firm will make.
d.
None of the above is correct.
TRUE/FALSE
1. The economic field of industrial organization examines how firms’ decisions about prices and quantities de-
pend on the market conditions they face.
2. The field of industrial organization addresses how the number of firms affects prices in a market and the effi-
ciency of the market outcome.
3. A firm’s total profit equals its marginal revenue minus its marginal cost.
4. Profit equals total revenue minus total cost.
5. The difference between economic profit and accounting profit is that economic profit is calculated based on
both implicit and explicit costs whereas accounting profit is calculated based on explicit costs only.
6. Accounting profit is greater than or equal to economic profit.
7. Economic profit is greater than or equal to accounting profit.
8. Although economists and accountants treat many costs differently, they both treat the cost of capital the same.
9. Accountants keep track of the money that flows into and out of firms.
Chapter 13/The Costs of Production ❖ 93
10. When economists speak of a firm’s costs, they are usually excluding the opportunity costs.
11. Economists and accountants both include forgone income as a cost to a small business owner.
12. Anna borrows $5,000 from a bank and withdraws $1,000 from her personal savings to start a coffee shop.
The interest rate is 5 percent for both the bank loan and her personal savings. Her opportunity cost of capital
is $250.
13. Economists and accountants usually disagree on the inclusion of implicit costs into the cost analysis of a firm.
14. Implicit costs are costs that do not require an outlay of money by the firm.
15. Accountants often ignore implicit costs.
16. The opportunity cost of capital is an implicit cost almost every business incurs.
17. An example of an explicit cost would be the wages that a business owner pays her employees.
18. An example of an explicit cost for the owner of a tattoo parlor would be the wages that she could earn if she
worked as a graphic artist for an advertising agency.
19. Diminishing marginal productivity implies decreasing total product.
20. Diminishing marginal product exists when the total cost curve becomes horizontal as outputs increases.
94 ❖ Chapter 13/The Costs of Production
21. Diminishing marginal product exists when the production function becomes flatter as inputs increase.
22. A second or third worker may have a higher marginal product than the first worker in certain circumstances.
23. The typical total-cost curve is U-shaped.
24. The average-fixed-cost curve is constant.
25. In the short run, if a firm produces nothing, total costs are zero.
26. If a firm produces nothing, it still incurs its fixed costs.
27. For a typical firm, fixed costs increase in direct proportion to the increases in output.
28. The shape of the total-cost curve is unrelated to the shape of the production function.
29. The shape of the total-cost curve is inversely related to the shape of the production function.
30. The graph of the production function plots total cost versus quantity of output.
31. Suppose that a worker can produce 100 units of output in 7 hours. In the 8th hour, he can produce 12 units of
output. The worker can produce 112 units of output in 8 hours.
Chapter 13/The Costs of Production ❖ 95
32. Marginal costs are costs that do not vary with the quantity of output produced.
33. Several related measures of cost can be derived from a firm’s total cost.
34. Variable costs usually change as the firm alters the quantity of output produced.
35. Variable costs equal fixed costs when nothing is produced.
36. The cost of producing an additional unit of a good is not the same as the average cost of the good.
37. Average variable cost is equal to total variable cost divided by quantity of output.
38. The average-total-cost curve is unaffected by diminishing marginal product.
39. The average-total-cost curve reflects the shape of both the average-fixed-cost and average-variable-cost
curves.
40. If the marginal-cost curve is rising, then so is the average-total-cost curve.
41. The marginal-cost curve intersects the average-total-cost curve at the minimum point of the average-total-cost
curve.
42. The marginal-cost curve intersects the average-total-cost curve at the minimum point of the marginal-cost
curve.
96 ❖ Chapter 13/The Costs of Production
43. The marginal-cost curve intersects the average-total-cost curve at the output level where average fixed costs
are zero.
44. Assume Jack received all As in his classes last semester. If Jack gets all Bs in his classes this semester, his
GPA may or may not fall.
45. Average total cost and marginal cost express information that is already contained in a firm’s total cost.
46. Average total cost reveals how much total cost will change as the firm alters its level of production.
47. If the marginal cost of producing the tenth unit of output is $3, and if the average total cost of producing the
tenth unit of output is $2, then at ten units of output, average total cost is rising.
48. If the marginal cost of producing the tenth unit of output is $2.50, and if the average total cost of producing the
tenth unit of output is $3, then at ten units of output, average total cost is rising.
49. If the marginal cost of producing the fifth unit of output is higher than the marginal cost of producing the
fourth unit of output, then at five units of output, average total cost must be rising.
50. The shape of the marginal cost curve tells a producer something about the marginal product of her workers.
51. The marginal-cost curve intersects the average-fixed-cost curve at the minimum of marginal cost.
52. When average total cost is above marginal cost, average total cost is rising.
Chapter 13/The Costs of Production ❖ 97
53. When average total cost rises if a producer either increases or decreases production, then the firm is said to be
operating at efficient scale.
54. In the long run, a factory is usually considered a fixed input.
55. Fixed costs are those costs that remain fixed no matter how long the time horizon is.
56. The fact that many inputs are fixed in the short run but variable in the long run has little impact on the firm‘s
cost curves.
57. There is general agreement among economists that the long-run time period exceeds one year.
58. As a firm moves along its long-run average cost curve, it is adjusting the size of its factory to the quantity of
production.
59. Because of the greater flexibility that firms have in the long run, all short-run cost curves lie on or above the
long-run curve.
60. Economies of scale often arise because higher production levels allow specialization among workers.
61. If long-run average total cost is rising, then the firm is experiencing economies of scale.
62. In some cases, specialization allows larger factories to produce goods at a lower average cost than smaller fac-
tories.
98 ❖ Chapter 13/The Costs of Production
63. The use of specialization to achieve economies of scale is one reason modern societies are as prosperous as
they are.
64. When a firm experiences economies of scale, long-run average total cost falls as the quantity of output in-
creases.
65. Diseconomies of scale often arise because higher production levels allow specialization among workers.
Table 13–16
Listed in the table are the long-run total costs for three different firms.
Quantity
1
2
3
4
5
Firm A
100
100
100
100
100
Firm B
100
200
300
400
500
Firm C
100
300
600
1,000
1,500
66. Refer to Table 13-16. Firm A is experiencing economies of scale.
67. Refer to Table 13-16. Firm A is experiencing constant returns to scale.
68. Refer to Table 13-16. Firm B is experiencing constant returns to scale.
69. Refer to Table 13-16. Firm B is experiencing diseconomies of scale.
70. Refer to Table 13-16. Firm C is experiencing diseconomies of scale.
71. Refer to Table 13-16. Firm C is experiencing economies of scale.
72. Adam Smith’s example of the pin factory demonstrates that economies of scale result from specialization.

Chapter 13/The Costs of Production ❖ 99
73. Adam Smith describes a visit to a car factory when discussing economies of scale in his book An Inquiry into
the Nature and Causes of the Wealth of Nations.
SHORT ANSWER
1. What are opportunity costs? How do explicit and implicit costs relate to opportunity costs?
2. A key difference between accountants and economists is their different treatment of the cost of capital. Does
this cause an accountant’s estimate of total costs to be higher or lower than an economist’s estimate? Explain.
3. The production function depicts a relationship between which two variables? Also, draw a production function
that exhibits diminishing marginal product.
4. How would a production function that exhibits decreasing marginal product affect the shape of the total cost
curve? Explain or draw a graph.
100 ❖ Chapter 13/The Costs of Production
5. What effect, if any, does diminishing marginal product have on the shape of the marginal cost curve?
6. Bob Edwards owns a bagel shop. Bob hires an economist who assesses the shape of the bagel shop’s average
total cost (ATC) curve as a function of the number of bagels produced. The results indicate a U-shaped aver-
age total cost curve. Bob’s economist explains that ATC is U-shaped for two reasons. The first is the existence
of diminishing marginal product, which causes it to rise. What would be the second reason? Assume that the
marginal cost curve is linear. (Hint: The second reason relates to average fixed cost)
7. If the average total cost curve is falling, what is necessarily true of the marginal cost curve? If the average total
cost curve is rising, what is necessarily true of the marginal cost curve?
8. According to the mathematical laws that govern the relationship between average total cost and marginal cost,
where must these two curves intersect?