Unlock document.
This document is partially blurred.
Unlock all pages and 1 million more documents.
Get Access

41. Diseconomies of scale occur when a firm’s
a.
marginal costs are constant as output increases.
b.
long-run average total costs are decreasing as output increases.
c.
long-run average total costs are increasing as output increases.
d.
marginal costs are equal to average total costs for all levels of output.
42. Diseconomies of scale occur when
a.
average fixed costs are falling.
b.
average fixed costs are constant.
c.
long-run average total costs rise as output increases.
d.
long-run average total costs fall as output increases.
43. In the long run, when marginal cost is above average total cost, the average total cost curve exhibits
a.
economies of scale.
b.
diseconomies of scale.
c.
constant returns to scale.
d.
efficient scale.
44. Firms may experience diseconomies of scale when
a.
they are too small to take advantage of specialization.
b.
large management structures are bureaucratic and inefficient.
c.
there are too few employees, and managers do not have enough to do.
d.
average fixed costs begin to rise again.
45. In the long run a company that produces and sells covers for cell phones incurs total costs of $2,500 when output is
1,250 covers and $4,000 when output is 1,500 covers. For this range of output, the cell phone cover company exhibits
a.
economies of scale.
b.
constant returns to scale.
c.
diseconomies of scale.
d.
efficient scale.
46. In the long run a company that produces and sells organic tofu incurs total costs of $1,200 when output is 1,200 units
and $1,650 when output is 1,400 units. The tofu company exhibits
a.
diseconomies of scale because total cost is rising as output rises.
b.
diseconomies of scale because average total cost is rising as output rises.
c.
economies of scale because total cost is rising as output rises.
d.
economies of scale because average total cost is falling as output rises.
47. Suppose that a firm’s long-run average total costs of producing small commuter jet airplanes increases as it produces
between 2,000 and 4,000 airplanes. For this range of output, the firm is experiencing
a.
economies of scale.
b.
constant returns to scale.
c.
diseconomies of scale.
d.
specialization.
48. Suppose that a firm’s long-run average total costs of producing custom wooden picnic tables is $300 when it produces
10,000 tables and $325 when it produces 11,000 tables. For this range of output, the firm is experiencing
a.
economies of scale.
b.
constant returns to scale.
c.
diseconomies of scale.
d.
specialization.
49. Suppose that a firm’s long-run average total costs of producing hand-crafted chairs is $300 when it produces 10,000
chairs and $325 when it produces 11,000 chairs. For this range of output, the firm is likely experiencing
a.
economies of scale.
b.
constant returns to scale.
c.
specialization.
d.
coordination problems.
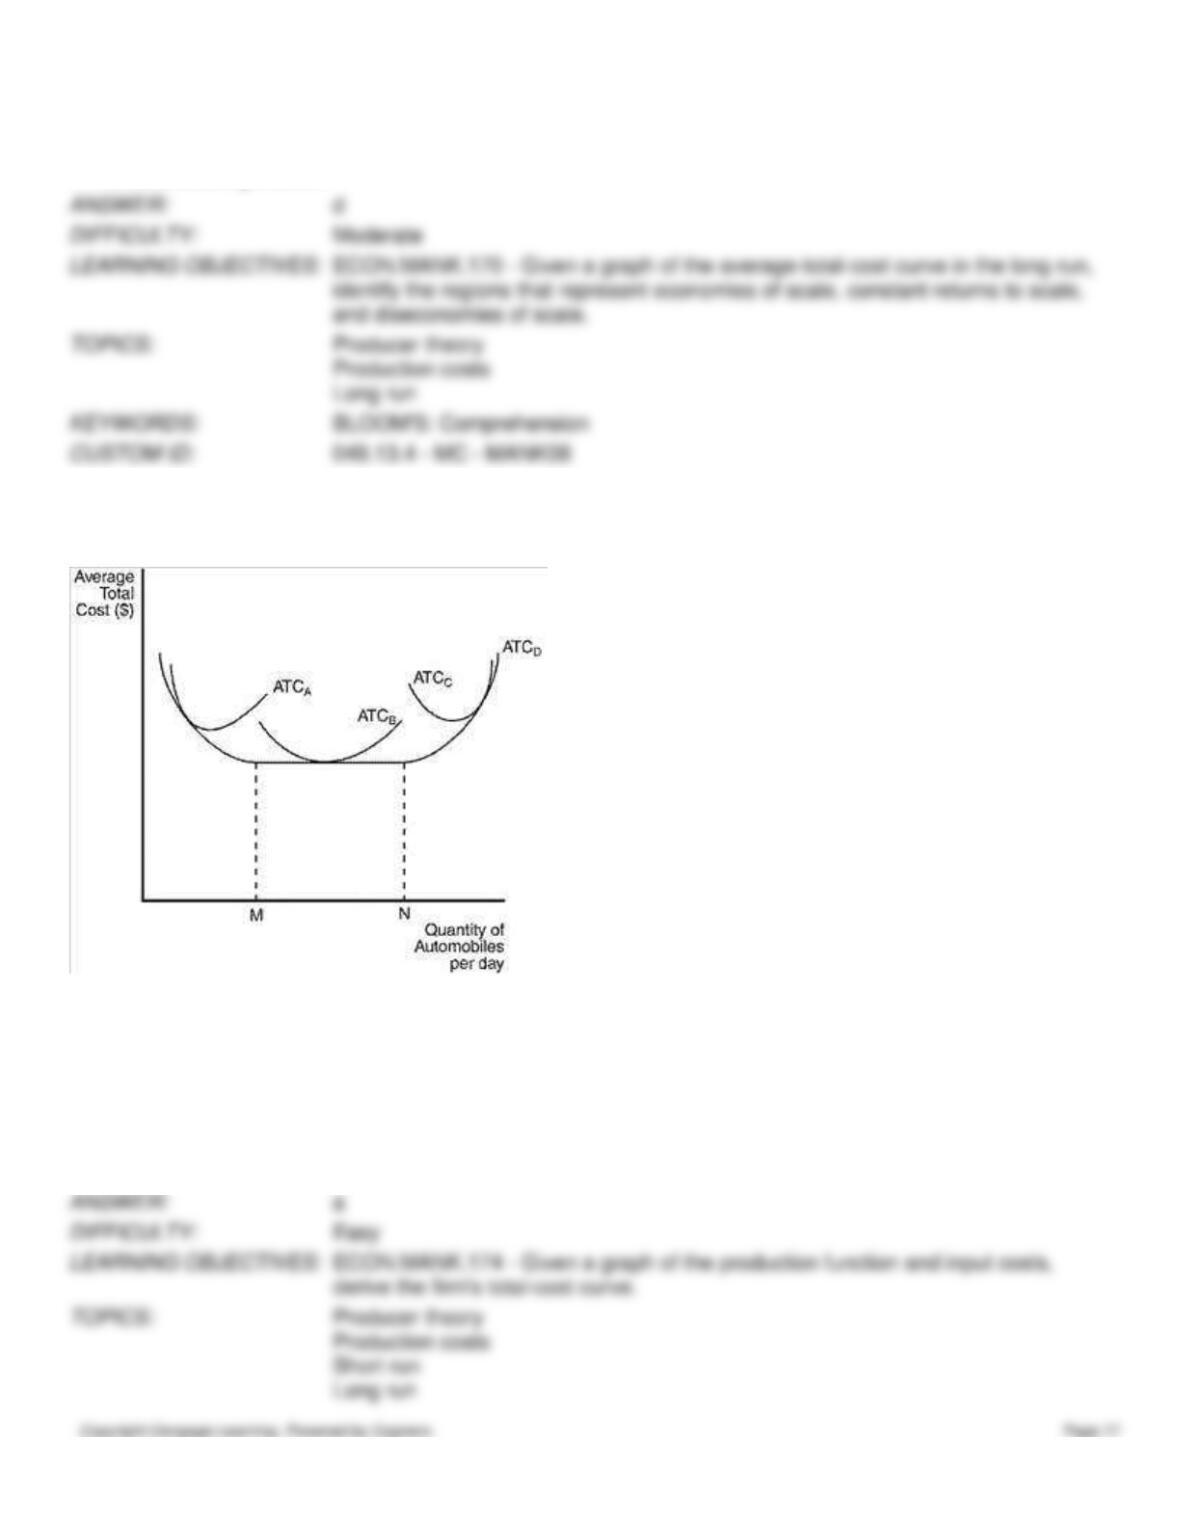
Figure 13-9
The figure below depicts average total cost functions for a firm that produces automobiles.
50. Refer to Figure 13-9. Which of the curves is most likely to characterize the short-run average total cost curve of the
smallest factory?
a.
ATCA
b.
ATCB
c.
ATCC
d.
ATCD
51. Refer to Figure 13-9. Which curve represents the long-run average total cost?
a.
ATCA
b.
ATCB
c.
ATCC
d.
ATCD
52. Refer to Figure 13-9. In the long run, the firm can operate on which of the following average total cost curves?
a.
ATCA
b.
ATCB
c.
ATCC
d.
All of the above are correct.
53. Refer to Figure 13-9. The firm experiences economies of scale at which output levels?
a.
output levels less than M
b.
output levels between M and N
c.
output levels greater than N
d.
All of the above are correct as long as the firm is operating in the long run.
54. Refer to Figure 13-9. At levels of output less than M, the firm experiences
a.
economies of scale.
b.
diseconomies of scale.
c.
constant returns to scale.
d.
both diminishing marginal productivity and coordination problems.
55. Refer to Figure 13-9. The firm experiences constant returns to scale at which output levels?
a.
output levels less than M
b.
output levels between M and N
c.
output levels greater than N
d.
All of the above are correct as long as the firm is operating in the long run.
56. Refer to Figure 13-9. At levels of output between M and N, the firm experiences
a.
economies of scale.
b.
diseconomies of scale.
c.
constant returns to scale.
d.
both the benefits of specialization and diminishing marginal productivity.
57. Refer to Figure 13-9. This firm experiences diseconomies of scale at what output levels?
a.
output levels greater than N
b.
output levels between M and N
c.
output levels less than M
d.
All of the above are correct as long as the firm is operating in the long run.
58. Refer to Figure 13-9. At output levels greater than N, the firm experiences
a.
economies of scale.
b.
constant returns to scale.
c.
diseconomies of scale.
d.
minimum efficient scale.
Figure 13-10
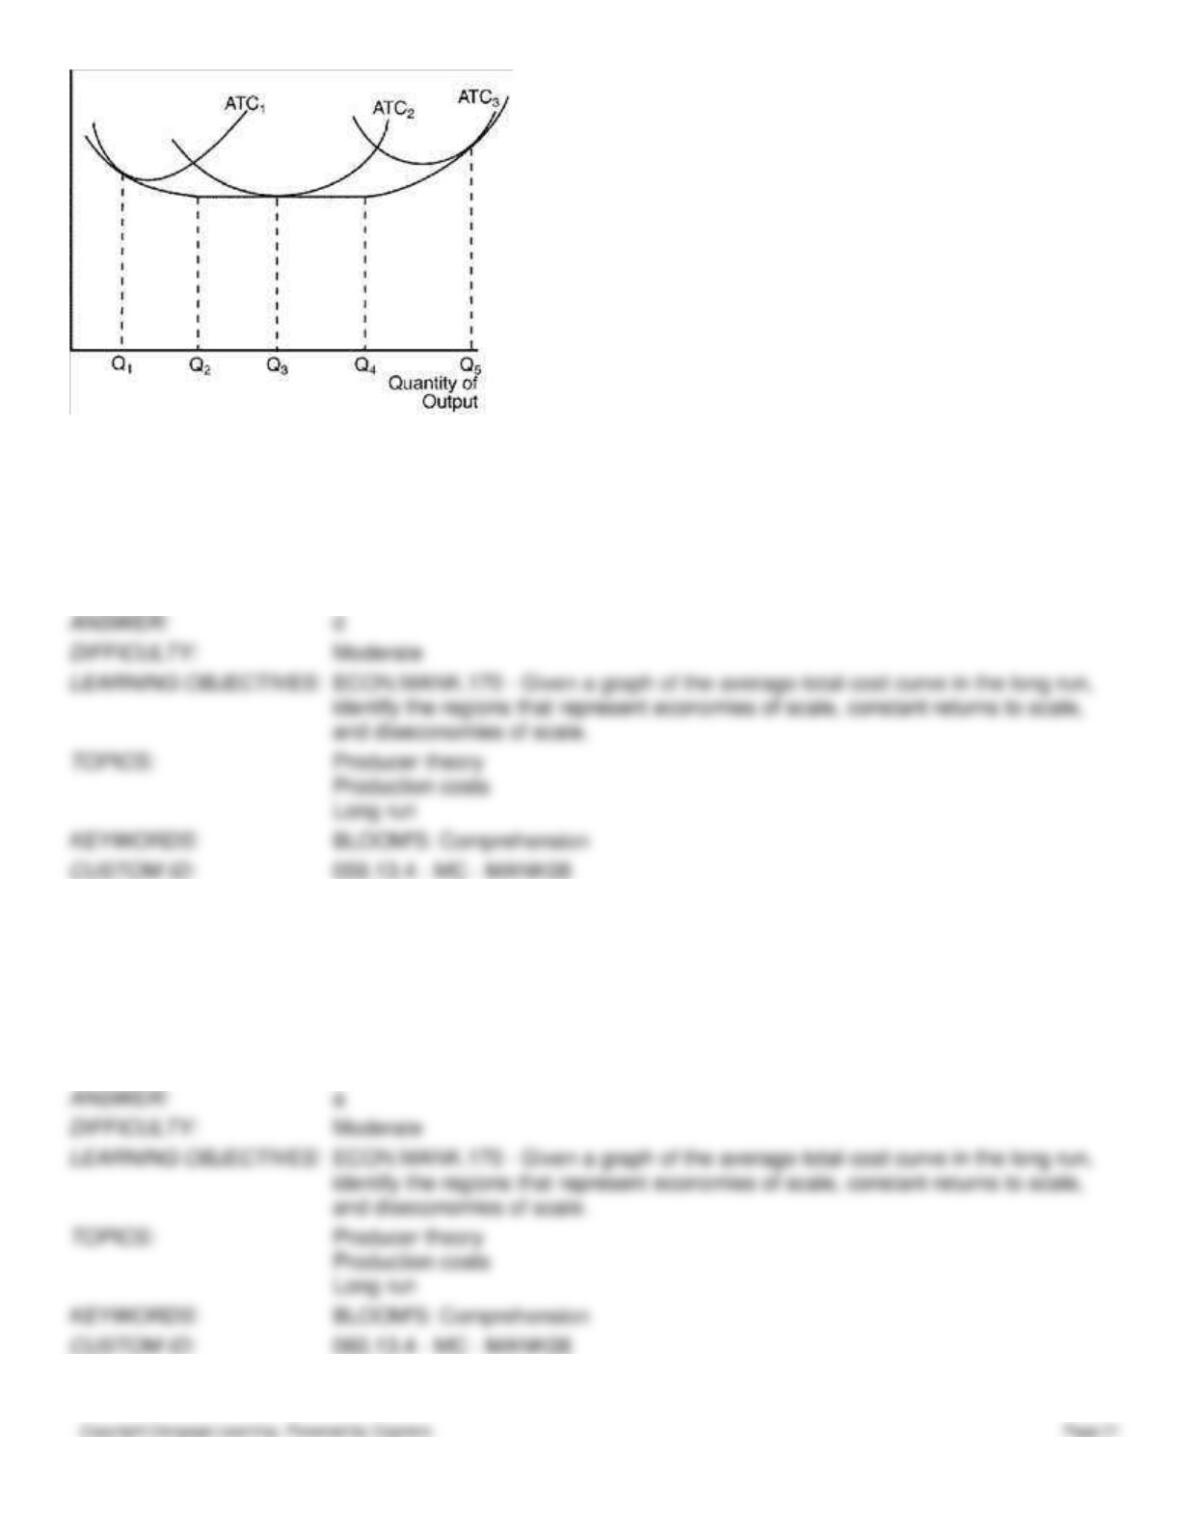
59. Refer to Figure 13-10. The three average total cost curves on the diagram labeled ATC1, ATC2, and ATC3 most
likely correspond to three different
a.
time horizons.
b.
products.
c.
firms.
d.
factory sizes.
60. Refer to Figure 13-10. The firm experiences economies of scale if it changes its level of output from
a.
Q1 to Q2.
b.
Q2 to Q3.
c.
Q3 to Q4.
d.
Q4 to Q5.
61. Refer to Figure 13-10. The firm experiences constant returns to scale if it changes its level of output from
a.
Q1 to Q2.
b.
Q2 to Q4.
c.
Q1 to Q3.
d.
Q4 to Q5.
62. Refer to Figure 13-10. The firm experiences diseconomies of scale if it changes its level of output from
a.
Q1 to Q2.
b.
Q2 to Q3.
c.
Q3 to Q4.
d.
Q4 to Q5.
Table 13-16
Listed in the table are the long-run total costs for three different firms.
Quantity
1
2
3
4
5
Firm A
100
100
100
100
100
Firm B
100
200
300
400
500
Firm C
100
300
600
1,000
1,500
63. Refer to Table 13-16. Which firm is experiencing diseconomies of scale?
a.
Firm A only
b.
Firm B only
c.
Firm C only
d.
Firm A and Firm B only
64. Refer to Table 13-16. Which firm is experiencing constant returns to scale?
a.
Firm A only
b.
Firm B only
c.
Firm C only
d.
Firm A and Firm B only
Table 13-17
Consider the following table of long-run total cost for four different firms:
Quantity
1
2
3
4
5
6
7
Firm 1
$180
$350
$510
$660
$800
$930
$1,050
Firm 2
$120
$250
$390
$540
$700
$870
$1,050
Firm 3
$150
$300
$450
$600
$750
$900
$1,050
Firm 4
$210
$340
$490
$660
$850
$1,060
$1,290
65. Refer to Table 13-17. Which firm has constant returns to scale over the entire range of output?
a.
Firm 1
b.
Firm 2
c.
Firm 3
d.
Firm 4
66. Refer to Table 13-17. Which firm has diseconomies of scale over the entire range of output?
a.
Firm 1 only
b.
Firm 2 only
c.
Firms 1 and 2 only
d.
Firm 3 only
67. Refer to Table 13-17. Which firm has economies of scale over the entire range of output?
a.
Firm 1 only
b.
Firms 1 and 2 only
c.
Firm 2 only
d.
Firm 3 only
68. Refer to Table 13-17. Which firm has economies of scale and then diseconomies of scale as output increases from 1
to 7?
a.
Firm 1
b.
Firm 2
c.
Firm 3
d.
Firm 4
69. Refer to Table 13-17. Which firm's long-run marginal cost decreases as output increases?
a.
Firm 1
b.
Firm 2
c.
Firm 3
d.
Firm 4
70. Refer to Table 13-17. Firm 4's efficient scale occurs at what quantity?
a.
2
b.
3
c.
4
d.
5
71. Chloe’s Café sells gourmet cinnamon rolls. In the long run, the café incurs a total cost of $500 to produce 1,000
cinnamon rolls. If Chloe’s Café exhibits economies of scale between 1,000 and 2,000 cinnamon rolls, the long-run
average total cost for 1,500 cinnamon rolls is
a.
higher than $0.50.
b.
lower than $0.50.
c.
equal to $0.50.
d.
higher than $500.
72. Chloe’s Café sells gourmet cinnamon rolls. In the long run, the café incurs a total cost of $500 to produce 1,000
cinnamon rolls. If Chloe’s Café exhibits constant returns to scale between 1,000 and 1,500 cinnamon rolls, the long-run
average total cost for 1,250 cinnamon rolls is
a.
higher than $0.50.
b.
lower than $0.50.
c.
equal to $0.50.
d.
equal to $500.


