Subjective Short Answer
1. Define profit.
2. Consider a small family wheat farm. List some examples of explicit costs of farming.
3. Consider a small family wheat farm. List some examples of implicit costs of farming.
4. Can economic profit ever exceed accounting profit?
5. Briefly describe why measuring a firm’s costs is more complicated than measuring its revenues.
6. Consider a small hair styling salon. List some examples of explicit costs of this business.
7. Consider a small hair styling salon. List some examples of implicit costs of this business.
8. Which is greater — economic profit or accounting profit?
9. Refer to Scenario 13-21. What is the accounting profit for the family farm?
10. Refer to Scenario 13–21. What is the economic profit for the family farm?
11. Refer to Scenario 13–22. What is the accounting profit for the hair styling salon?
12. Refer to Scenario 13–22. What is the economic profit for the hair styling salon?
Table 13–18
Labor
Output
Marginal
Product
Variable
Cost
Fixed
Cost
0
0
—
$0
$10
1
200
200
$20
$10
2
350
$40
$10
3
450
$60
$10
4
50
$80
$10
5
25
$100
$10
6
530
$120
$10
13. Refer to Table 13–18. What is the marginal product of the third worker?
450 – 350 = 100 units
14. Refer to Table 13–18. What is the total output of four workers?
450 + 50 = 500 units
15. Refer to Table 13–18. What is the total output of five workers?
25 = 525 units.
16. Refer to Table 13–18. What is the marginal product of the sixth worker?
25 = 525 units. 530 – 525 = 5 units.
17. Refer to Table 13–18. What is the shape of the firm’s total-cost curve?
18. Refer to Table 13–18. What is the average total cost of producing 525 units of output?
19. Refer to Table 13–18. What is the average variable cost of producing 500 units of output?
20. Refer to Table 13–18. What is the average fixed cost of producing 450 units of output?
21. Refer to Table 13–18. What is the shape of the average-fixed-cost curve?
22. Refer to Table 13–18. What is the shape of the average-variable-cost curve?
23. Refer to Table 13–18. What is the shape of the average-total-cost curve?
24. Refer to Table 13–18. What is the shape of the marginal-cost curve?
Table 13–19
Labor
Output
Marginal
Product
Variable
Cost
Fixed
Cost
0
0
—
$0
$5
1
100
100
$5
$5
2
250
$10
$5
3
350
$15
$5
4
50
$20
$5
5
25
$25
$5
6
430
$30
$5
25. Refer to Table 13–19. What is the marginal product of the second worker?
26. Refer to Table 13–19. What is the total output of five workers?
25 = 425 units.
27. Refer to Table 13–19. What is the marginal product of the sixth worker?
25 = 425 units. 430 – 425 = 5 units.
28. Refer to Table 13–19. What is the shape of the marginal-cost curve?
29. Refer to Table 13–19. What is the shape of this firm’s total-cost curve?
30. Refer to Table 13–19. What is the average total cost of producing 425 units of output?
31. Refer to Table 13–19. What is the average variable cost of producing 400 units of output?
32. Refer to Table 13–19. What is the average fixed cost of producing 430 units of output?
33. Refer to Table 13–19. What is the shape of the average-fixed-cost curve?
34. Refer to Table 13–19. What is the shape of the average-variable-cost curve?
35. Refer to Table 13–19. What is the shape of the average-total-cost curve?
36. Describe the relationship between average total cost and marginal cost.
37. Describe the relationship between average variable cost and marginal cost.
38. Describe the general shape of the average-fixed-cost curve.
39. Describe the relationship between average variable cost and average total cost. How are the general shapes of the
AVC and ATC curves related?
40. Average variable cost will decrease if __________.
41. Average total cost will increase if __________.
42. How can the average-fixed-cost curve be declining when fixed cost is constant?
43. The average-fixed-cost curve is always declining. How does this affect the relationship between the AVC and ATC
curves?
44. Describe the difference between the short run and the long run.
45. What might cause economies of scale?
46. What might cause diseconomies of scale?
47. Suppose that Danita owns a cupcake bakery. In the short run, at least one of her inputs is fixed. Provide one or two
examples of the types of inputs that could be fixed in the short run.
48. Describe how an accounting firm could experience economies of scale.
49. Describe how a study group of economics students could experience economies of scale as they study for an
economics exam.
50. Describe how an accounting firm could experience diseconomies of scale.
51. What are opportunity costs? How do explicit and implicit costs relate to opportunity costs?
52. A key difference between accountants and economists is their different treatment of the cost of capital. Does this cause
an accountant’s estimate of total costs to be higher or lower than an economist’s estimate? Explain.
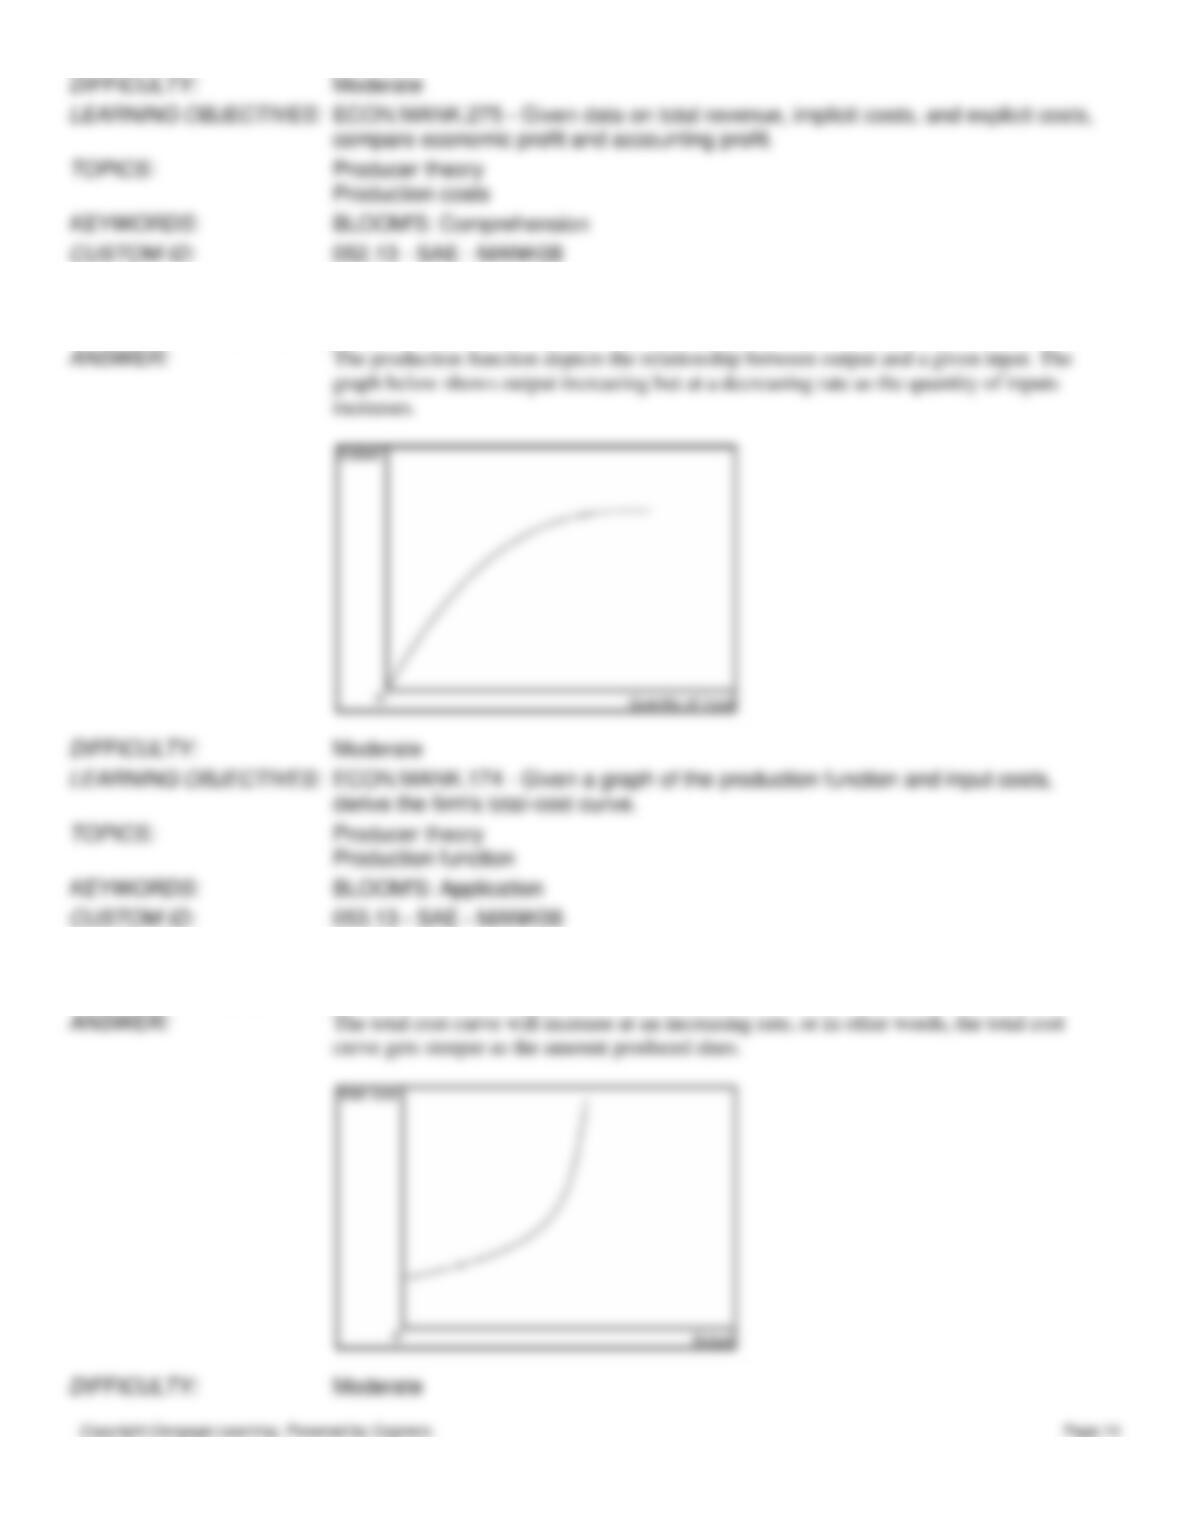
53. The production function depicts a relationship between which two variables? Also, draw a production function that
exhibits diminishing marginal product.
54. How would a production function that exhibits decreasing marginal product affect the shape of the total cost curve?
Explain or draw a graph.
55. What effect, if any, does diminishing marginal product have on the shape of the marginal cost curve?
56. Bob Edwards owns a bagel shop. Bob hires an economist who assesses the shape of the bagel shop’s average total cost
(ATC) curve as a function of the number of bagels produced. The results indicate a U-shaped average total cost curve.
Bob’s economist explains that ATC is U-shaped for two reasons. The first is the existence of diminishing marginal
product, which causes it to rise. What would be the second reason? Assume that the marginal cost curve is linear. (Hint:
The second reason relates to average fixed cost)
57. If the average total cost curve is falling, what is necessarily true of the marginal cost curve? If the average total cost
curve is rising, what is necessarily true of the marginal cost curve?
58. According to the mathematical laws that govern the relationship between average total cost and marginal cost, where
must these two curves intersect?