Unlock document.
This document is partially blurred.
Unlock all pages and 1 million more documents.
Get Access
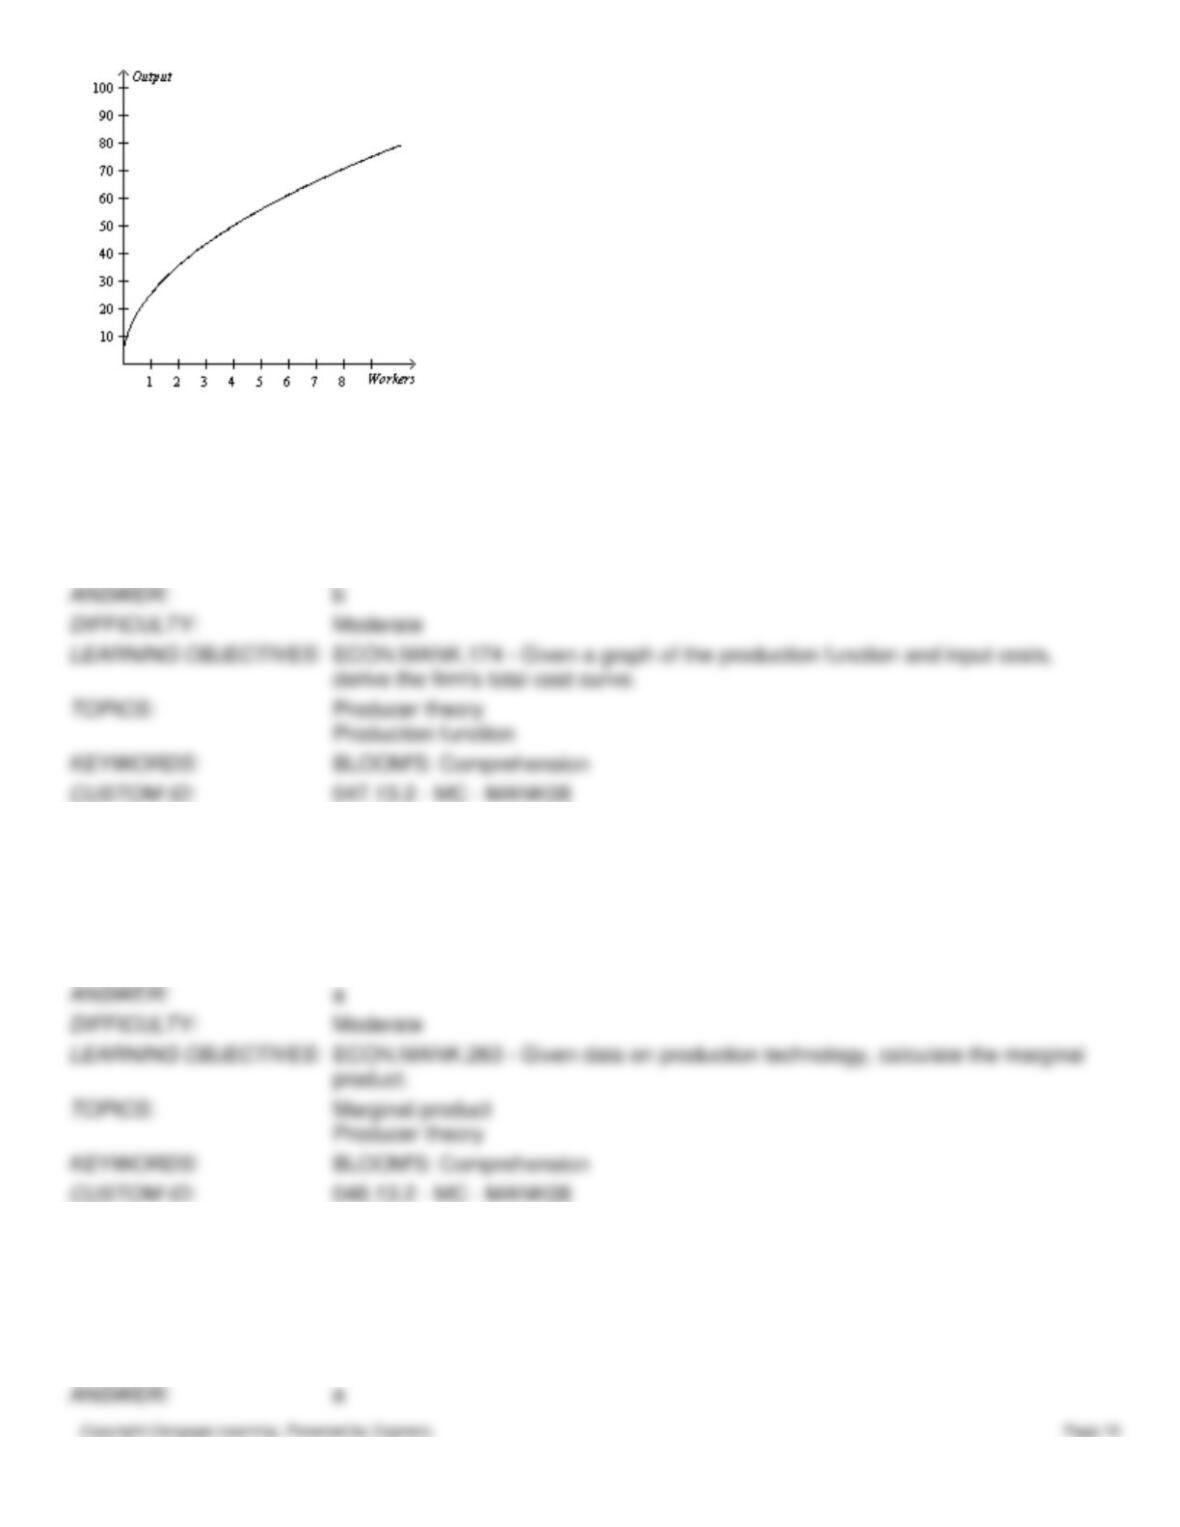
47. Refer to Figure 13-2. The graph illustrates a typical
a.
total-cost curve.
b.
production function.
c.
production possibilities frontier.
d.
marginal product of labor curve.
48. Refer to Figure 13-2. As the number of workers increases,
a.
total output increases but at a decreasing rate.
b.
marginal product increases but at a decreasing rate.
c.
marginal product increases at an increasing rate.
d.
total output decreases.
49. Refer to Figure 13-2. As the number of workers increases,
a.
marginal product decreases.
b.
total output decreases.
c.
marginal product increases but at a decreasing rate.
d.
Both a and b are correct.
50. Refer to Figure 13-2. If the figure represented production at a cookie factory, the factory would be experiencing
a.
diminishing marginal product of workers.
b.
diminishing marginal cost of cookie production.
c.
decreasing cost of cookie production.
d.
decreasing output of cookies.
51. Refer to Figure 13-2. The graph illustrates a typical production function. Based on its shape, what does the
corresponding total cost curve look like?
a.
an upward-sloping curve that increases at an increasing rate
b.
an upward-sloping curve that increases at a decreasing rate
c.
a downward-sloping curve
d.
a horizontal straight line
Table 13-4
Charles’s Math Tutoring
Number of
Workers
Output (number
of students tutored per
week)
0
0
1
20
2
45
3
60
4
70
52. Refer to Table 13-4. What is the marginal product of the second worker?
a.
15 students
b.
20 students
c.
22.5 students
d.
25 students
53. Refer to Table 13-4. What is the marginal product of the third worker?
a.
15 students
b.
20 students
c.
35 students
d.
60 students
54. Refer to Table 13-4. Charles’s math tutoring company experiences diminishing marginal productivity with the
addition of the
a.
first worker.
b.
second worker.
c.
third worker.
d.
fourth worker.
55. Refer to Table 13-4. Suppose that Charles’s math tutoring company has a fixed cost of $50 per month for his cell
phone. Each worker costs Charles $60 per day. As output increases from 0 to 45 students, Charles’s total cost curve
a.
increases but gets flatter.
b.
increases and gets steeper.
c.
decreases and gets flatter.
d.
decreases but gets steeper.
56. Refer to Table 13-4. Suppose that Charles’s math tutoring company has a fixed cost of $50 per month for his cell
phone. Each worker costs Charles $60 per day. As output increases from 45 to 70 students, Charles’s total cost curve
a.
increases but gets flatter.
b.
increases and gets steeper.
c.
decreases and gets flatter.
d.
decreases but gets steeper.
Table 13-5
Number of
Workers
Output
0
0
1
10,000
2
19,000
3
27,000
4
32,000
5
35,000
6
36,000
57. Refer to Table 13-5. The marginal product of the third worker is
a.
9,000 units.
b.
8,000 units.
c.
7,000 units.
d.
5,000 units.
58. Refer to Table 13-5. The marginal product of the fourth worker is
a.
9,000 units.
b.
8,000 units.
c.
7,000 units.
d.
5,000 units.
59. Refer to Table 13-5. Diminishing marginal product begins with the addition of the
a.
second worker.
b.
third worker.
c.
fourth worker.
d.
fifth worker.
60. Refer to Table 13-5. Assume that fixed costs are $500, and variable costs are $100 per worker. For this firm, what are
the shapes of the production function and the total-cost curve?
a.
Both the production function and total-cost curve are increasing at an increasing rate.
b.
Both the production function and total-cost curve are increasing at a decreasing rate.
c.
The production function is increasing at an increasing rate, whereas the total-cost function is increasing at a
decreasing rate.
d.
The production function is increasing at a decreasing rate, whereas the total-cost function is increasing at an
increasing rate.
Table 13-6
Wooden Chair Factory
Number
of
Workers
Number
of
Machines
Output
(chairs
produced
per hour)
Marginal
Product of
Labor
Cost of
Workers
Cost of
Machines
Total
Cost
1
2
5
2
2
10
3
2
20
4
2
35
5
2
55
6
2
70
7
2
80
61. Refer to Table 13-6. Each worker at the Wooden Chair Factory costs $12 per hour. The cost of each machine is $20
per day regardless of the number of chairs produced. If the factory produces at a rate of 70 chairs per hour and operates 8
hours per day, what is the factory’s total labor cost per day?
a.
$72
b.
$112
c.
$576
d.
$616
62. Refer to Table 13-6. Each worker at the Wooden Chair Factory costs $12 per hour. The cost of each machine is $20
per day regardless of the number of chairs produced. What is the total daily cost of producing at a rate of 55 chairs per
hour if the factory operates 8 hours per day?
a.
$480
b.
$576
c.
$520
d.
$616
63. Refer to Table 13-6. Each worker at the Wooden Chair Factory costs $12 per hour. The cost of each machine is $20
per day regardless of the number of chairs produced. Assume the number of machines does not change. If the factory
produces at a rate of 78 chairs per hour, what is the total machine cost per day?
a.
$20
b.
$40
c.
$240
d.
We are unable to determine total machine costs from the information given.
64. Refer to Table 13-6. Each worker at the Wooden Chair Factory costs $12 per hour. The cost of each machine is $20
per day regardless of the number of chairs produced. If the factory produces at a rate of 35 chairs per hour, what is the
total labor cost per hour?
a.
$40
b.
$48
c.
$384
d.
$424
65. Refer to Table 13-6. Assume the Wooden Chair Factory currently employs 5 workers. What is the marginal product
of labor when the factory adds a 6th worker?
a.
5 chairs per hour
b.
15 chairs per hour
c.
25 chairs per hour
d.
70 chairs per hour
66. Refer to Table 13-6. Assume the Wooden Chair Factory currently employs 2 workers. What is the marginal product
of labor when the factory adds a 3rd worker?
a.
5 chairs per hour
b.
10 chairs per hour
c.
20 chairs per hour
d.
25 chairs per hour
67. Refer to Table 13-6. The Wooden Chair Factory experiences diminishing marginal product of labor with the addition
of which worker?
a.
the third worker
b.
the fourth worker
c.
the fifth worker
d.
the sixth worker
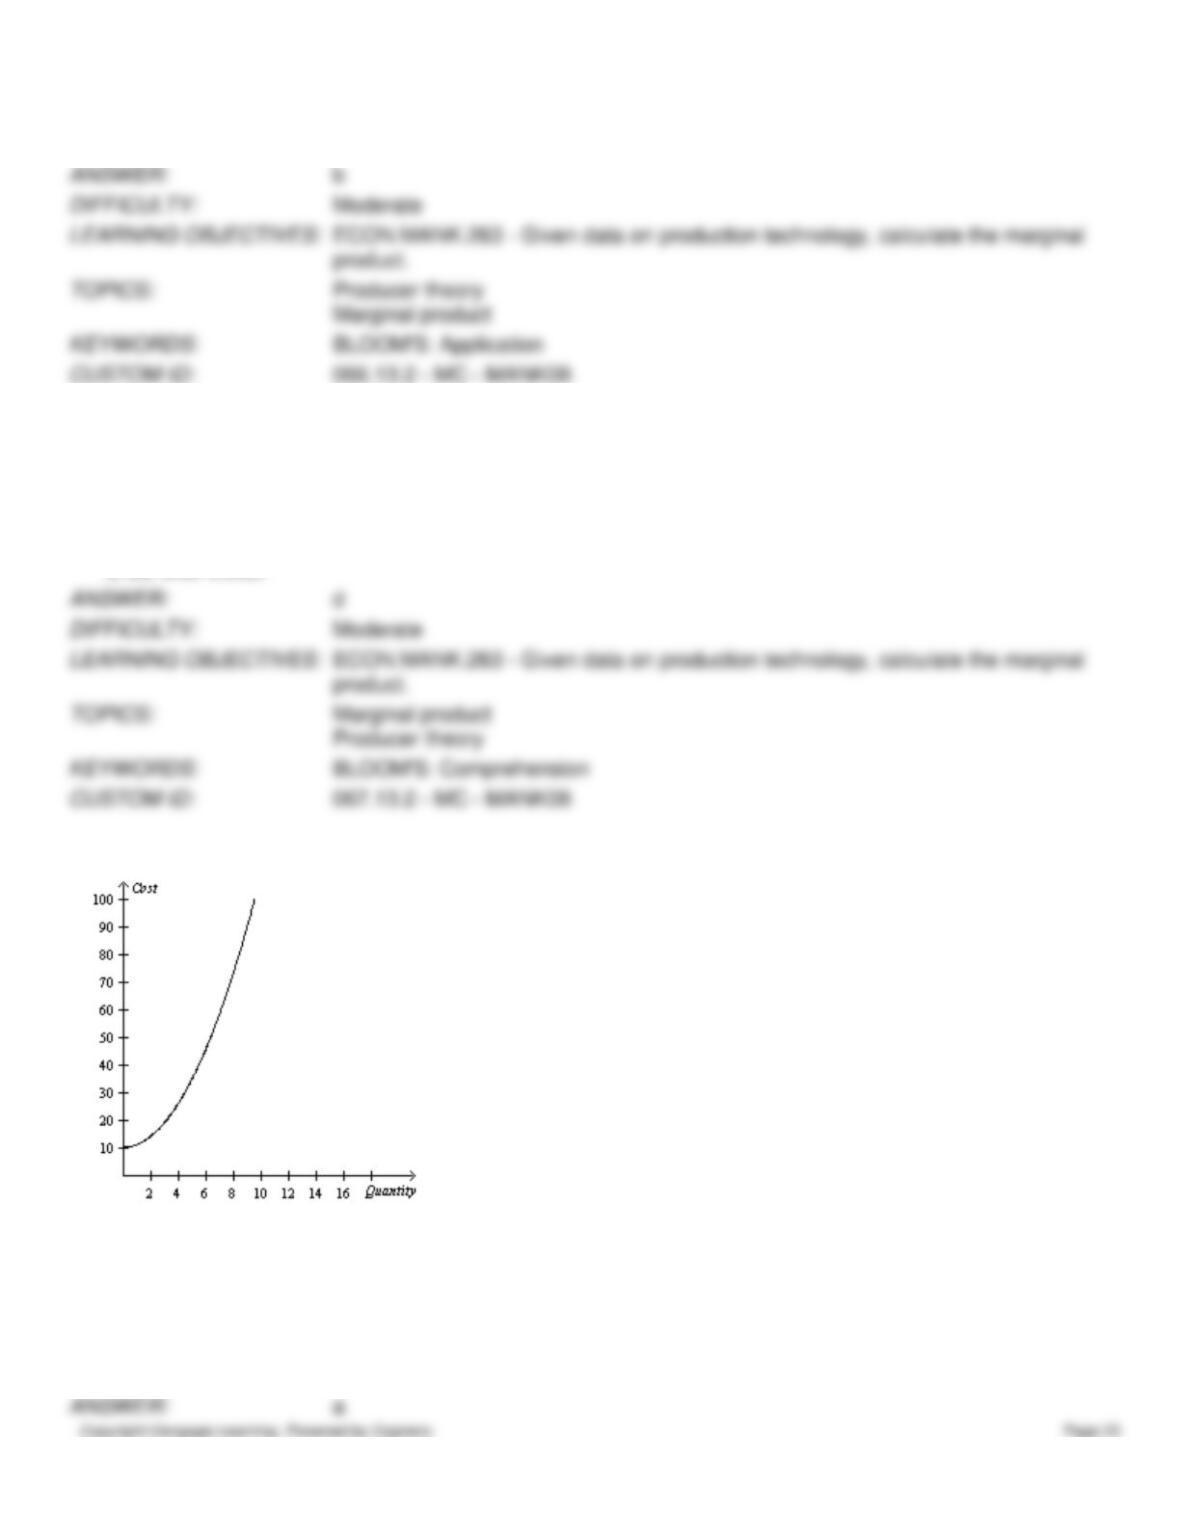
Figure 13-3
68. Refer to Figure 13-3. The graph illustrates a typical
a.
total-cost curve.
b.
production function.
c.
production possibilities frontier.
d.
fixed-cost curve.
69. Refer to Figure 13-3. The graph illustrates a typical total cost curve. Based on its shape, what does the corresponding
production function look like?
a.
an upward-sloping curve that increases at an increasing rate
b.
an upward-sloping curve that increases at a decreasing rate
c.
a downward-sloping curve
d.
a horizontal straight line
70. Refer to Figure 13-3. Which of the following is true of the production function (not pictured) that underlies this total
cost function?
(i)
Total output increases as the quantity of inputs increases but at a decreasing rate.
(ii)
Marginal product is diminishing for all levels of input usage.
(iii)
The slope of the production function decreases as the quantity of inputs increases.
a.
(i) only
b.
(ii) and (iii) only
c.
(i) and (iii) only
d.
(i), (ii), and (iii)
71. Refer to Figure 13-3. The changing slope of the total cost curve reflects
a.
decreasing average variable cost.
b.
decreasing average total cost.
c.
decreasing marginal product.
d.
increasing fixed cost.
72. Refer to Figure 13-3. Which of the following statements best captures the nature of the underlying production
function (not pictured)?
a.
Output increases at a decreasing rate with additional units of input.
b.
Output increases at an increasing rate with additional units of input.
c.
Output decreases at a decreasing rate with additional units of input.
d.
Output decreases at an increasing rate with additional units of input.
73. Refer to Figure 13-3. Assuming that the firm depicted produces cookies, which of the statements below is most
consistent with the shape of the total cost curve?
a.
Producing an additional cookie is always more costly than producing the previous cookie.
b.
Total production of cookies decreases with additional units of input.
c.
Producing additional cookies is equally costly, regardless of how many cookies are already being produced.
d.
Producing additional cookies becomes increasingly costly only when the number of cookies already being
produced is large.
74. Refer to Scenario 13-14. Farmer Brown’s production function exhibits
a.
increasing marginal product.
b.
constant marginal product.
c.
diminishing marginal product.
d.
The production function is unrelated to the marginal product.
75. Refer to Scenario 13-14. Farmer Brown’s total-cost curve is
a.
increasing at an increasing rate.
b.
increasing at a decreasing rate.
c.
increasing at a constant rate.
d.
decreasing.
76. Refer to Scenario 13-15. Joan’s production function exhibits
a.
increasing marginal product.
b.
decreasing marginal product.
c.
constant marginal product.
d.
Any of the above could be correct.
77. Refer to Scenario 13-15. Joan’s total-cost curve is
a.
increasing at an increasing rate.
b.
increasing at a decreasing rate.
c.
increasing at a constant rate.
d.
decreasing.
78. Which of the following statements about a production function is correct for a firm that uses labor to produce output?
a.
The production function depicts the relationship between the quantity of labor and the quantity of output.
b.
The slope of the production function measures marginal product.
c.
The slopes of the production function and the total cost curve are inversely related; if one is increasing, the
other is decreasing.
d.
All of the above are correct.
79. A total-cost curve shows the relationship between the
a.
quantity of an input used and the total cost of production.
b.
quantity of output produced and the total cost of production.
c.
total cost of production and profit.
d.
total cost of production and total revenue.
80. If the total cost curve gets steeper as output increases, the firm is experiencing
a.
diseconomies of scale.
b.
economies of scale.
c.
diminishing marginal product.
d.
increasing marginal product.
81. David’s firm experiences diminishing marginal product for all ranges of inputs. The total cost curve associated with
David’s firm
a.
gets flatter as output increases.
b.
gets steeper as output increases.
c.
is constant for all ranges of output.
d.
is unrelated to the production function.
Table 13-7
Number of
Workers
Total
Output
Marginal
Product
0
0
--
1
40
2
85
3
125
4
35
5
30
6
215
82. Refer to Table 13-7. What is total output when 1 worker is hired?
a.
0
b.
40
c.
45
d.
85
83. Refer to Table 13-7. What is total output when 5 workers are hired?
a.
30
b.
160
c.
190
d.
215
84. Refer to Table 13-7. What is the marginal product of the third worker?
a.
85
b.
125
c.
45
d.
40
85. Refer to Table 13-7. What is the marginal product of the sixth worker?
a.
215
b.
30
c.
25
d.
190
86. Refer to Table 13-7. At which number of workers does diminishing marginal product begin?
a.
1
b.
2
c.
3
d.
4