41. Cartel Pricing. An illegal cartel has been formed by the three leading catering services companies in
Colorado Springs, Colorado. Each are large enough to handle parties and food service for groups of over 100
persons. Total production costs for various group sizes are as follows:
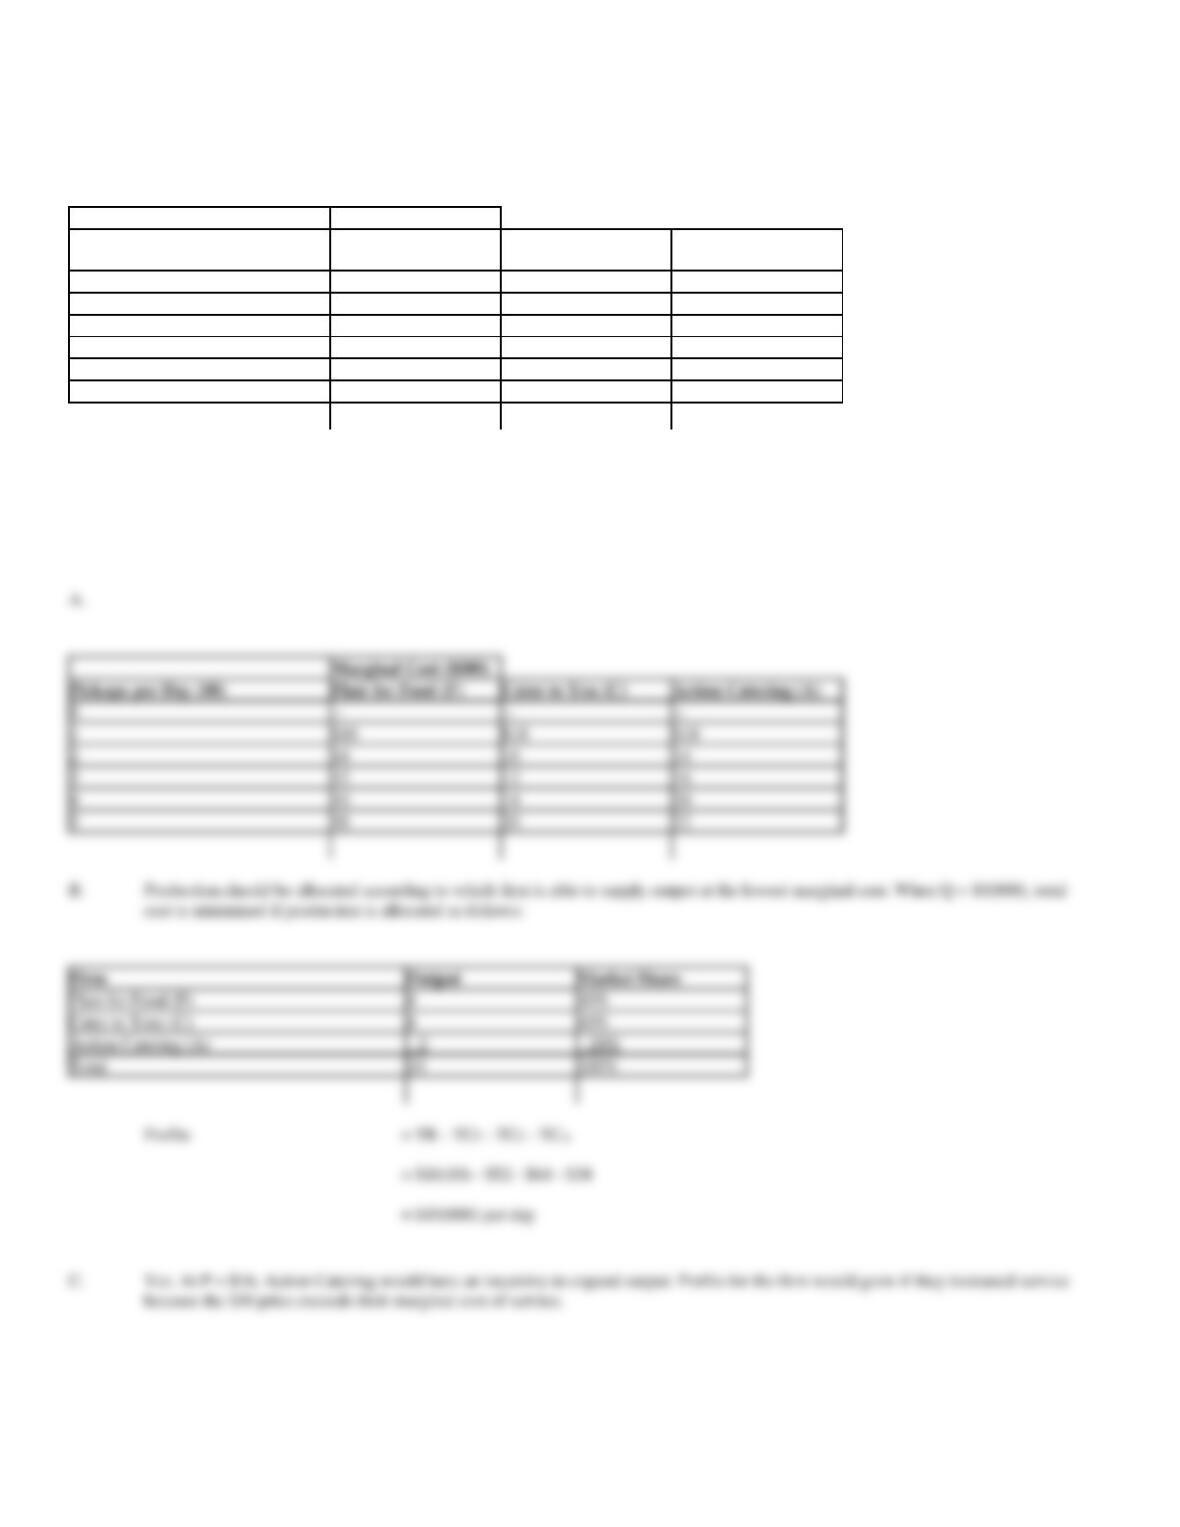
Total Cost ($000)
Maximum number of guests to
serve (000)
Flair for Food Co. (F)
Cater to You, Inc. (C)
Action Catering, Inc.
(A)
0
$ 0
$ 4
$ 2
1
16
22
20
2
30
38
34
3
42
50
50
4
52
62
70
5
70
84
92
A.
Construct a table showing the marginal cost of production per firm.
B.
From the data in part A, determine an optimal allocation of output and maximum profits if the cartel sets Q = 10(000) and P = $16.
C.
Is there an incentive for individual members to cheat by expanding output when the cartel sets Q = 10(000) and P = $16?
Marginal Cost ($000)
0
1
$16
$18
$18
2
14
16
14
3
12
12
16
5
18
20
22
Firm
Output
Market Share
Flair for Food (F)
4
40%
Cater to Your (C)
4
40%
Action Catering (A)
2
20%
Total
10
100%
Profits
= TR – TCF – TCC – TCA
= $16(10) – $52 – $64 – $34
= $10(000) per day
42. Cartel Pricing. An illegal cartel has been formed by three leading on-site tractor trailer fleet washing
service companies in Harrisburg, Pennsylvania. Total costs at various levels of service per day are as follows:
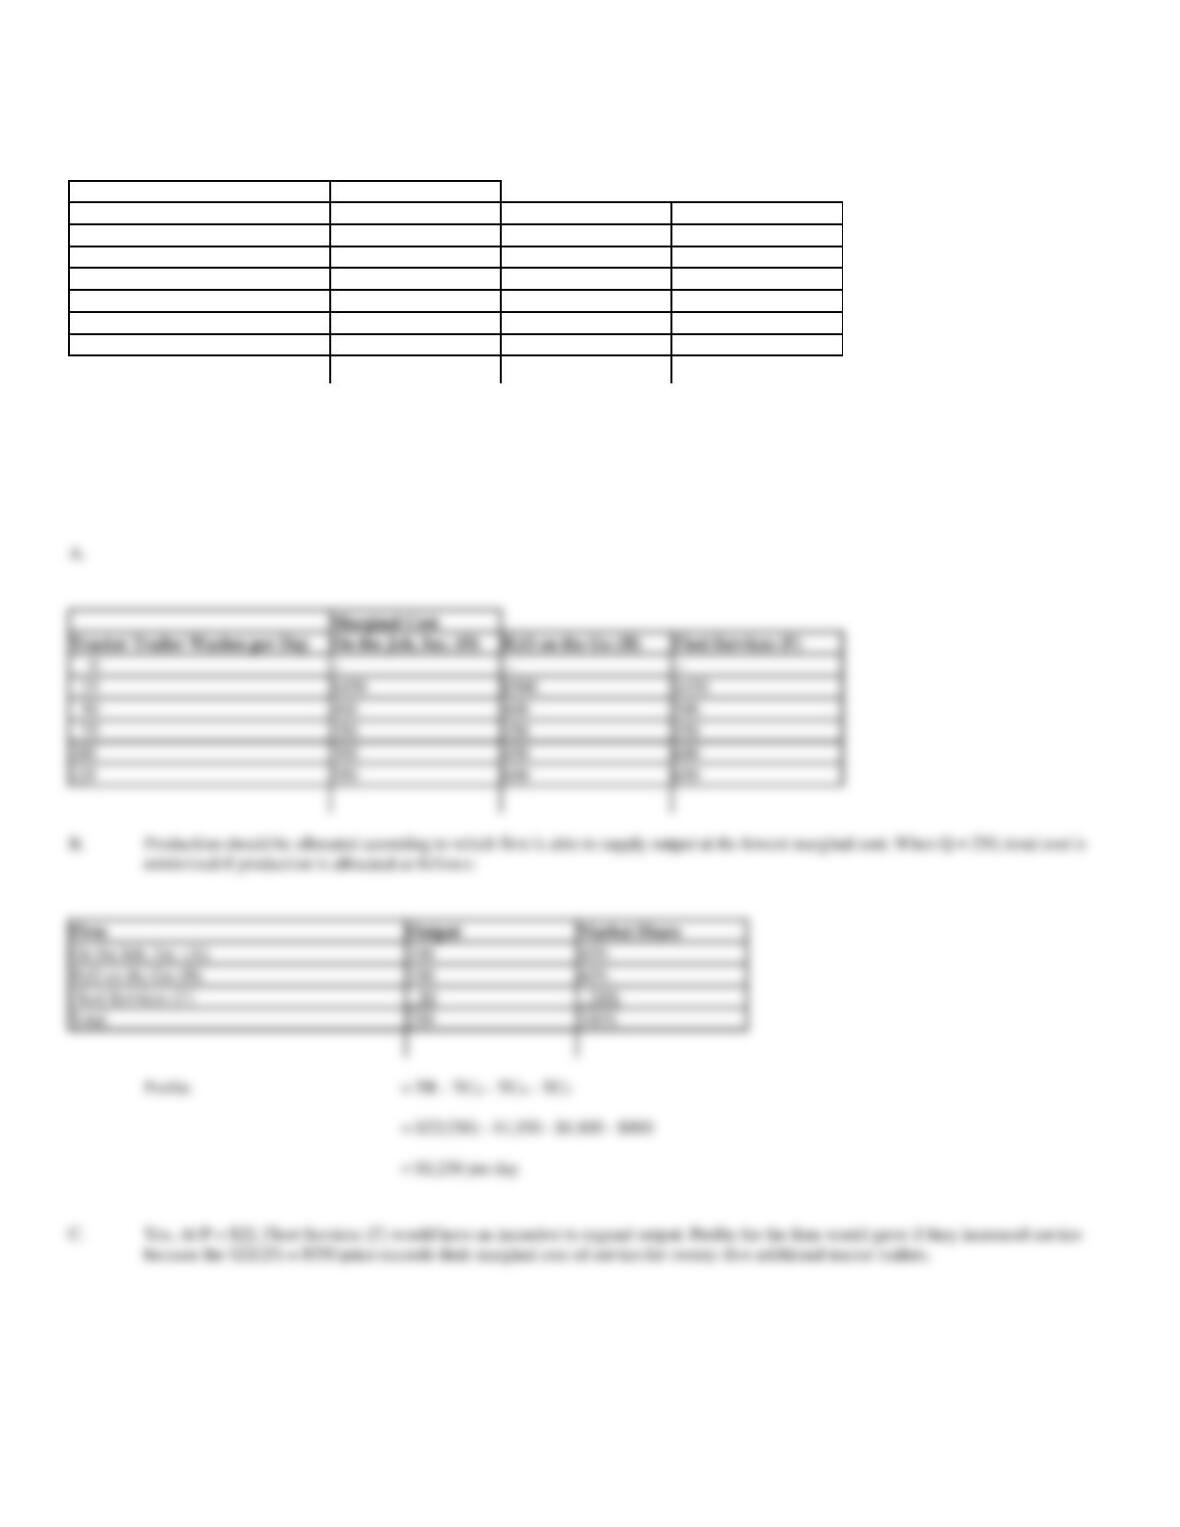
Total Cost
Tractor Trailer Washes per Day
On the Job, Inc. (O)
H2O on the Go (H)
Fleet Services (F)
0
$ 50
$ 100
$ 0
25
500
600
450
50
900
1,000
900
75
1,250
1,350
1,450
100
1,550
1,800
2,050
125
2,100
2,400
2,700
A.
Construct a table showing the marginal cost of production per firm.
B.
From the data in part A, determine an optimal allocation of output and maximum profits if the cartel sets Q = 250 and P = $22.
C.
Is there an incentive for individual members to cheat by expanding output when the cartel sets Q = 250 and P = $22?
A.
Marginal Cost
Tractor Trailer Washes per Day
On the Job, Inc. (O)
H2O on the Go (H)
Fleet Services (F)
0
25
$450
$500
$450
50
400
400
500
75
100
300
450
600
125
550
600
650
On the Job, Inc. (A)
40%
40%
Fleet Services (F)
50
20%
Total
100%
Profits
= TR – TCO – TCH – TCF
= $22(250) – $1,550 – $1,800 – $900
= $1,250 per day
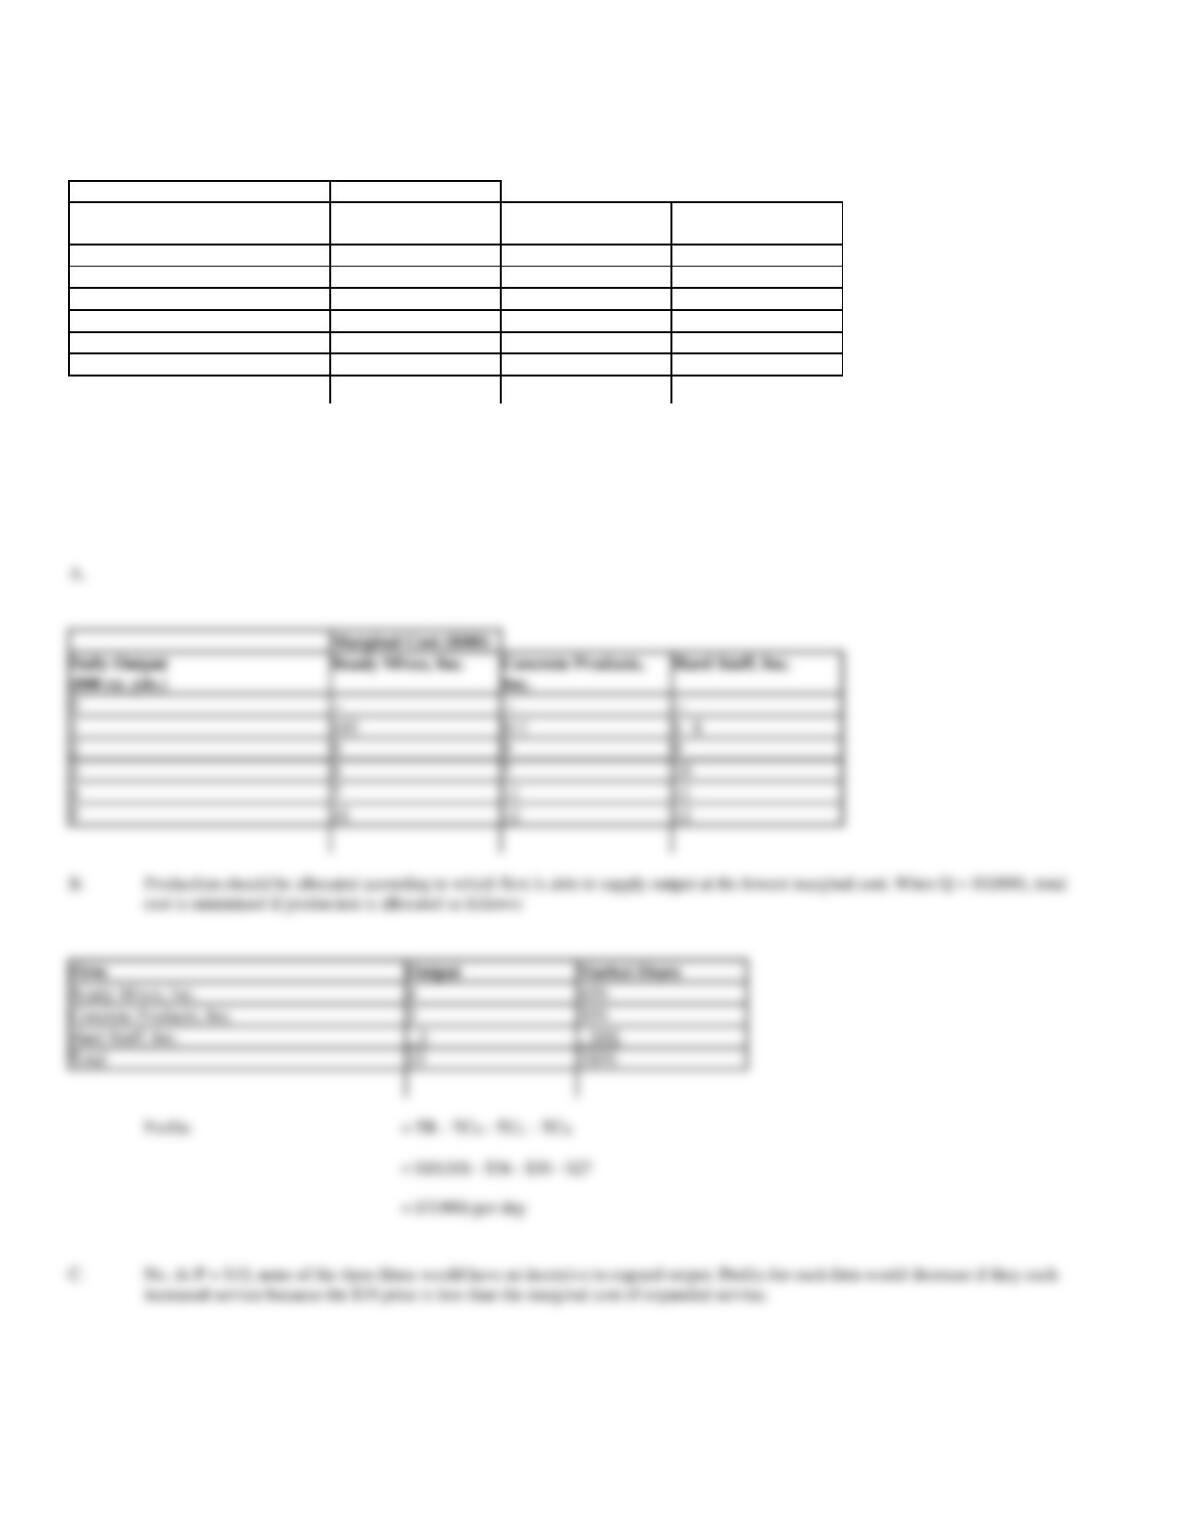
43. Cartel Pricing. An illegal cartel has been formed by three leading ready-mix cement suppliers in the local
market. Total costs at various levels of service per day are as follows:
Total Cost ($000)
Daily Output
(000 cu. yds.)
Ready Mixes, Inc.
Concrete Products,
Inc.
Hard Stuff, Inc.
0
$ 2
$ 3
$ 0
1
12
14
8
2
21
23
17
3
29
30
27
4
36
41
38
5
47
53
50
A.
Construct a table showing the marginal cost of production per firm.
B.
From the data in part A, determine an optimal allocation of output and maximum profits if the cartel sets Q = 10(000) and P = $10.
C.
Is there an incentive for individual members to cheat by expanding output when the cartel sets Q = 10(000) and P = $9?
Marginal Cost ($000)
0
1
$10
$11
$ 8
2
9
9
9
3
8
7
10
4
7
11
11
5
11
12
12
Firm
Output
Market Share
Ready Mixes, Inc.
4
40%
Concrete Products, Inc.
3
30%
Hard Stuff, Inc.
3
30%
Total
10
100%
Profits
= TR – TCR – TCC – TCH
= $10(10) – $36 – $30 – $27
= $7(000) per day

44. Kinked Demand. VoIP Telephone, Inc., provides local and long distance telephone service in the Toledo,
Ohio market. The company faces the following segmented demand and marginal revenue curves for its service:
Over the range of 0 to 25(000) customers per month:
P1
= $6 – $0.04Q
MR1
= TR1/ Q = $6 – $0.08Q
When output exceeds 25(000) customers per month:
P2
= $8 – $0.12Q
MR2
= TR2/ Q = $8 – $0.24Q
The company’s total and marginal cost functions are as follows:
TC
= $2.50 + $1.50Q + $0.02Q2
MC
= TC/ Q = $1.50 + $0.04Q
where P is price (in dollars), Q is output (in thousands), and TC is total cost (in thousands of dollars).
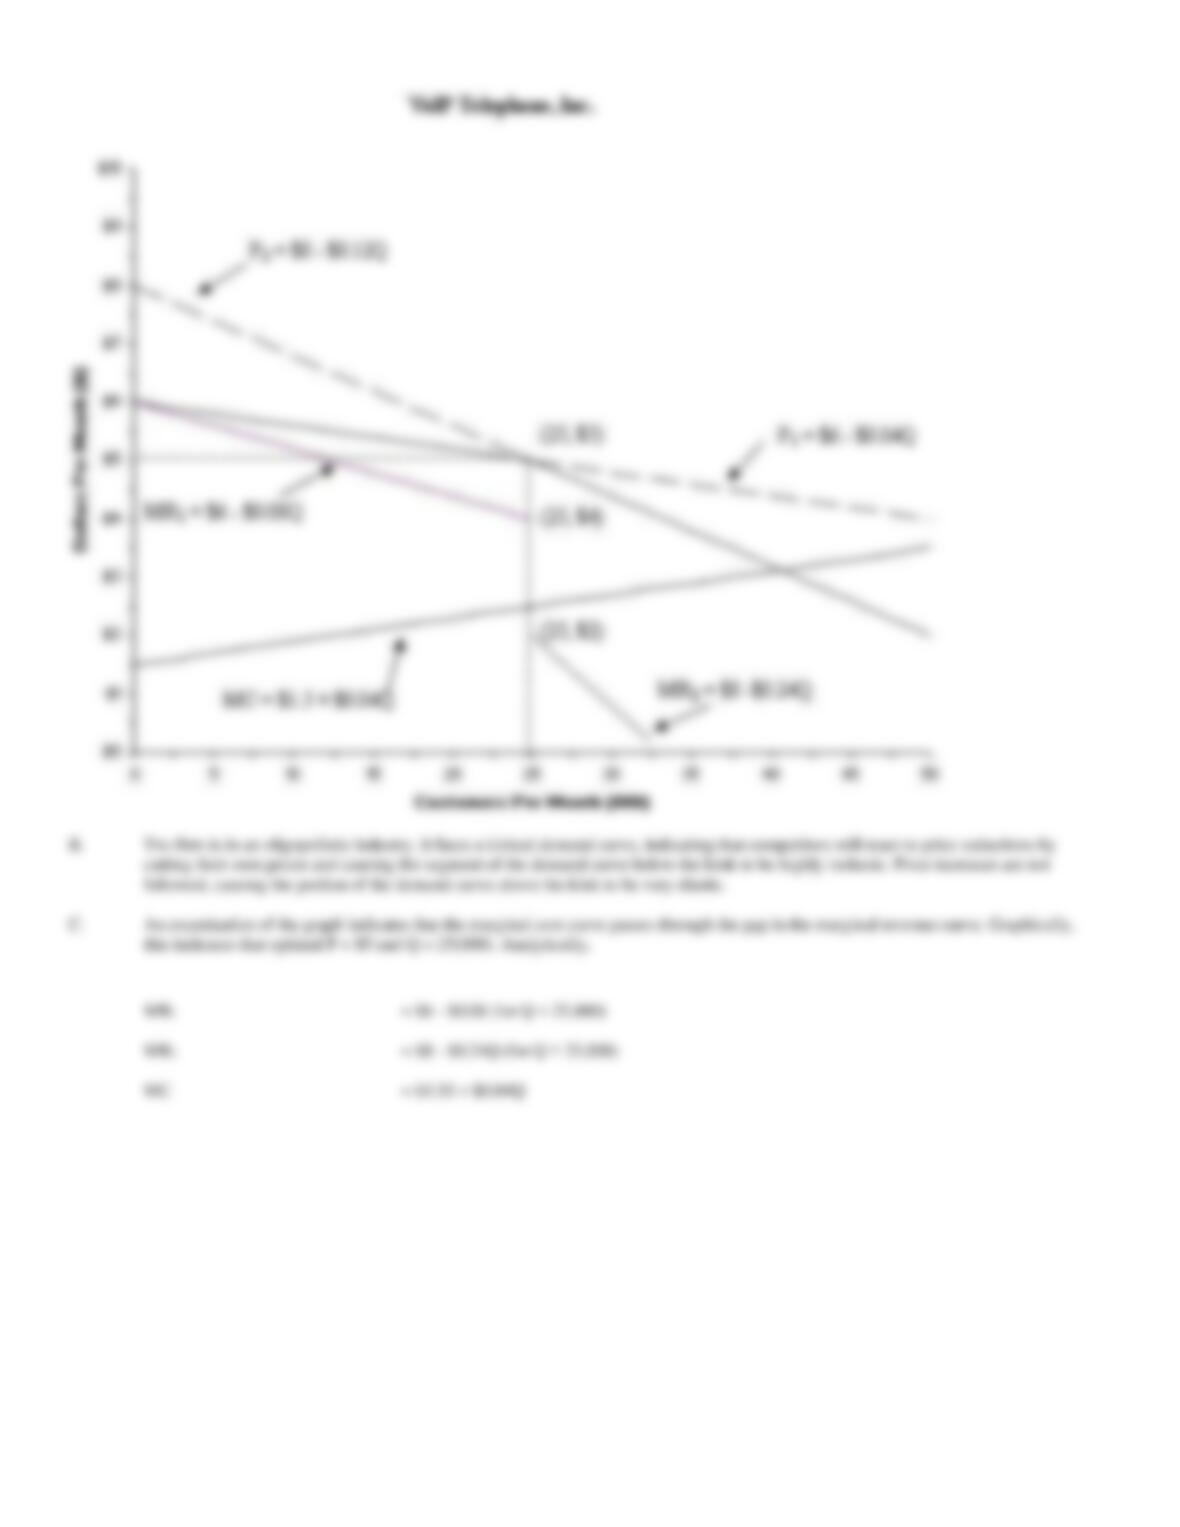
A.
Graph the demand, marginal revenue, and marginal cost curves.
B.
How would you describe the market structure of this industry? Explain why the demand curve takes the shape indicated above.
C.
Calculate price, output, and profits at the profit-maximizing activity level.
D.
How much could marginal costs rise before the optimal price would increase? How much could they fall before the optimal price would
decrease?
45. Kinked Demand. Brooklyn Broadband, Inc., is a local provider of broadband access to the Internet in
Brooklyn, New York. Brooklyn faces the following segmented demand and marginal revenue curves for its
residential service:
Over the range of 0 to 50(000) customers per month:
P1
= $15 – $0.05Q
MR1
= TR1/ Q = $15 – $0.1Q
When output exceeds 50(000) customers per month:
P2
= $22.50 – $0.2Q
MR2
= TR2/ Q = $22.50 – $0.4Q
The company’s total and marginal cost functions are as follows:
TC
= $7.50 + $1.50Q + $0.025Q2
MC
= TC/ Q = $1.50Q + $0.05Q
At P = $5 and Q = 25:
p
= TR – TC
= $5(25) – $2.50 – $1.50(25) – $0.02(252)
= $72.5(000) or $72,500 per month
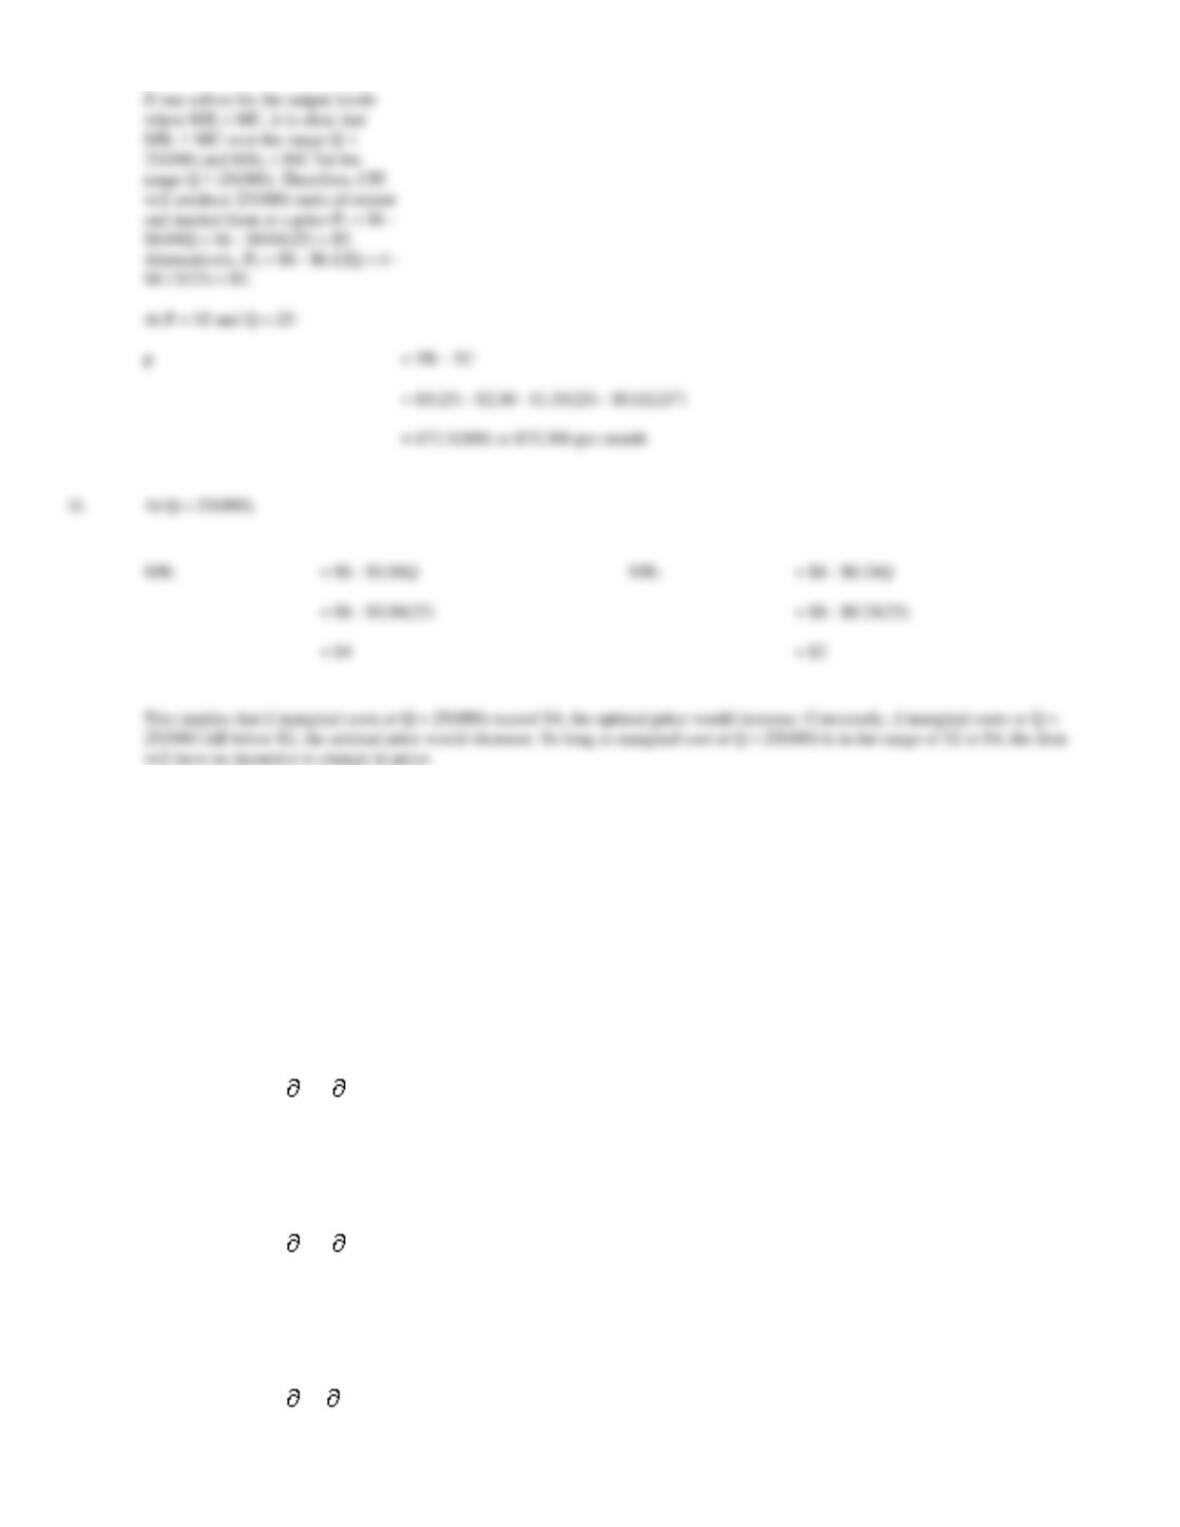
At Q = 25(000),
= $6 – $0.08Q
= $8 – $0.24Q
= $6 – $0.08(25)
= $8 – $0.24(25)
= $4
= $2
where P is price (in dollars), Q is output (in thousands), and TC is total cost (in thousands of dollars).
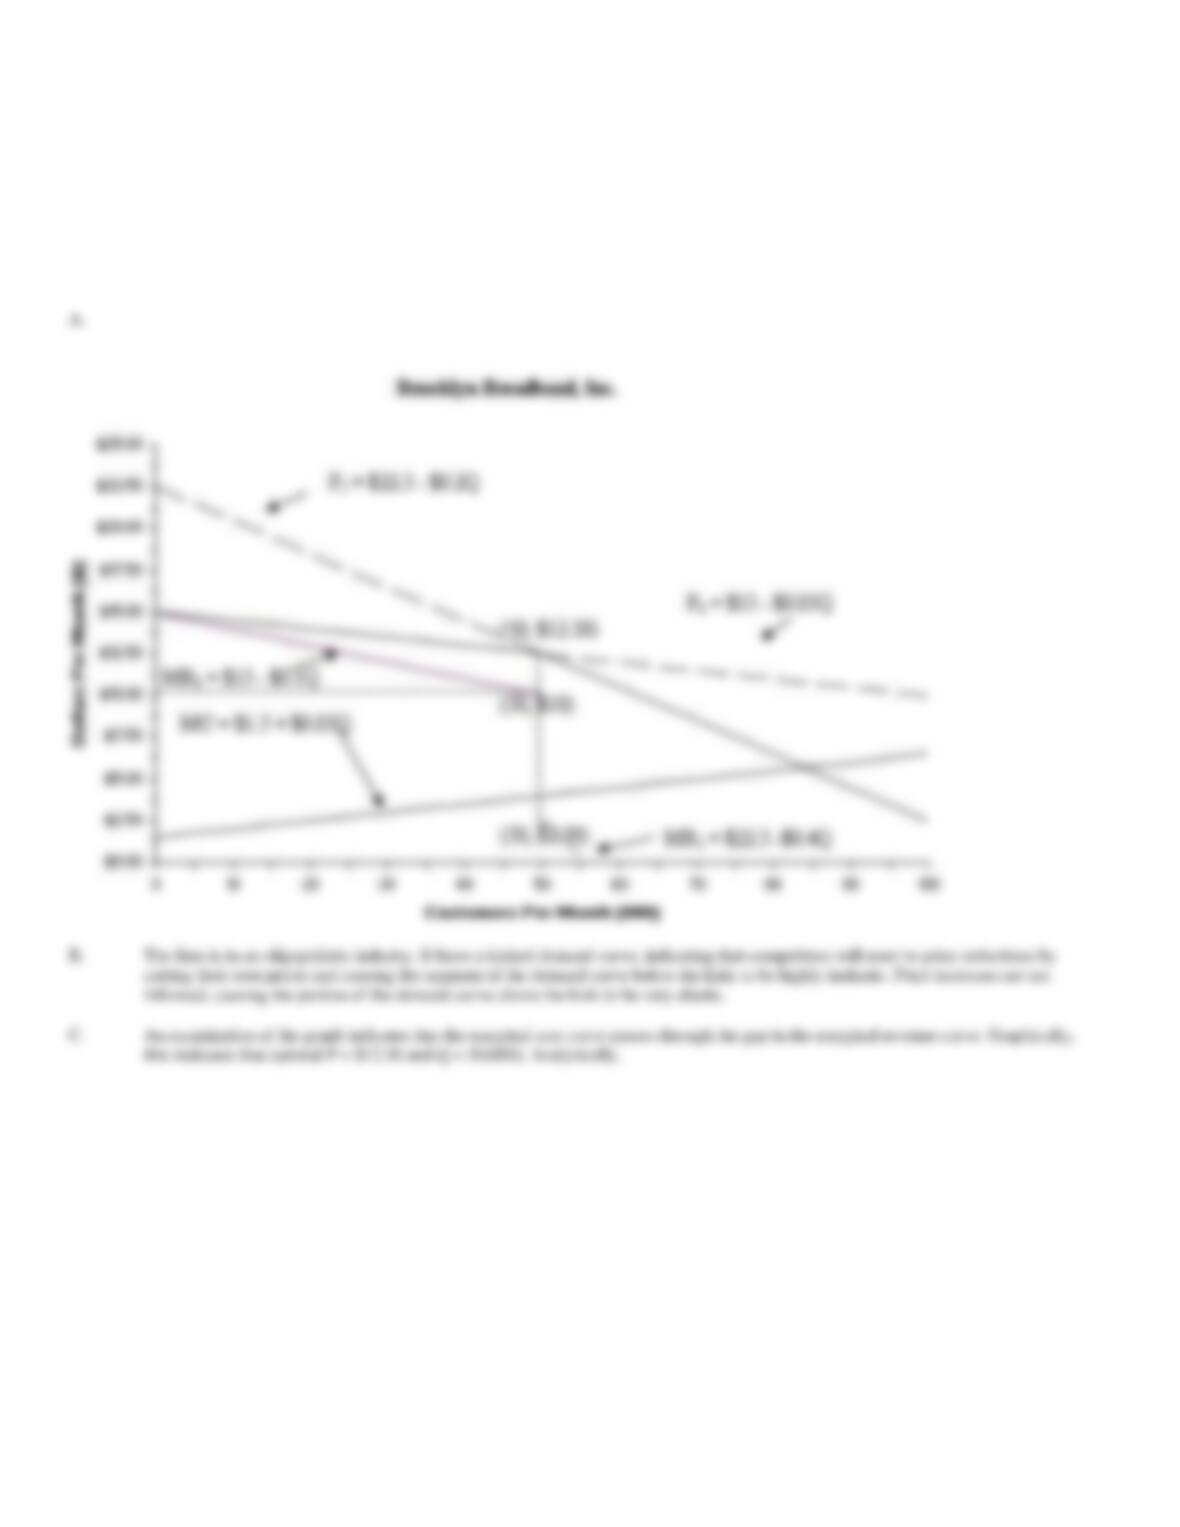
A.
Graph the demand, marginal revenue, and marginal cost curves.
B.
How would you describe the market structure of this industry? Explain why the demand curve takes the shape indicated above.
C.
Calculate price, output, and profits at the profit-maximizing activity level.
D.
How much could marginal costs rise before the optimal price would increase? How much could they fall before the optimal price would
decrease?
A.
followed, causing the portion of the demand curve above the kink to be very elastic.
46. Firm Supply. Iota Facsimile Products, Ltd., and JustheFax, Inc. are domestic suppliers of
moderately-priced facsimile machines. Given the vigor of domestic and foreign competition, P = MR in this
market. Marginal cost relations for each firm are:
MCI
= $625 + $0.01QI
(Iota Facsimile)
MCJ
= $975 + $0.0025QJ
(JustheFax)
where Q is output in units, and MC > AVC for each firm.
A.
What is the minimum price necessary in order for each firm to supply output?
B.
Determine the supply curve for each firm.
C.
Based on the assumption that P = PI = PJ, determine industry supply curves when P < $975 and P > $975.
MR1
= $15 – $0.1Q (for Q < 50(000))
MR2
= $22.50 – $0.4Q (for Q > 50(000))
MC
= $1.50 + $0.05Q
$0.2Q = $22.50 – $0.2(50) = $12.50.
At P = $12.50 and Q = 50:
p
= TR – TC
= $480(000) or $480,000
D.
At Q = 50(000),
MR1
= $15 – $0.1Q = $15 – $0.1(50) = $10
MR2
= $22.50 – $0.4Q = $22.50 – $0.4(50) = $2.50
47. Firm Supply. Wilson Fabricators, Inc., and Johnson City Metalworks, Ltd., are domestic suppliers of
backyard basketball goals. Given the vigor of domestic competition, P = MR in this market. Marginal cost
relations for each firm are:
MCW
= $25 + $0.001QW
(Wilson Fabricators)
MCJ
= $75 + $0.00025QJ
(Johnson City Metalworks)
The supply curve for each company is found by setting P = MC:
= MCI = $625 + $0.01QI
= MCJ = $975 + $0.0025QJ
When P < $975 only Iota can profitably supply output, so this firm’s supply curve becomes the industry supply curve:
P
= $625 + $0.01Q
Q
Q
= QI + QJ
P
= $905 + $0.002Q (When P > $975)
where Q is output in units, and MC > AVC for each firm.
A.
What is the minimum price necessary in order for each firm to supply output?
B.
Determine the supply curve for each firm.
C.
Based on the assumption that P = PW = PJ, determine industry supply curves when P < $75 and P > $75.
= MCW = $25 + $0.001QW
C.
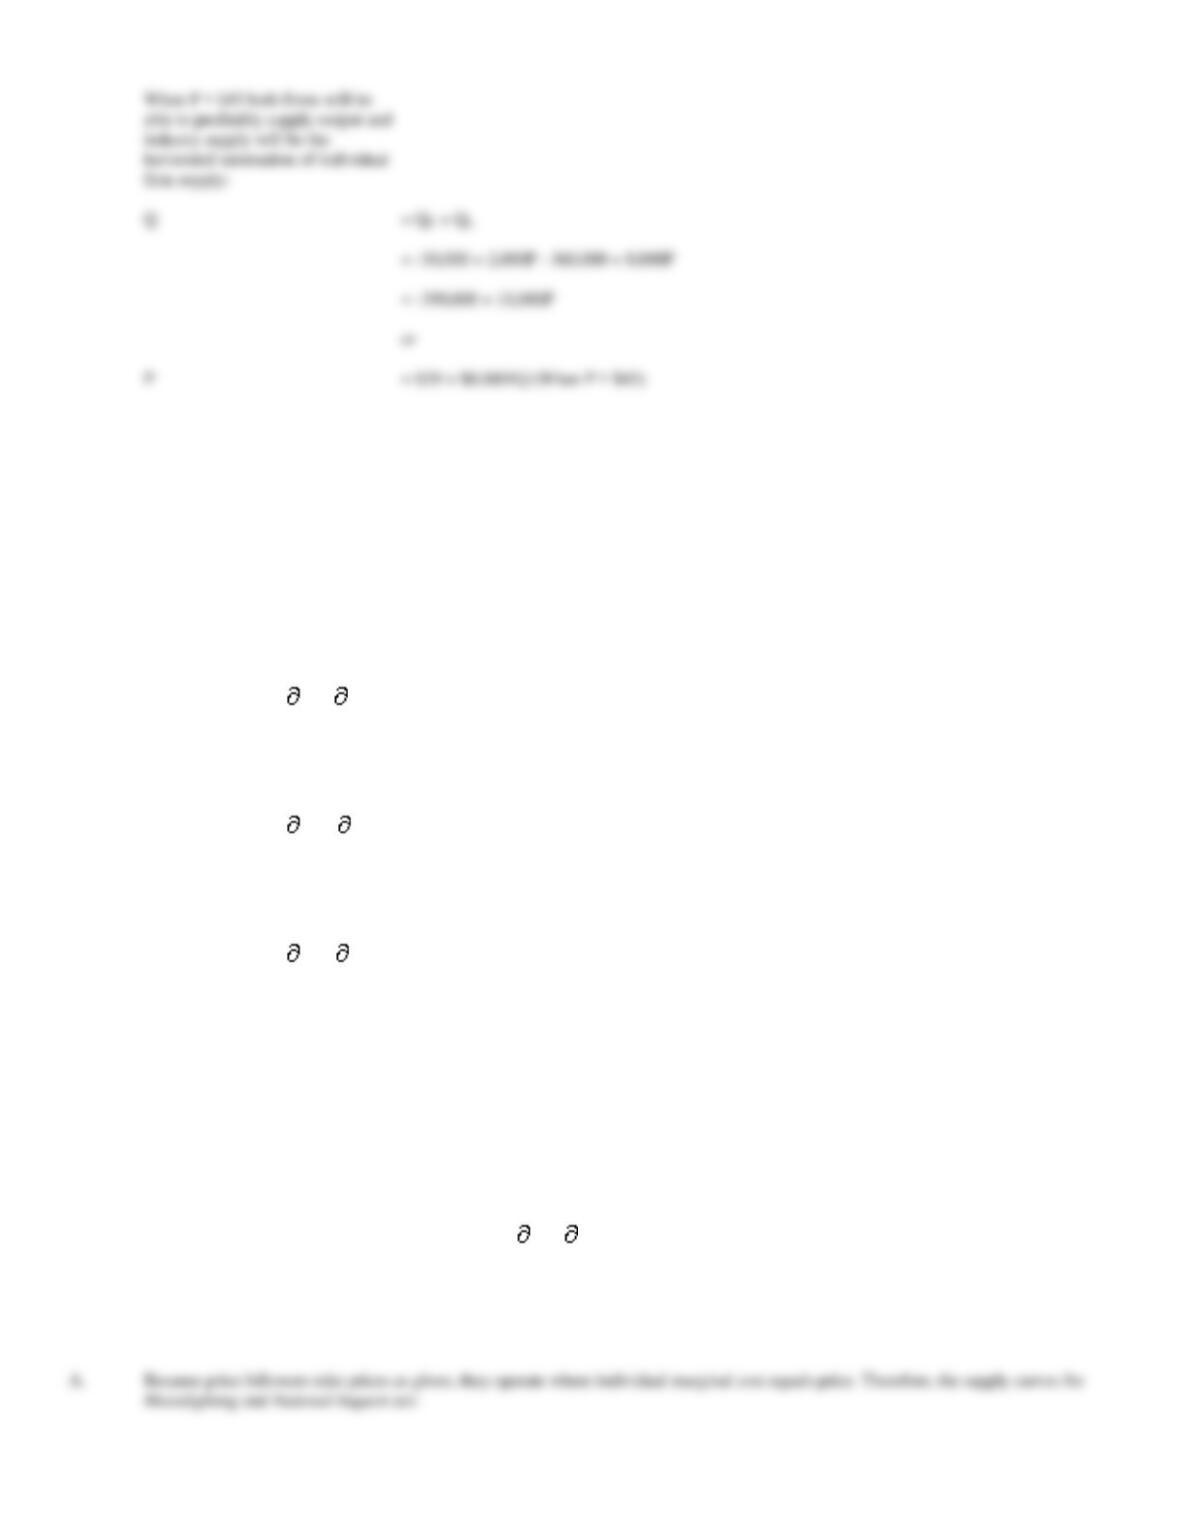
When P < $75 only Wilson can profitably supply output, so this firm’s supply curve becomes the industry supply curve:
P
= $25 + $0.001Q
Q
Q
= QW + QJ
P
= $65 + $0.0002Q (When P > $75)
48. Firm Supply. Common Electric Products, Inc., and Lighthouse Manufacturing, Inc., are domestic suppliers
of halogen gas light bulbs used in roadside lamps. Given the vigor of domestic and foreign competition, P = MR
in this market. Marginal cost relations for each firm are:
MCC
= $15 + $0.0005QC
(Common Electric Products, Inc.)
MCL
= $45 + $0.000125QL
(Lighthouse Manufacturing, Inc.)
where Q is output in units, and MC > AVC for each firm.
A.
What is the minimum price necessary in order for each firm to supply output?
B.
Determine the supply curve for each firm.
C.
Based on the assumption that P = PC = PL, determine industry supply curves when P < $45 and P > $45.
market.
B.
The supply curve for each company is found by setting P = MC:
= MCC = $15 + $0.0005QC
= MCL = $45 + $0.000125QL
C.
When P < $45 only Common Electric can profitably supply output, so this firm’s supply curve becomes the industry supply curve:
P
= $15 + $0.0005Q
Q
49. Price Leadership. Leading People Magazine is a dominant price leading firm in the popular celebrity news
magazine market. Moonlighting and National Inquest are competing news magazines that address the same
audience. Total and marginal cost relations for each magazine are:
Leading People
TCL
= $12,500 – $1QL + $0.000005QL2
MCL
= TCL/ QL = -$1 + $0.00001QL
Moonlighting
TCM
= $10,000 + $0.5QM + $0.00005QM2
MCM
= TCM/ QM = $0.5 + $0.0001QM
National Inquest
TCN
= $50,000 + $1.25QN + $0.000025QN2
MCN
= TCN/ QN = $1.25 + $0.00005QN
and the industry demand curve is:
QD
= 170,000 – 20,000P
Assume throughout this problem that Moonlighting and National Inquest are perfect substitutes for Leading People magazine.
A.
Determine the supply curves for the Moonlighting and National Inquest magazines, assuming the firms operate as price takers.
B.
What is the demand curve faced by Leading People?
C.
Calculate Leading People profit maximizing price and output levels. (Hint: Leading People‘s total revenue and marginal revenue
functions are TRL = $4QL – $0.00002QL2 and MRL = TRL/ QL = $4 – $0.00004QL.)
D.
Calculate the profit maximizing output levels for the Moonlighting and National Inquest magazines.
E.
Is the market for these three magazines in short-run equilibrium?
Q
= QC + QL
= -30,000 + 2,000P – 360,000 + 8,000P
= -390,000 + 10,000P
P
= $39 + $0.0001Q (When P > $45)
50. Price Leadership. Biking Magazine is a dominant price leading firm in the popular bicycle magazine
market. Wheel Deal and Free Wheel are competing magazines that address the same audience. Total and
marginal cost relations for each magazine are:
Biking
TCB
= $17,500 – $0.50QB + $0.000005QB2
MCB
= TCB/ QB = -$0.50 + $0.00001QB
Wheel Deal
TCW
= $15,000 + $2QW + $0.00005QW2
MCW
= TCW/ QW = $2 + $0.0001QW
Free Wheel
TCF
= $40,000 + $1.875QF + $0.0000125QF2
MCF
= TCF/ QF = $1.875 + $0.000025QF
and the industry demand curve is:
QD
= 305,000 – 50,000P.
Assume throughout this problem that Wheel Deal and Free Wheel are perfect substitutes for Biking magazine.
A.
Determine the supply curves for the Wheel Deal and Free Wheel magazines, assuming the firms operate as price takers.
B.
What is the demand curve faced by Biking?
C.
Calculate Biking profit maximizing price and output levels. (Hint: Biking‘s total revenue and marginal revenue functions are TRB =
$4QB – $0.00001QB2 and MRB = ¶TRB/ ¶QB = $4 – $0.00002QB.)
D.
Calculate the profit maximizing output levels for the Wheel Deal and Free Wheel magazines.
E.
Is the market for these three magazines in short-run equilibrium?
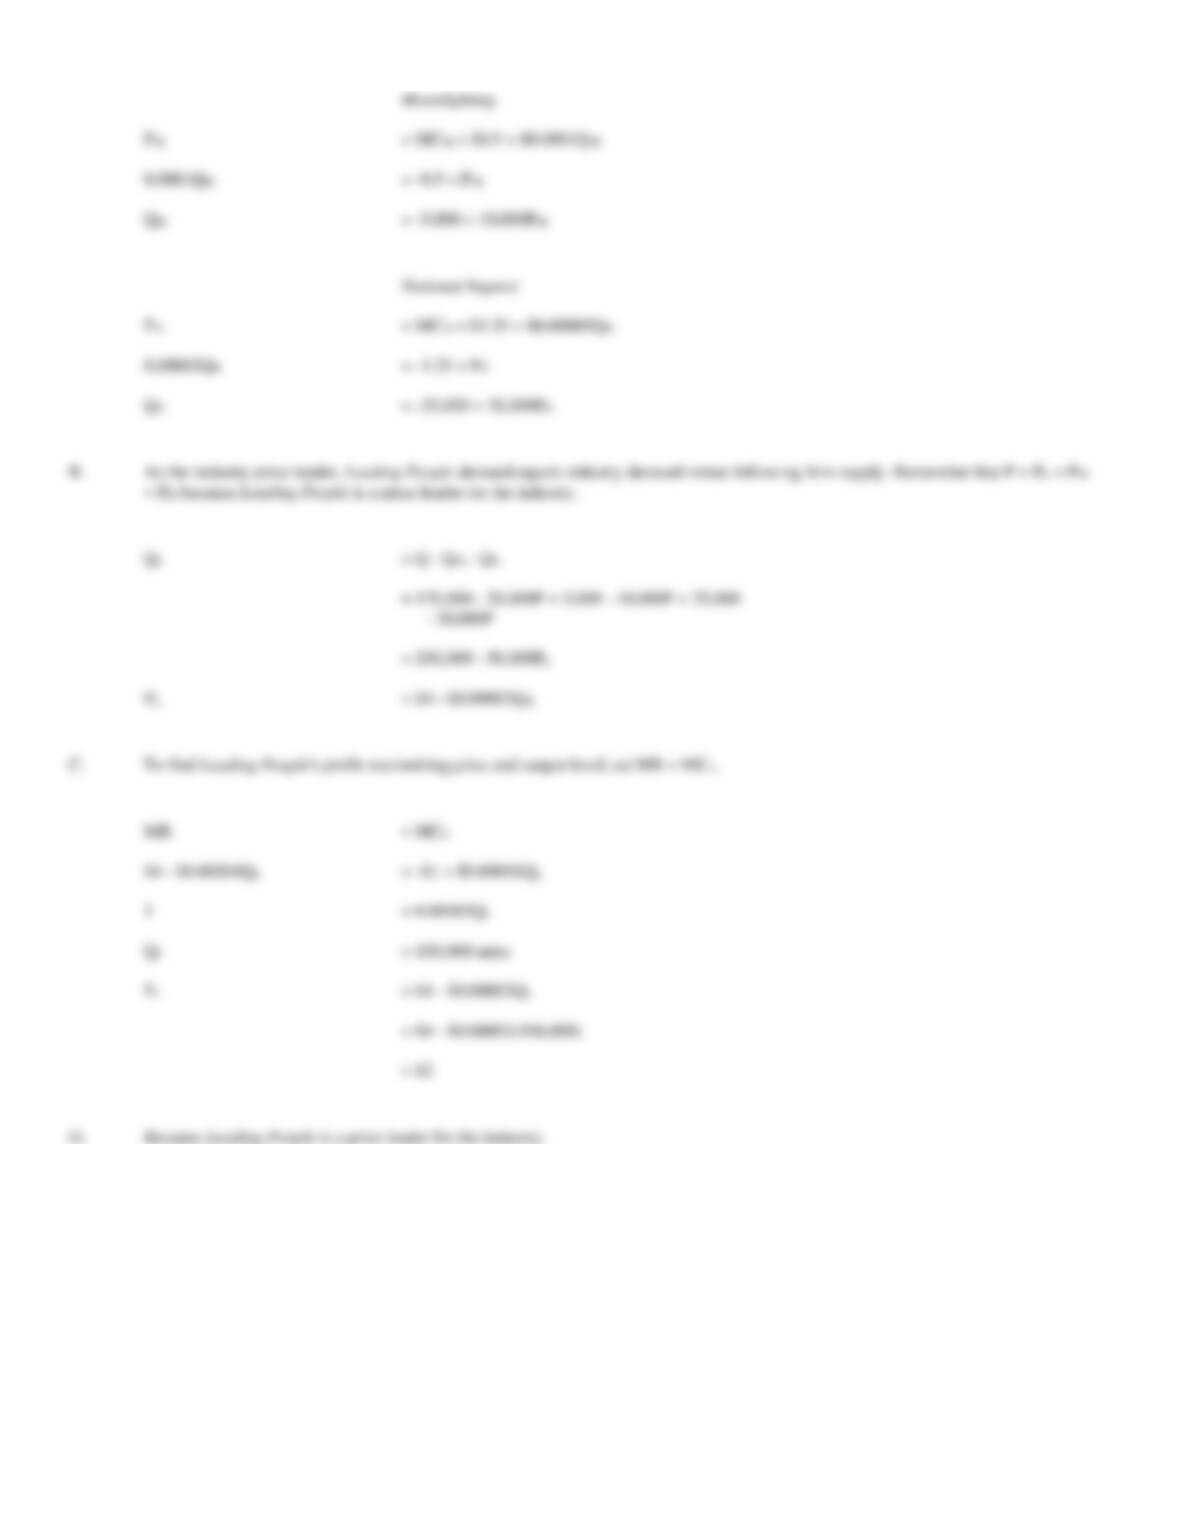
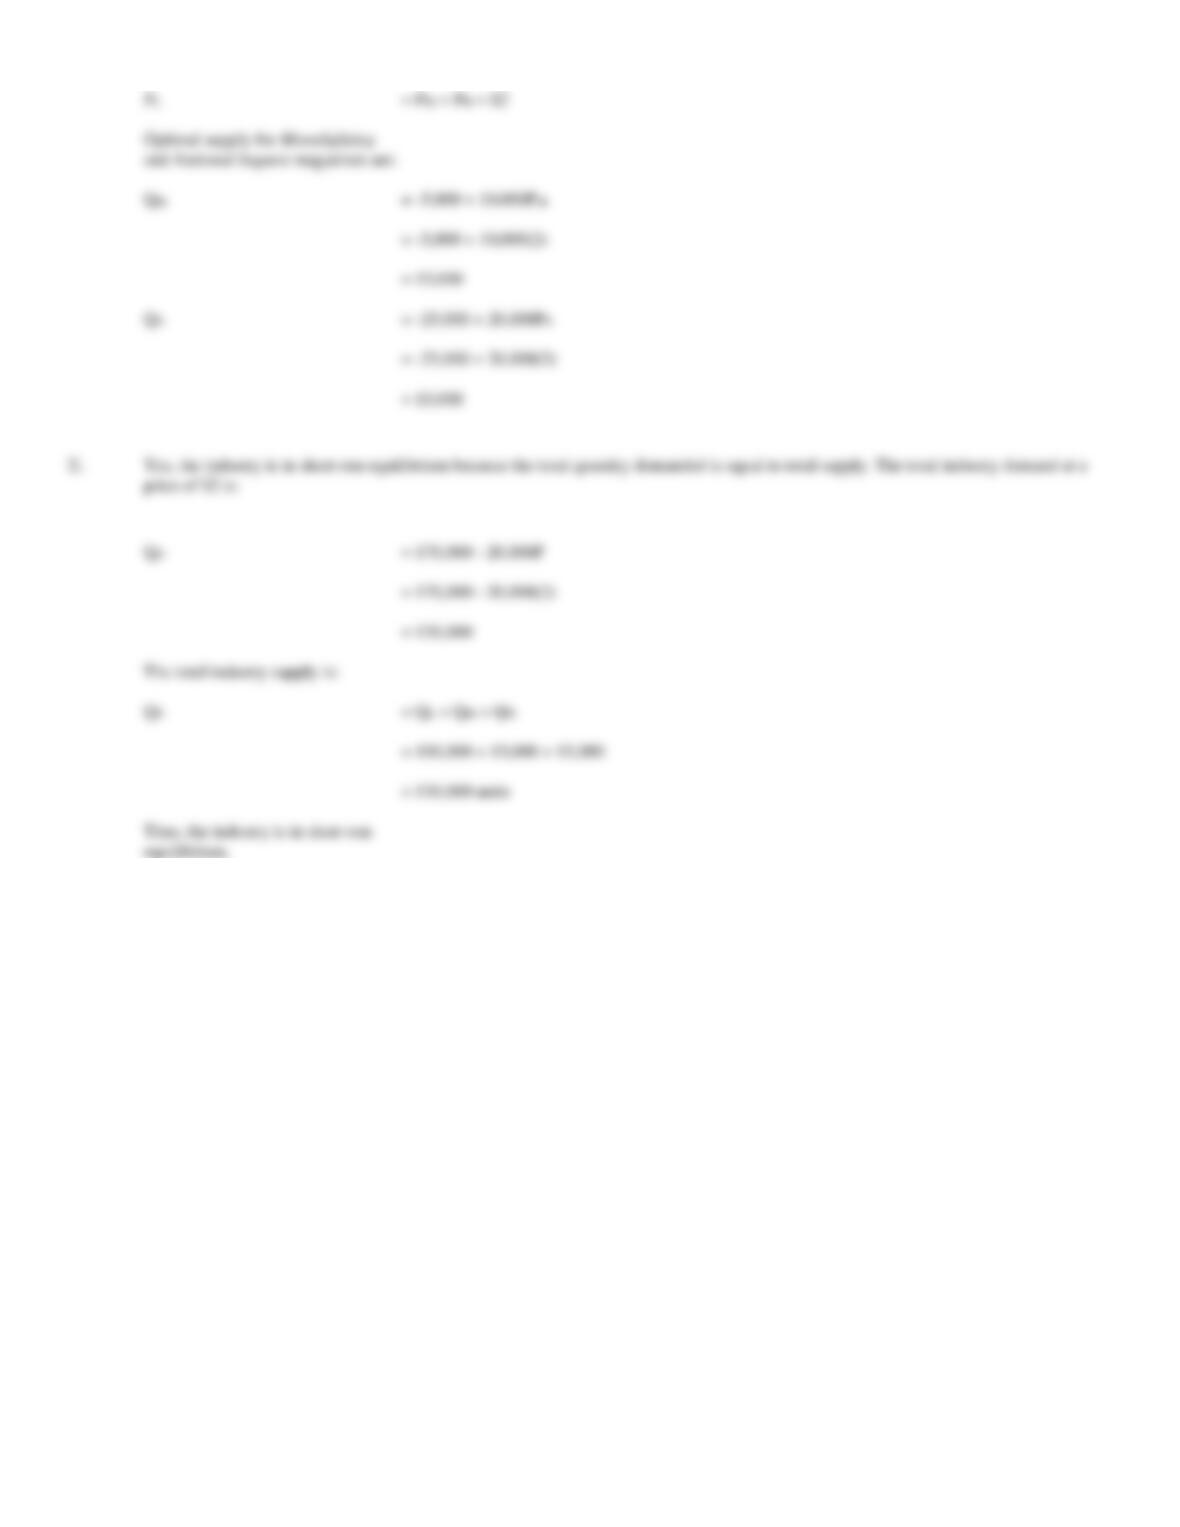
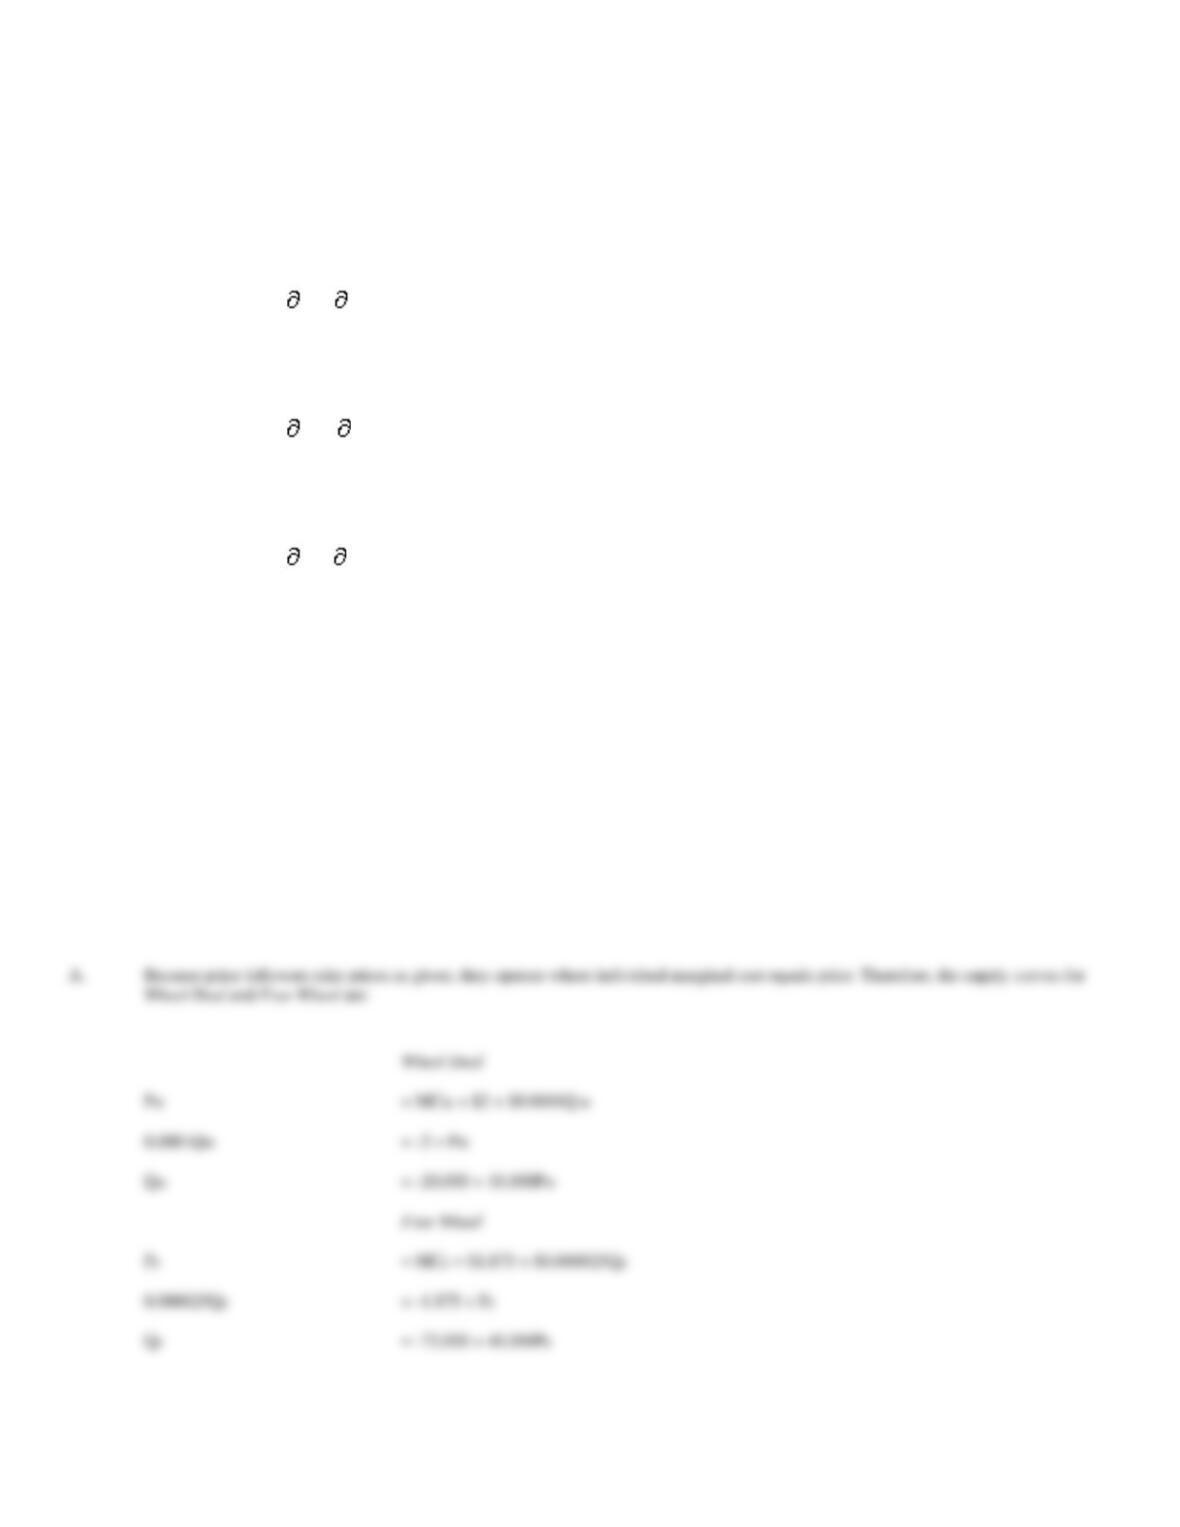
Because price followers take prices as given, they operate where individual marginal cost equals price. Therefore, the supply curves for
Wheel Deal
= MCW = $2 + $0.0001Q W
0.0001QW
= -2 + PW
QW
= -20,000 + 10,000PW
Free Wheel
= MCF = $1.875 + $0.000025QF
0.000025QF
= -1.875 + PF