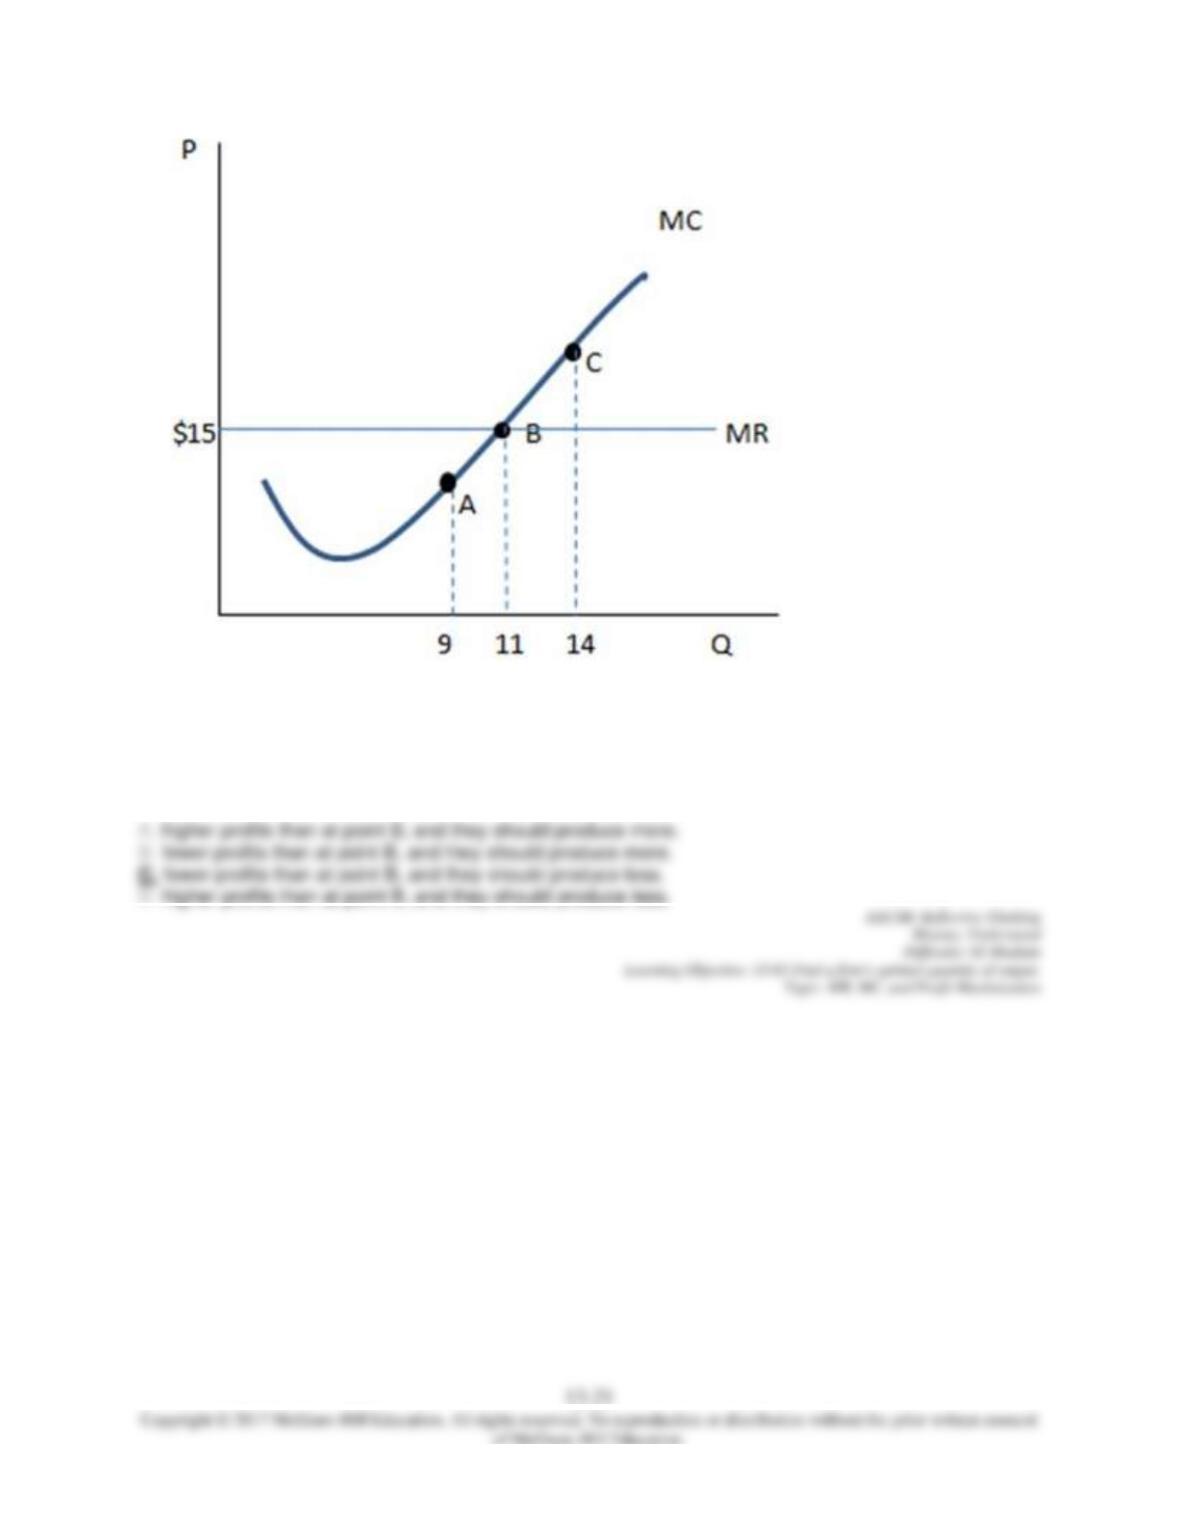
71.
According to the graph shown, at point C the firm is earning:
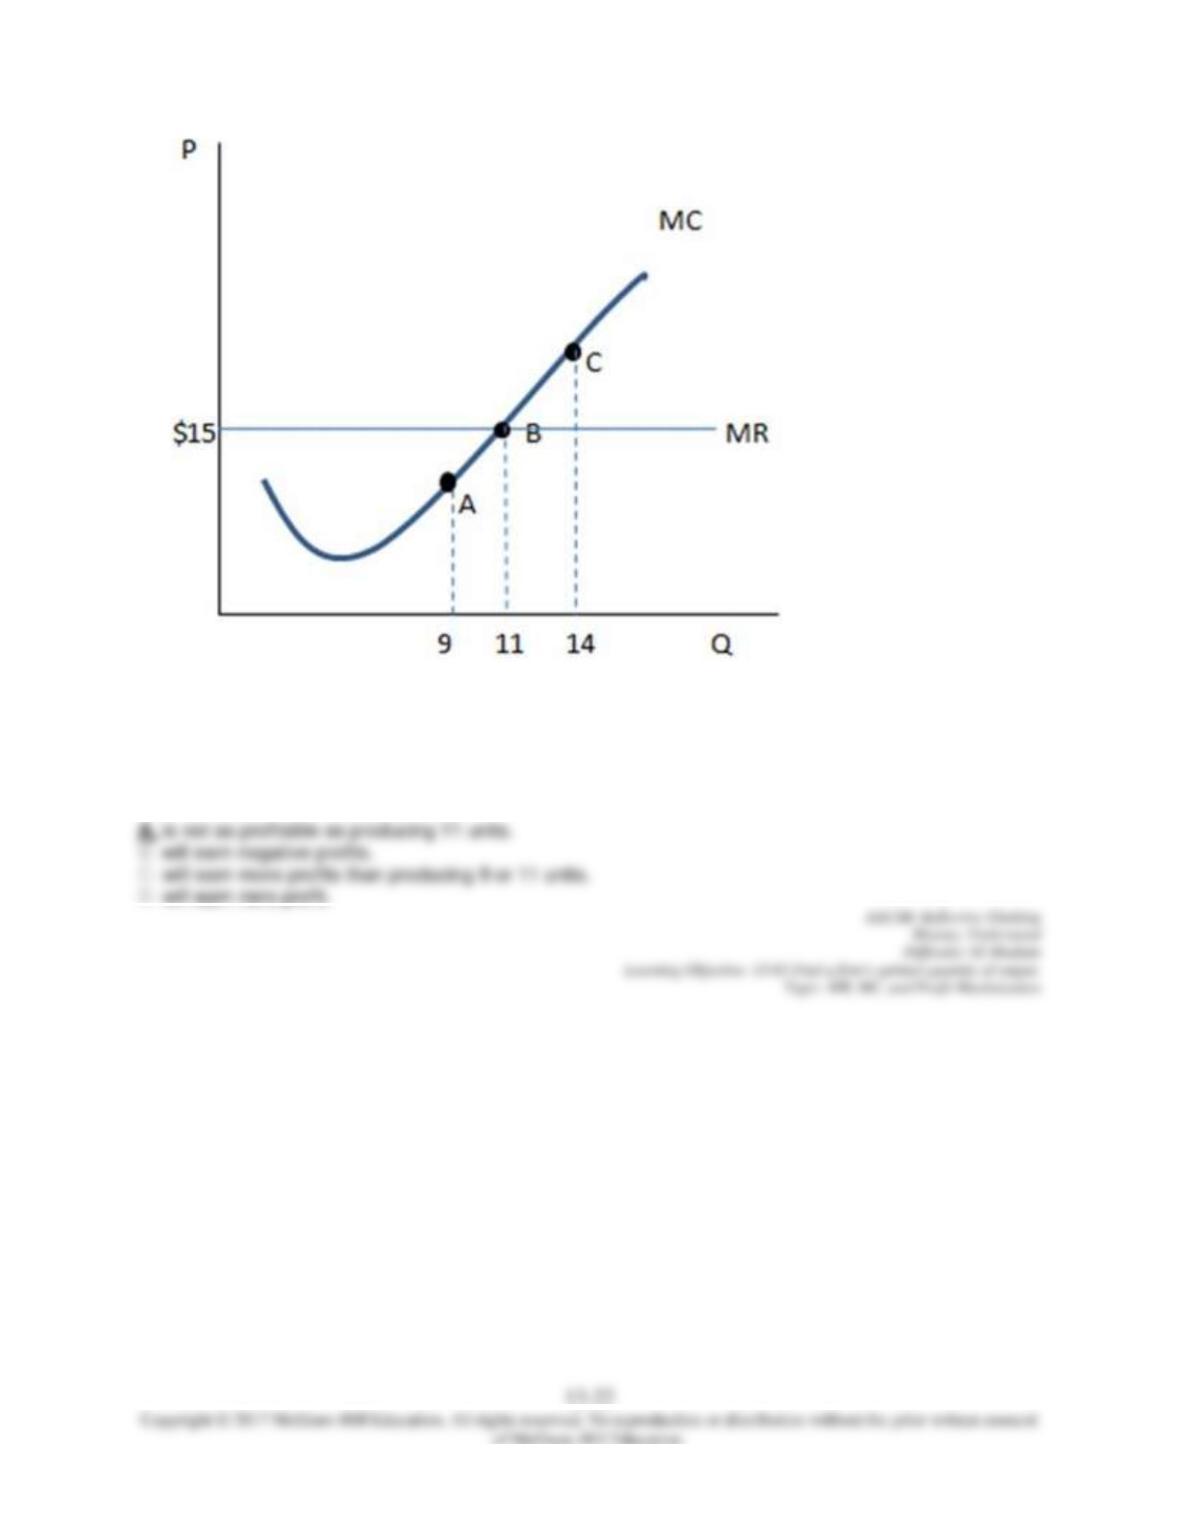
72.
According to the graph shown, producing 14 units:
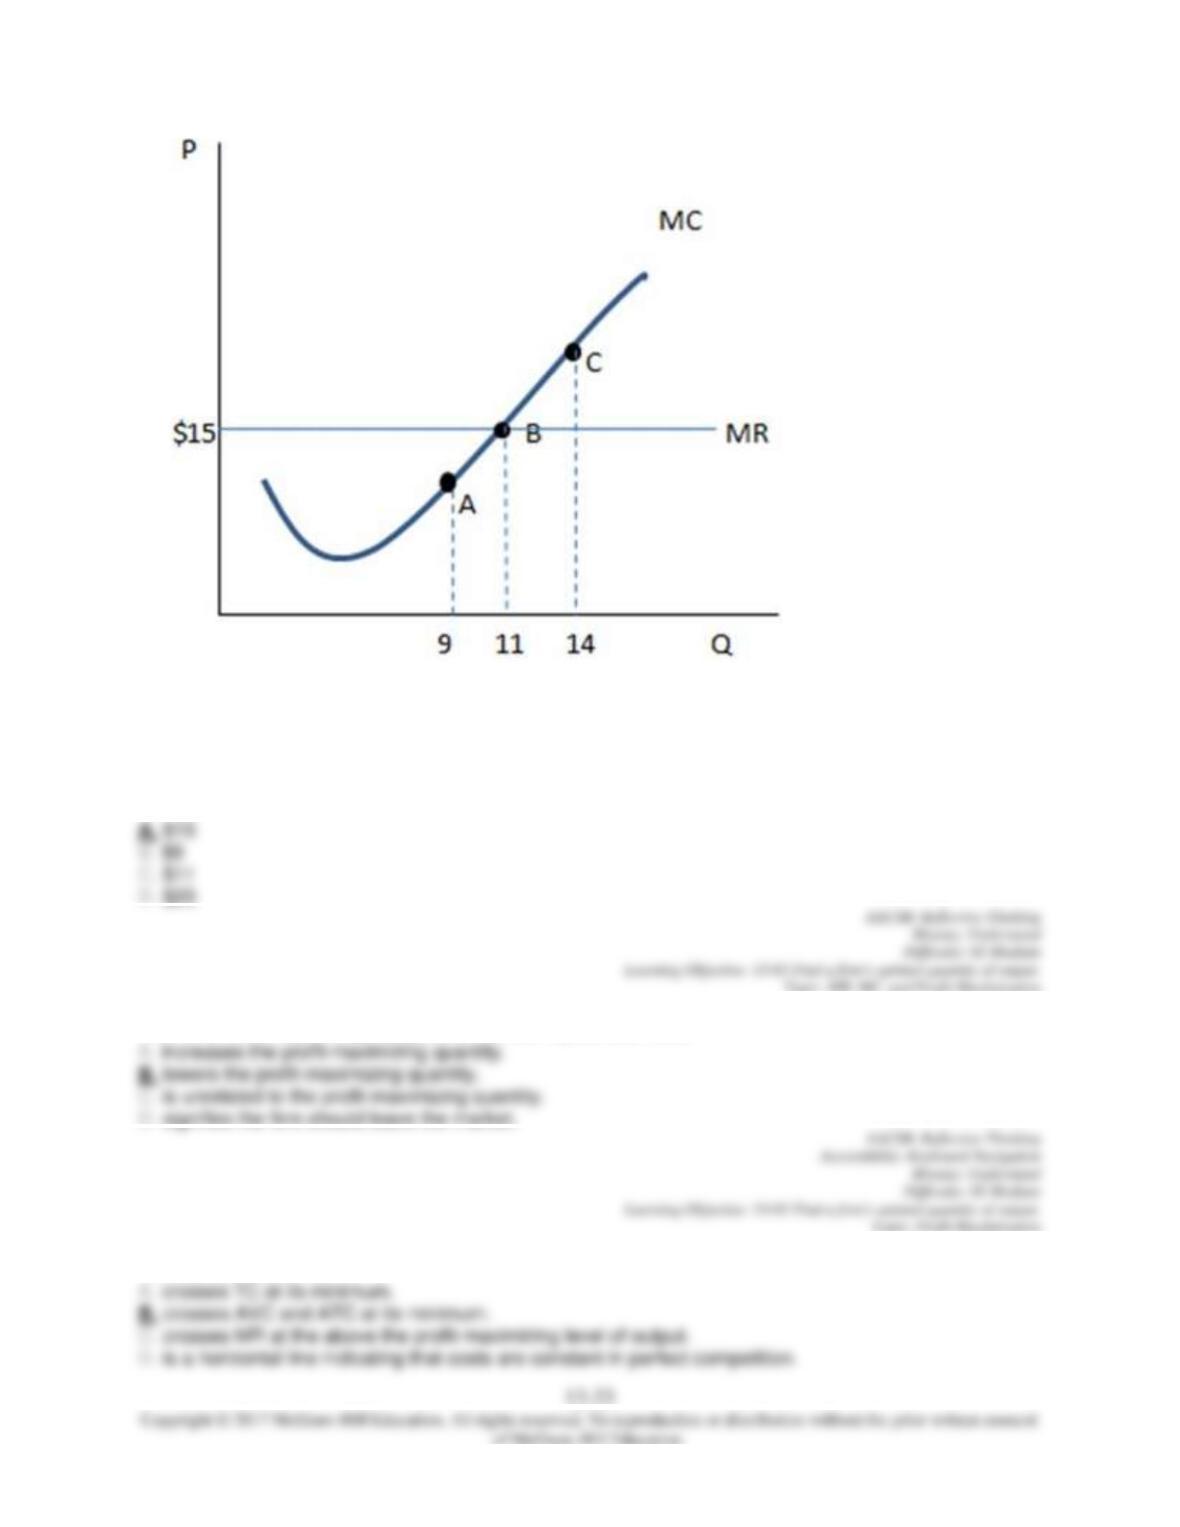
73.
According to the graph shown, the market price is:
74. For a firm in a perfectly competitive market, a price decrease:
75. The MC of a firm:
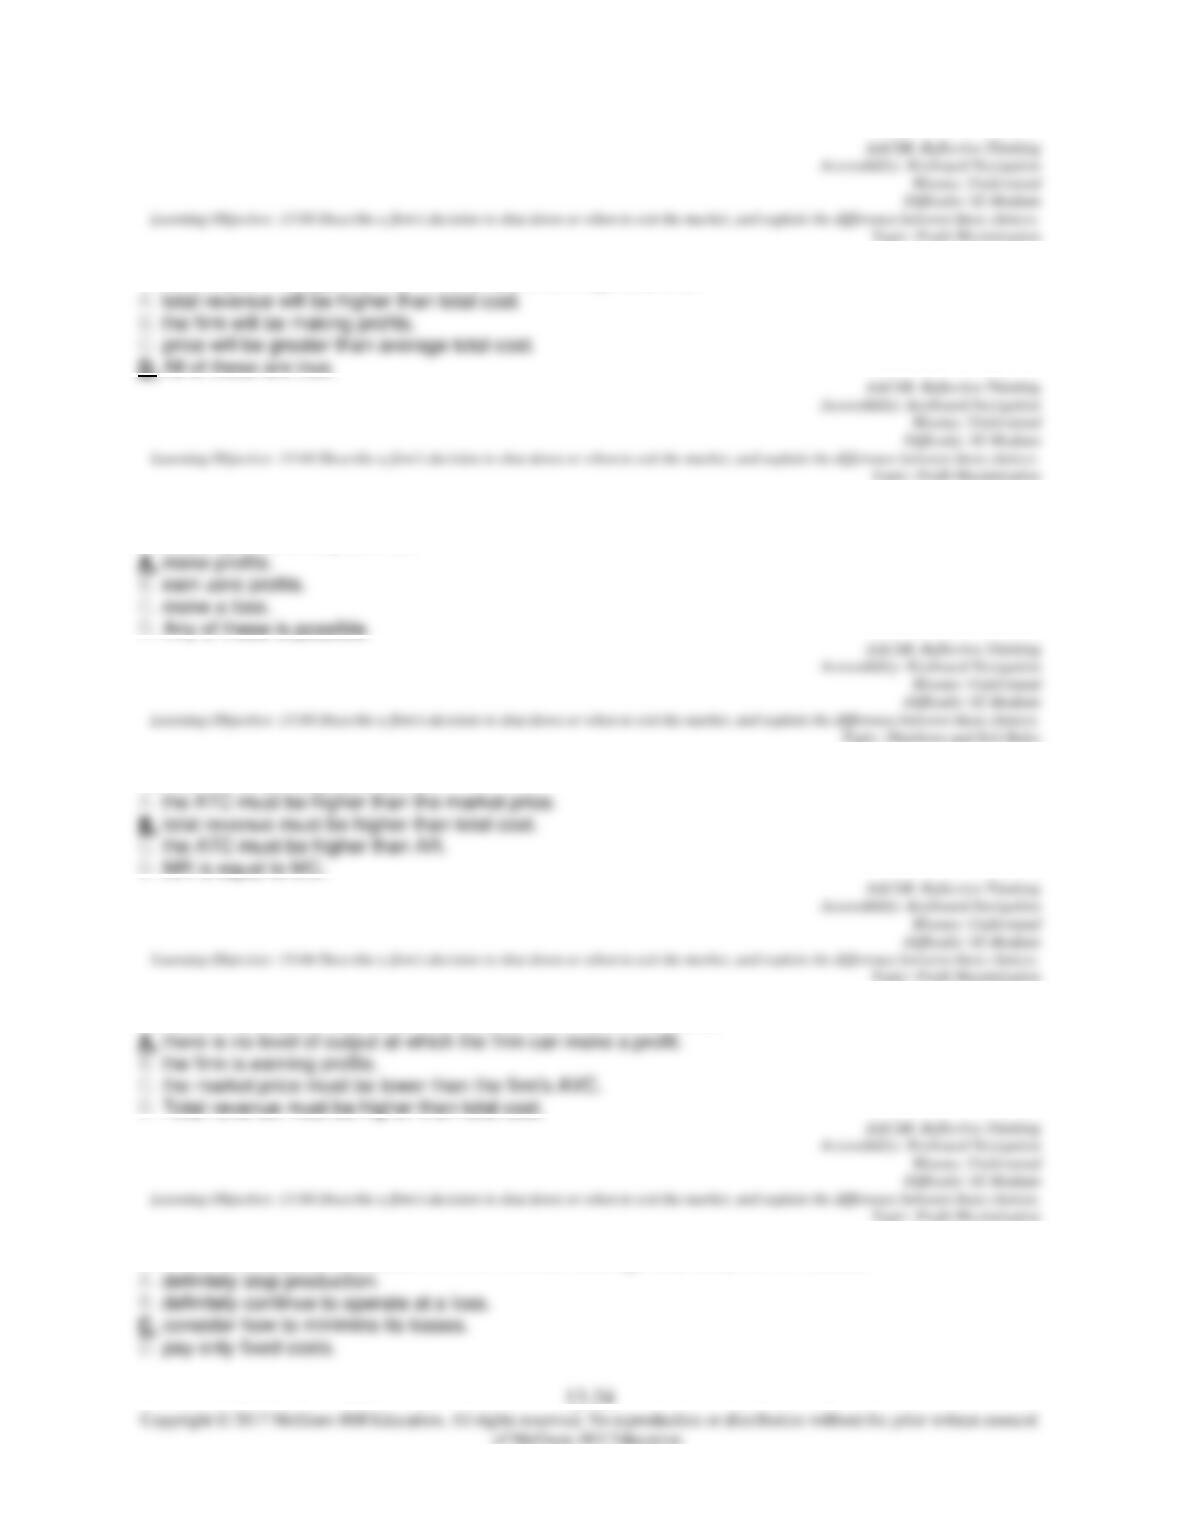
76. As long as average revenue remains above average total cost:
77. As long as market price remains above the average total cost, and the firm chooses the profit–
maximizing level of output, it will:
78. If a firm is earning a profit, then:
79. If the market price falls below the bottom of the firm’s ATC curve:
80. If the market price falls below a firm’s minimum average total cost, the firm should:
81. In the short run, when a firm stops producing it:
82. In the short run, the fixed costs of a firm:
83. In the short run, the fixed costs of a firm:
84. In the short run, the relevant costs for a firm to consider whether to shut down production are:
85. In the short run, a firm that finds itself earning a loss should compare the market price to which cost in
order to determine how to minimize its losses?
86. A firm realizes that the market price has fallen below its average total costs, and it is now earning a
loss. What is the best action for the firm to take in the short run?
87. A firm realizes that the market price has fallen below its average total costs, and it is now earning a
loss. What is the best action for the firm to take in the short run?
88. When the market price has fallen below a firm’s ATC but is above its AVC, in the short run, the firm:
89. If the market price ever drops below a firm’s average variable costs at its profit-maximizing level of
output the:
90. The short-run shutdown rule is to shut down if:
91. The long-run exit rule is to exit the industry if:
92. Given the shutdown rule, what does the firm’s short-run supply curve look like? It is the section of
the:
93. Given the exit rule, where does a firm’s long-run supply curve derive from? It is the section of the:
94.
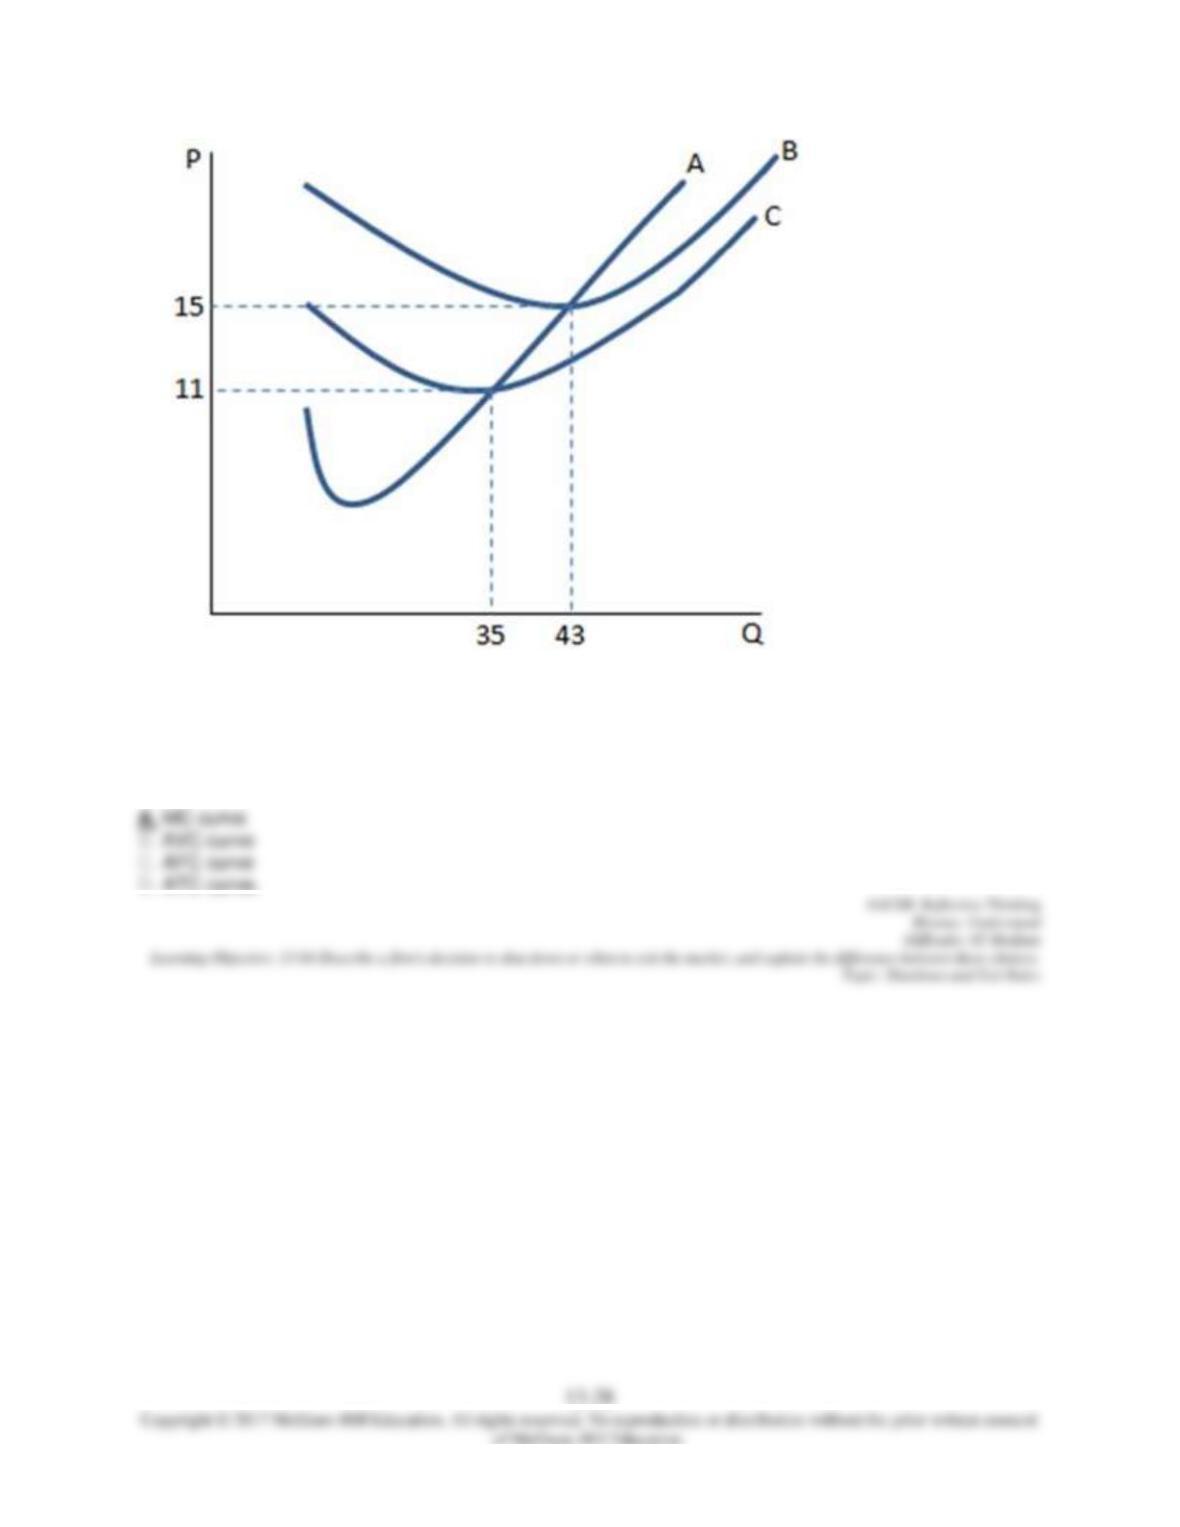
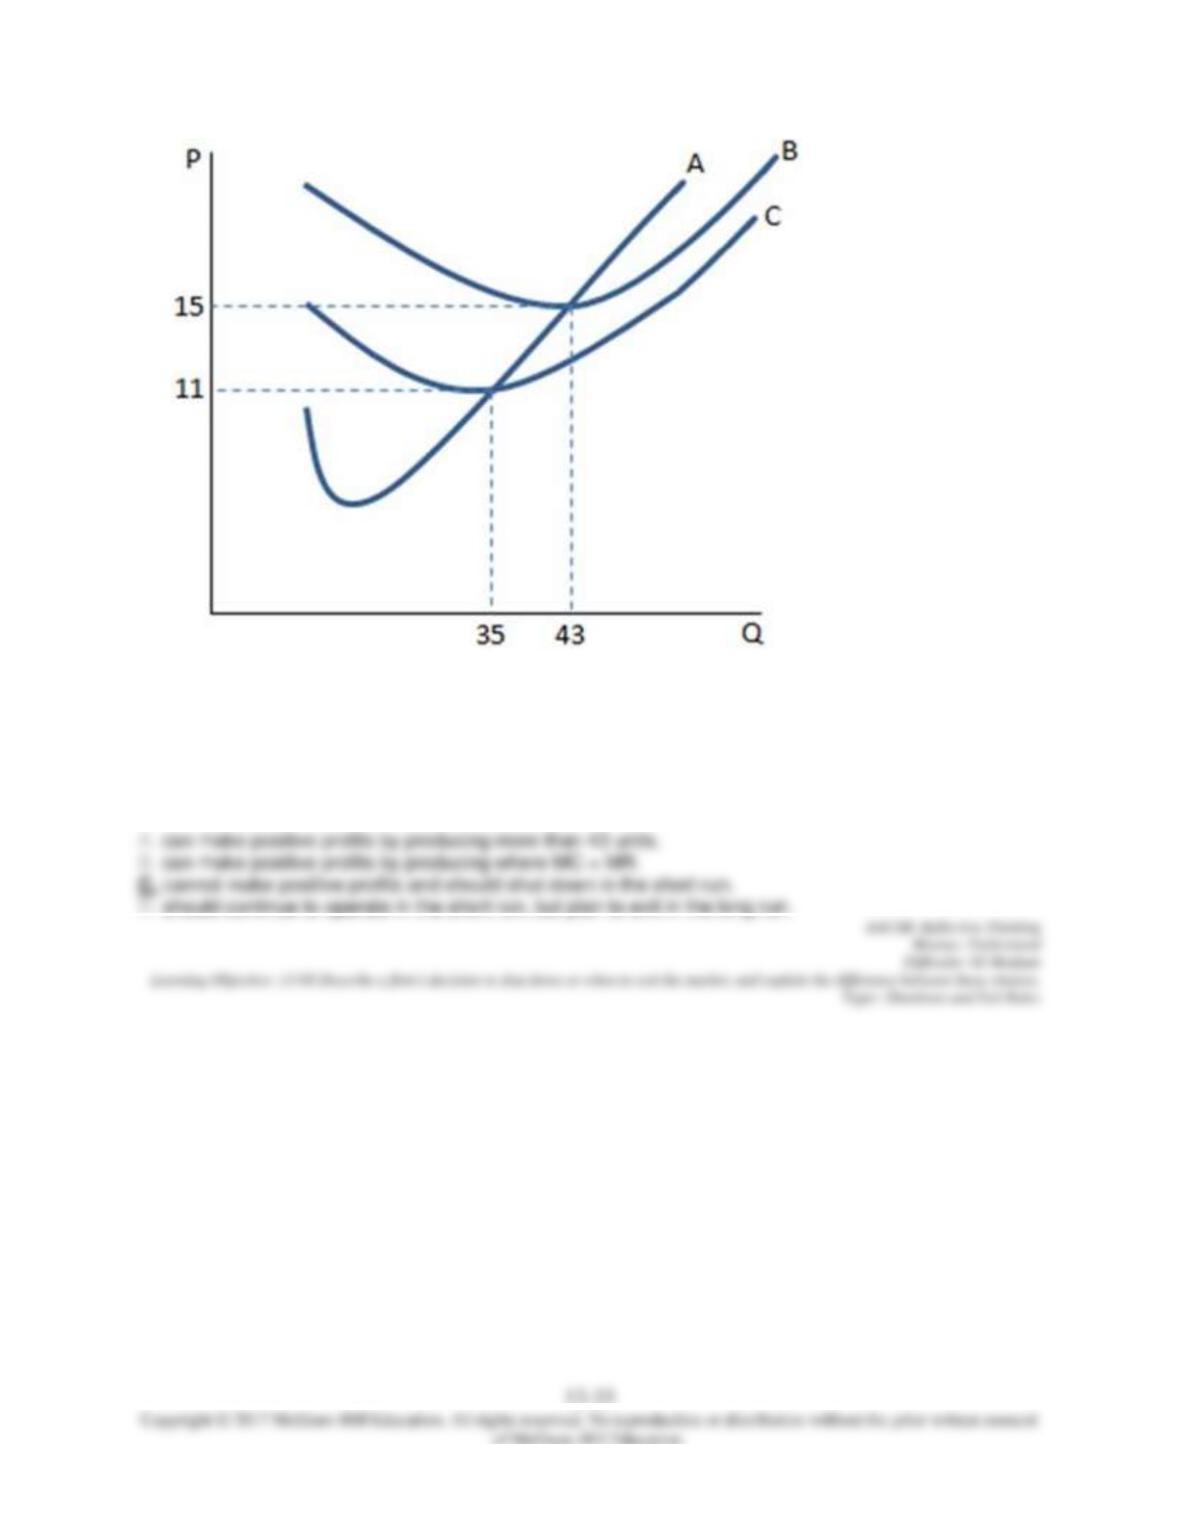
Of the curves displayed in the graph shown, graph B is most like to be the:
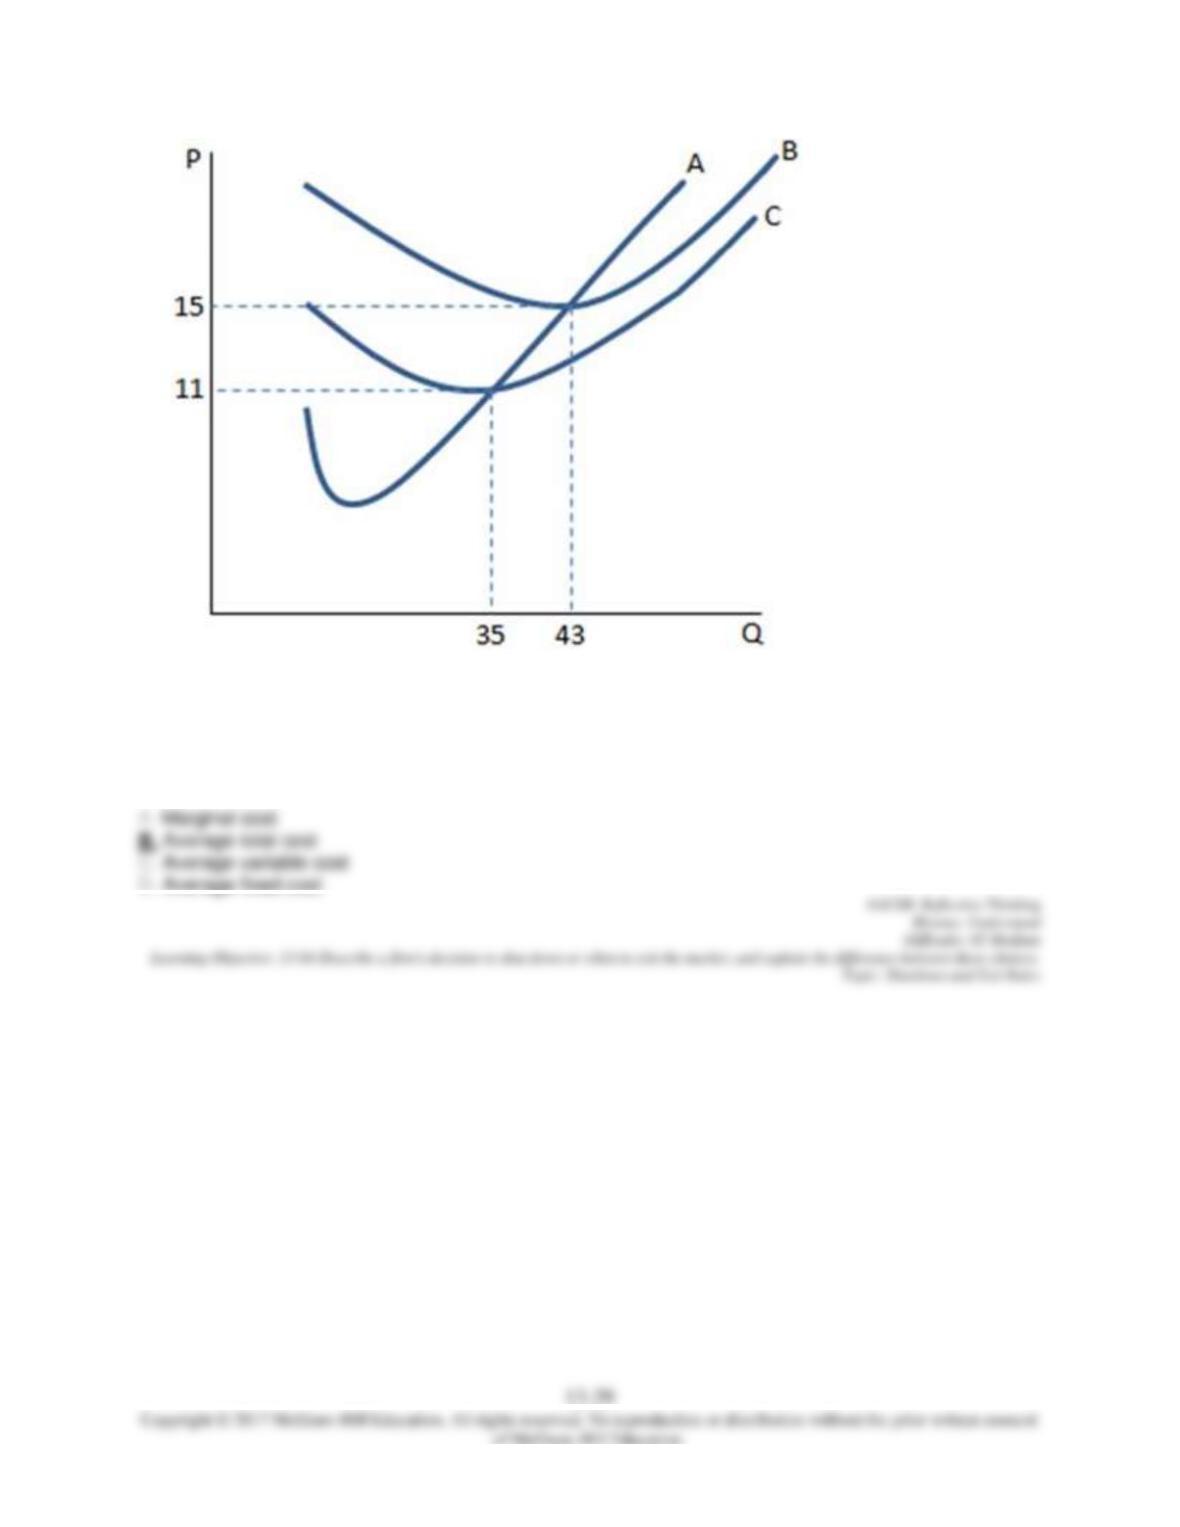
95.
Of the curves displayed in the graph shown, what does curve B most likely represent?
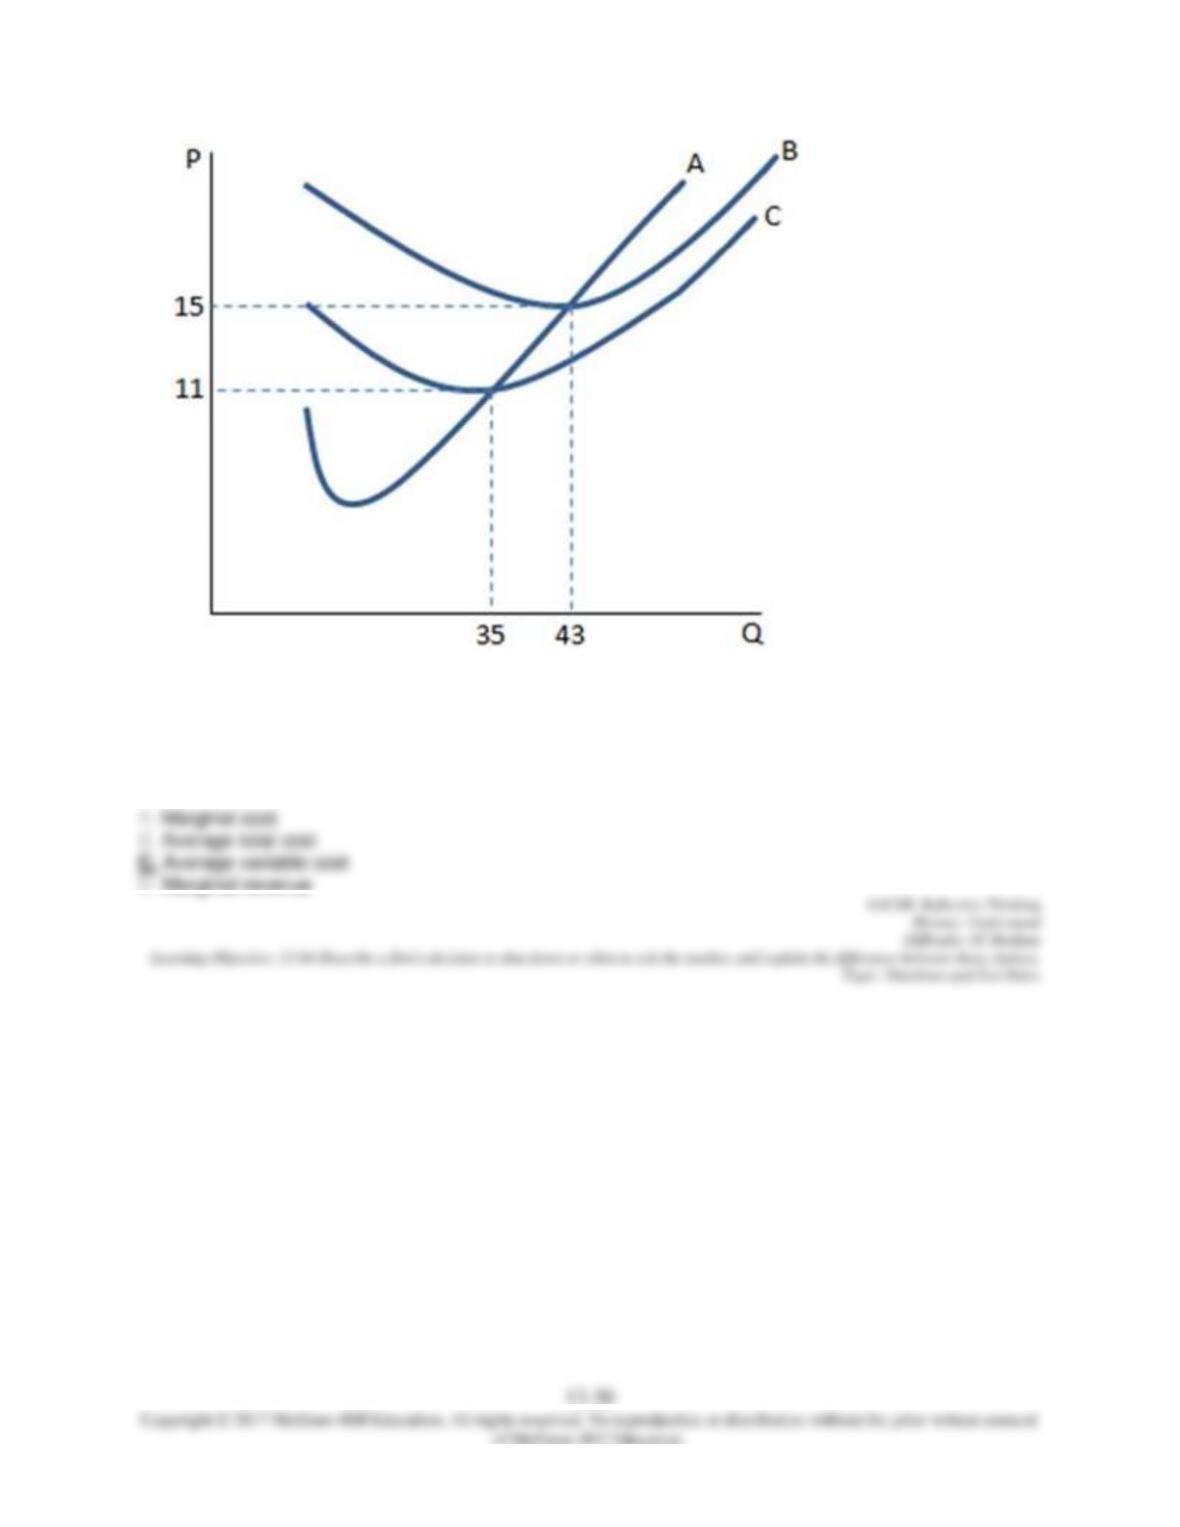
96.
Of the curves displayed in graph shown, what does curve C most likely represent?
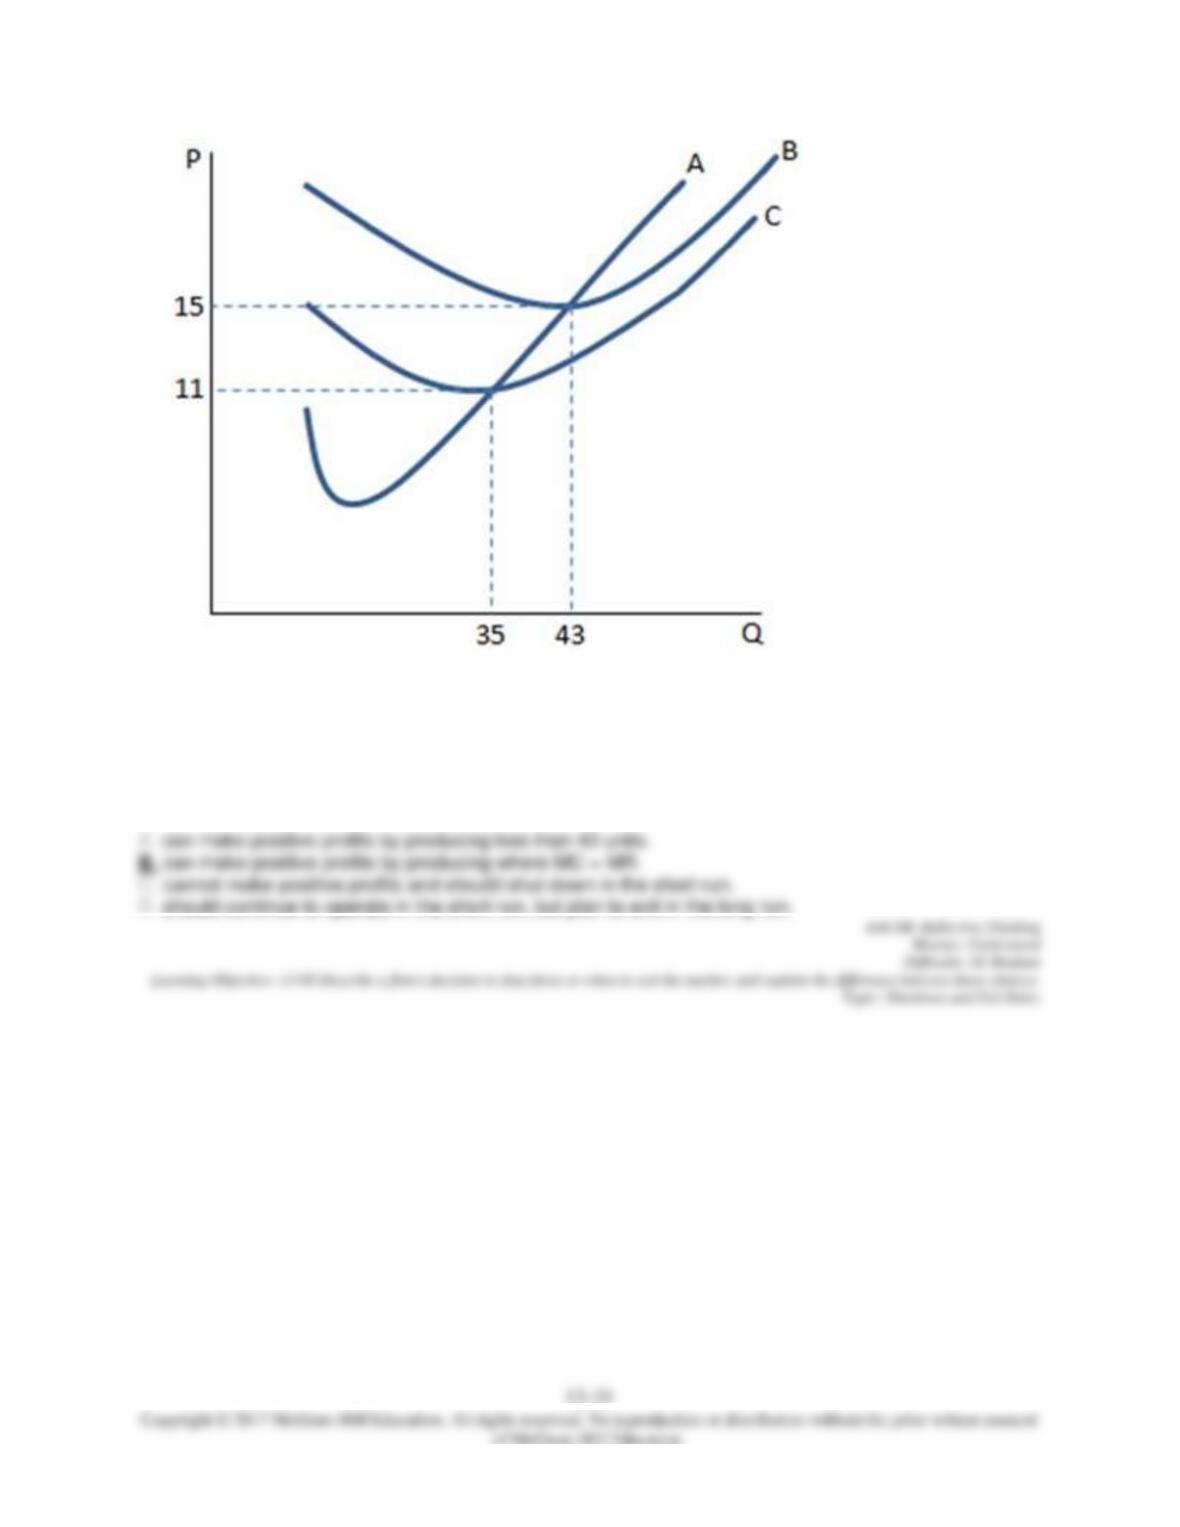
97.
If a firm in a perfectly competitive market faces the curves in the graph shown and observes a market
price of $16, the firm:
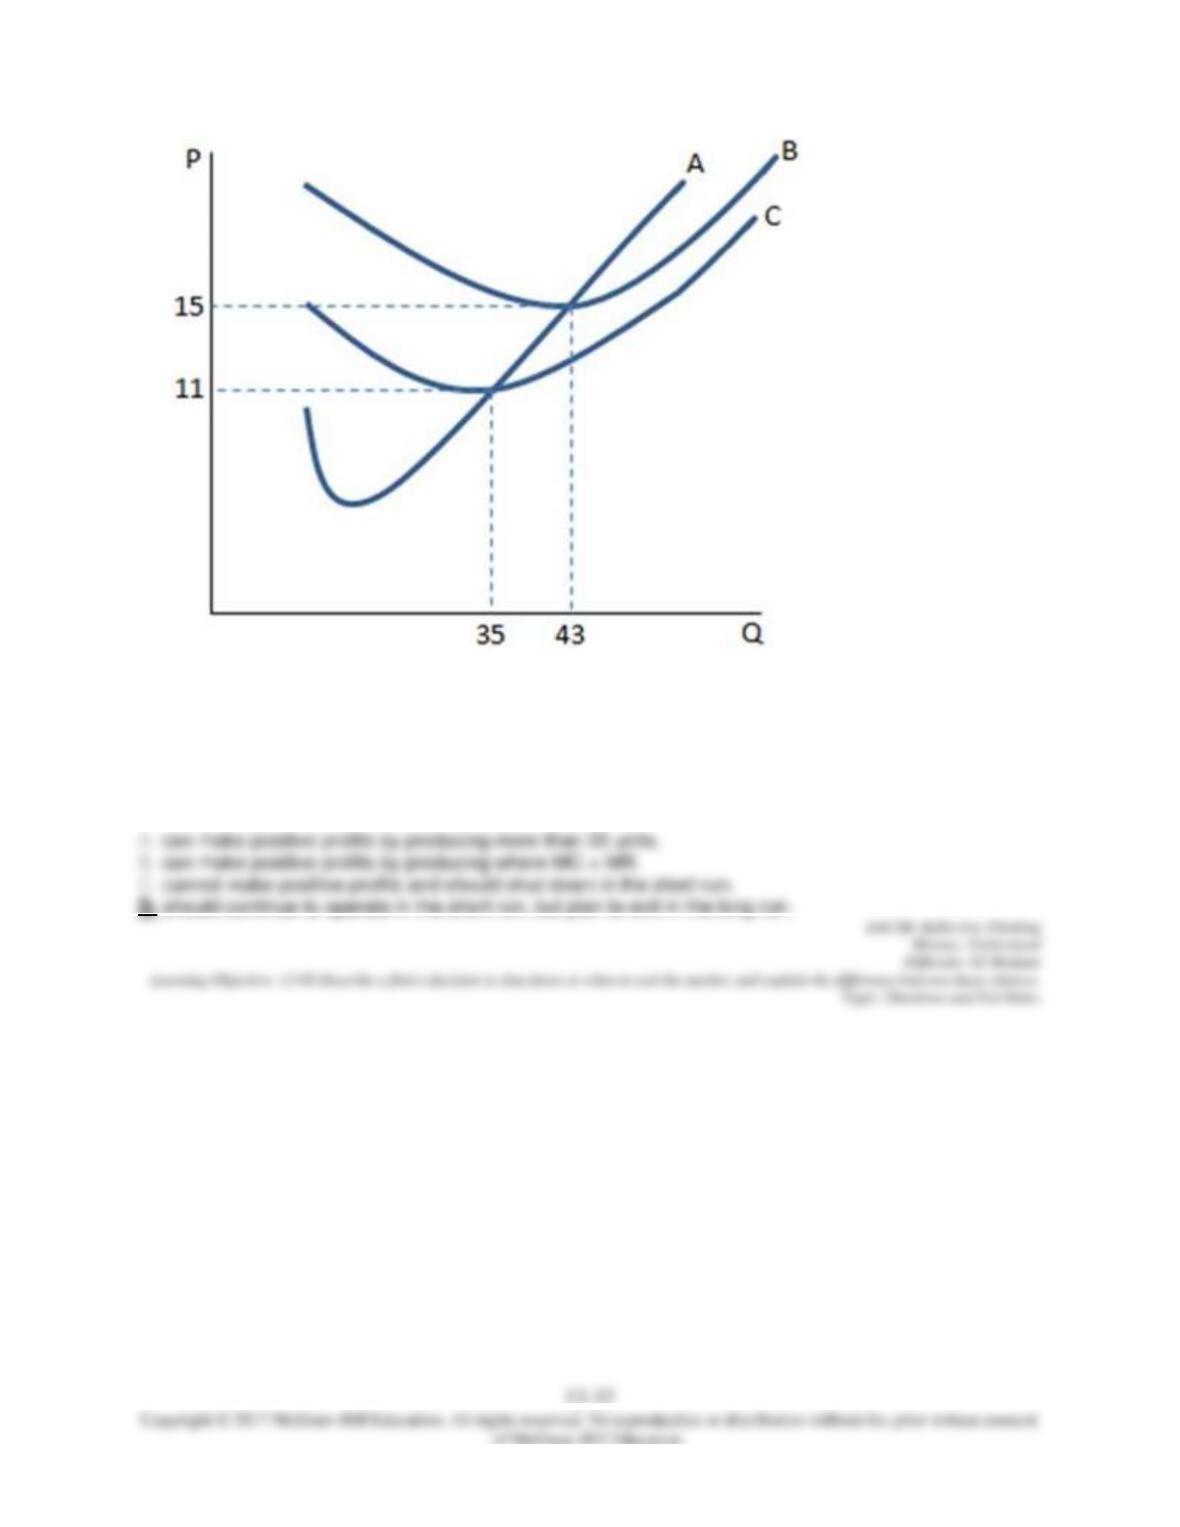
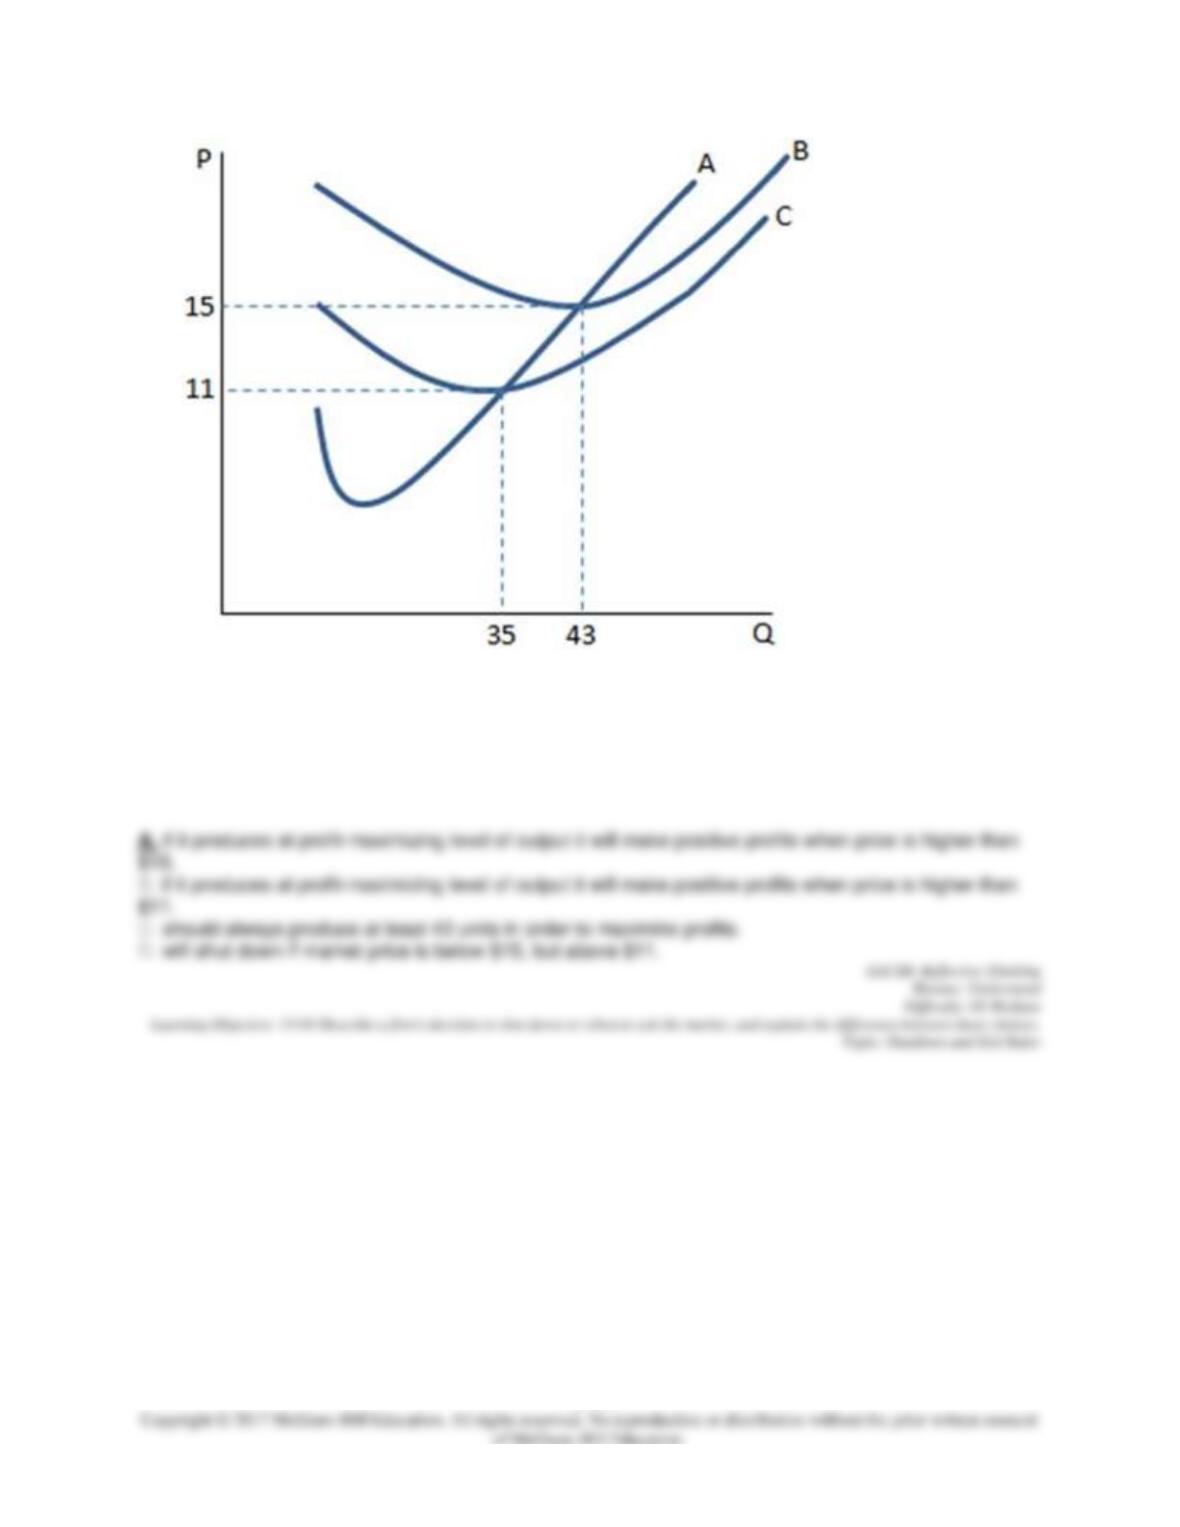
98.
If a firm in a perfectly competitive market faces the cost curves in the graph shown and observes a market
price of $13, the firm:
99.
If a firm in a perfectly competitive market faces the cost curves in the graph shown and observes a market
price of $10, the firm:
13–34
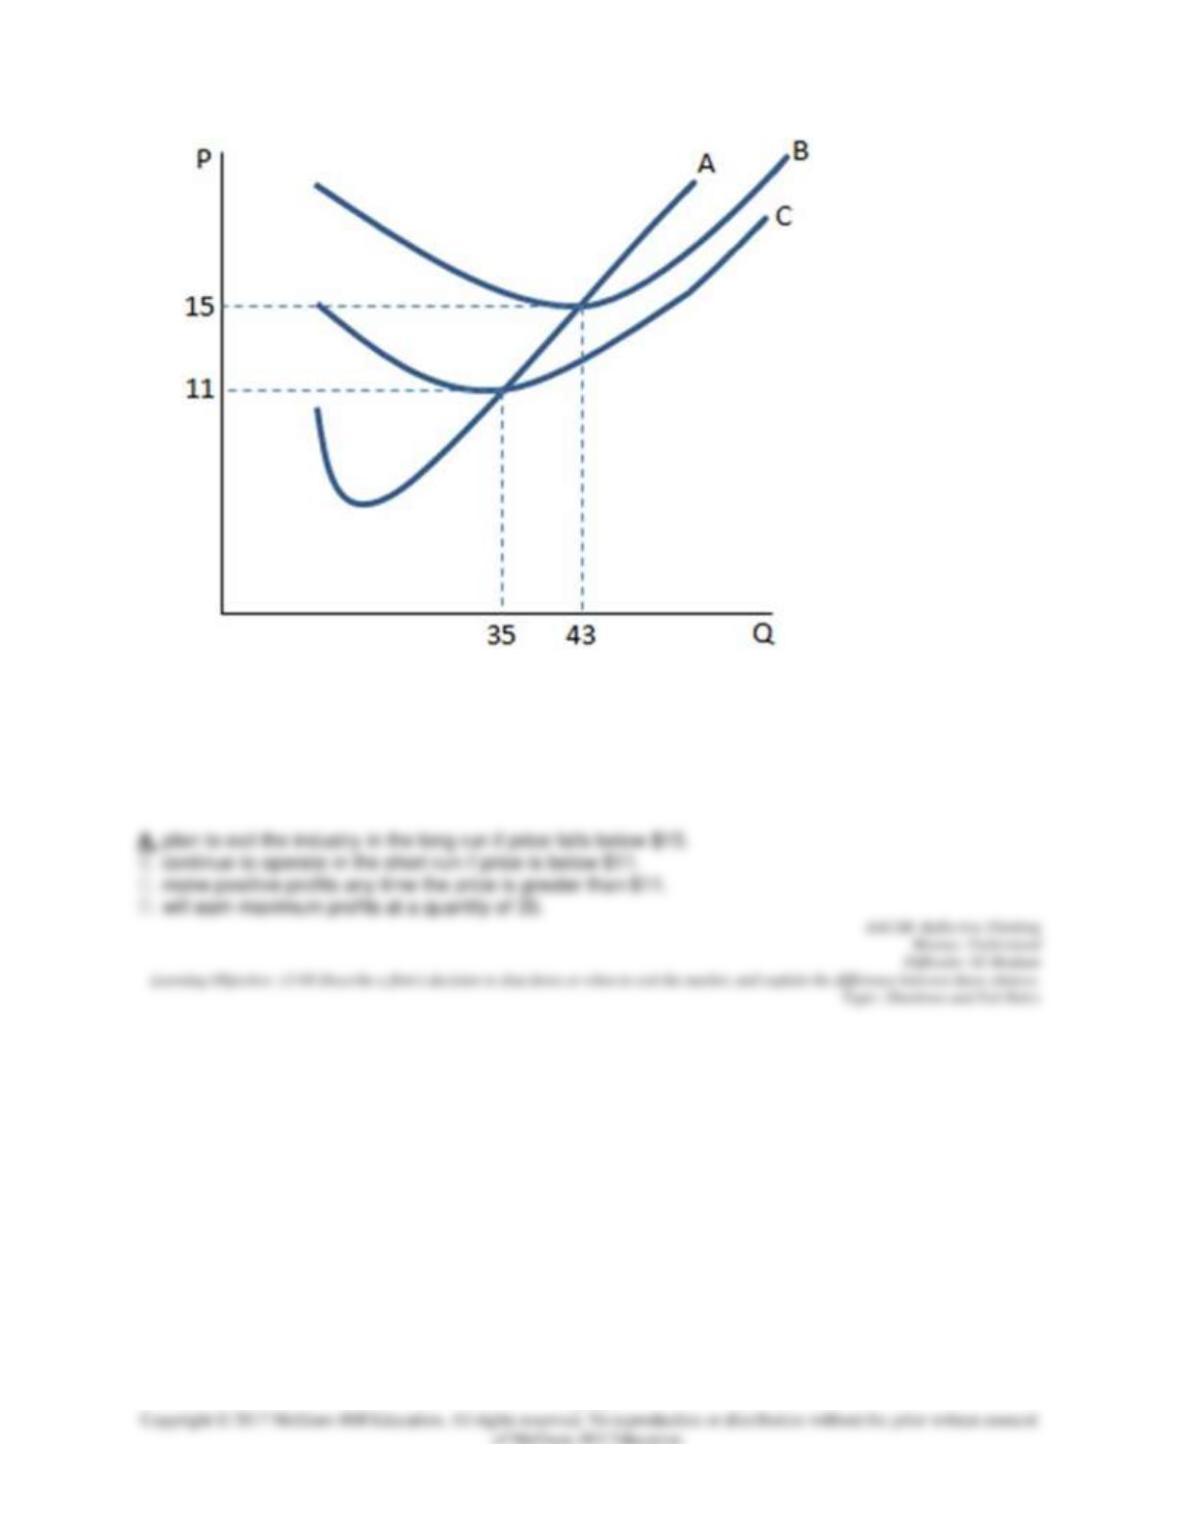
100.
If a firm in a perfectly competitive market faces the cost curves in the graph shown, which of the following
is true? The firm:
13–35
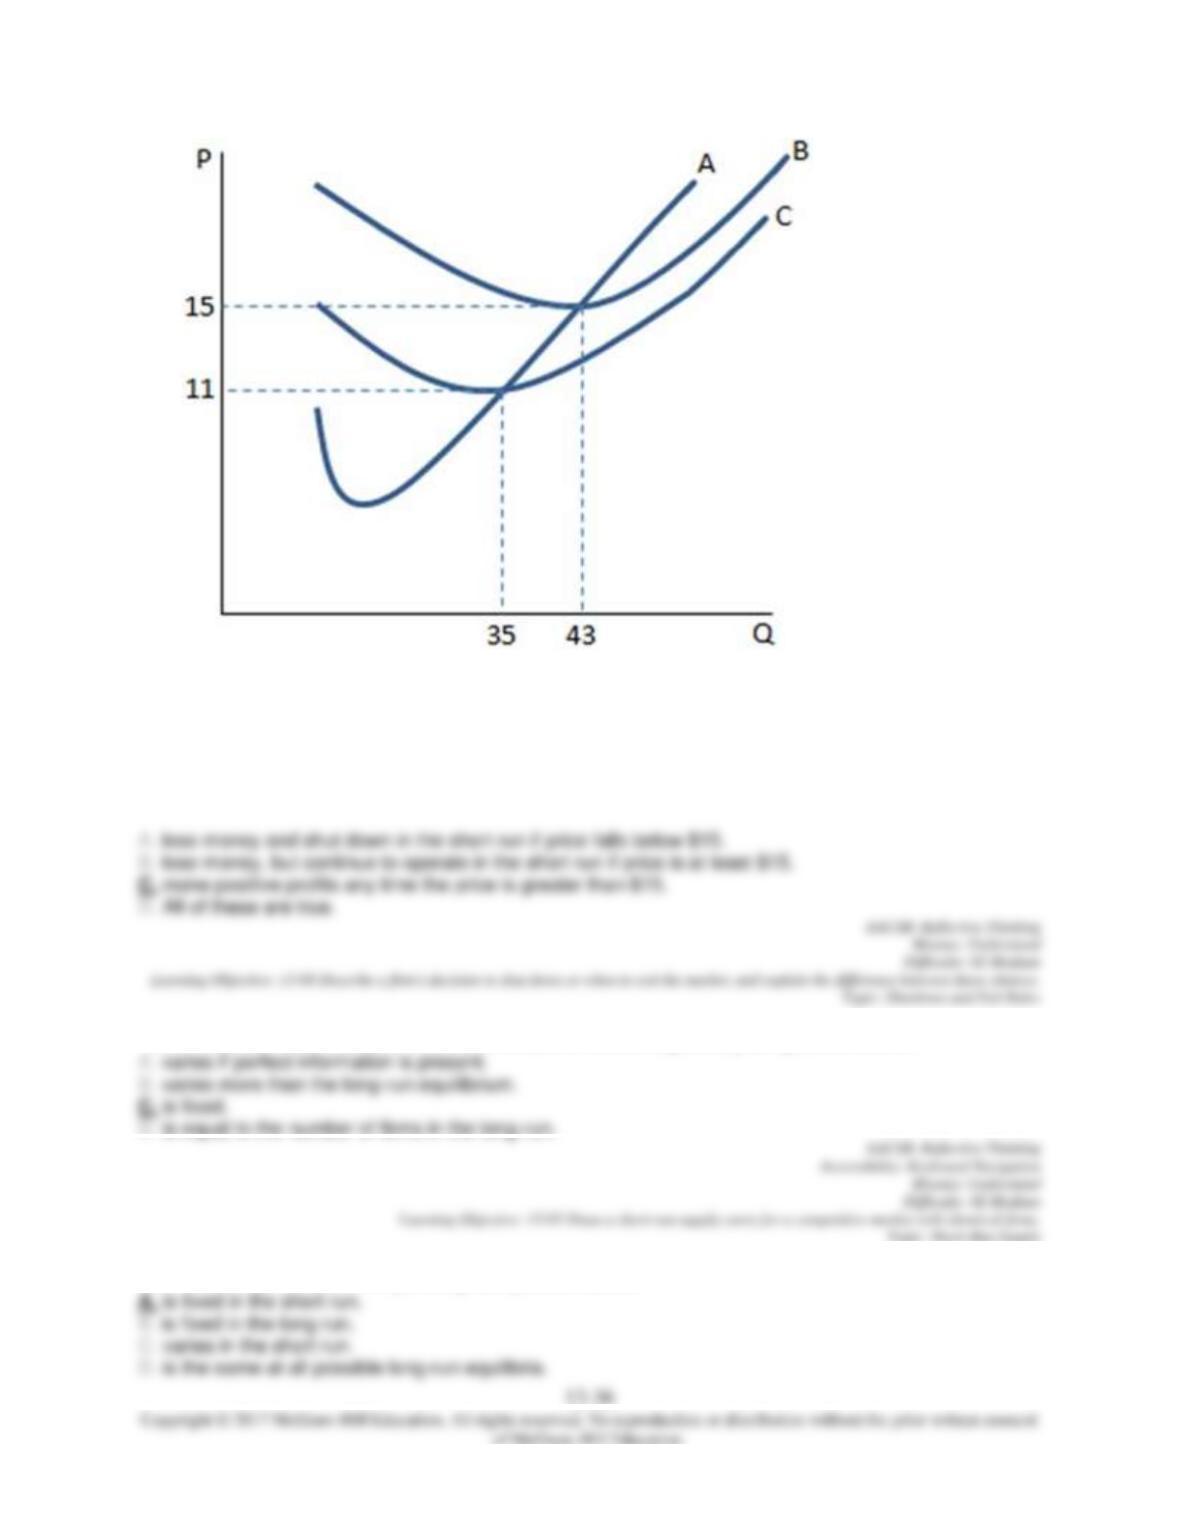
101.
If a firm in a perfectly competitive market faces the cost curves in the graph shown and produces at the
profit-maximizing level of output, which of the following is true? A firm will:
102.
If a firm in a perfectly competitive market faces the cost curves in the graph shown and produces at the
profit-maximizing level of output, which of the following is true? A firm will:
103. In the short run, we assume that the number of firms in a perfectly competitive market:
104. The number of firms in a perfectly competitive market:
105. The market supply in a perfectly competitive market is:
106. We assume that in the short run in a perfectly competitive market the:
107. We assume that in the short run in a perfectly competitive market firms:
108. We assume that in the long run in a perfectly competitive market:
109. The key difference between supply in the short run and supply in the long run is that we assume that
firms: