Macroeconomics, 7e (Abel/Bernanke/Croushore)
Chapter 12 Unemployment and Inflation
12.1 Unemployment and Inflation: Is There a Trade-off?
1) The origin of the idea of a trade-off between inflation and unemployment was a 1958 article
by
A) A.W. Phillips.
B) Edmund Phelps.
C) Milton Friedman.
D) Robert Gordon.
2) Phillips’s research looked at British data on
A) unemployment and inflation.
B) unemployment and nominal wage growth.
C) inflation and nominal wage growth.
D) unemployment and output.
3) The negative relationship between unemployment and inflation is known as the
A) aggregate supply curve.
B) aggregate demand curve.
C) Phillips curve.
D) efficiency wage line.
4) The Phillips curve appeared to fit the data well for the United States in the
A) 1960s.
B) 1970s.
C) 1980s.
D) 1990s.
5) Friedman and Phelps suggested that there should not be a stable relationship between inflation
and unemployment, but there should be a stable relationship between
A) anticipated inflation and frictional unemployment.
B) anticipated inflation and cyclical unemployment.
C) unanticipated inflation and frictional unemployment.
D) unanticipated inflation and cyclical unemployment.
6) Milton Friedman and Edmund Phelps questioned
A) the use of expectations in the Phillips curve.
B) the stability of the relationship between inflation and unemployment.
C) the existence of a natural rate of unemployment.
D) the existence of a full-employment level of output.
7) In the extended classical model, an anticipated decrease in the money supply would cause
output to ________ and the price level to ________ in the short run.
A) increase; decrease
B) increase; remain unchanged
C) remain unchanged; increase
D) remain unchanged; decrease
8) In the extended classical model, an unanticipated increase in the money supply would cause
output to ________ and the price level to ________ in the short run.
A) increase; increase
B) decrease; remain unchanged
C) remain unchanged; increase
D) decrease; decrease
9) In the extended classical model, an unexpected decrease in aggregate demand would cause
unanticipated inflation to be ________ and cyclical unemployment to be ________.
A) positive; negative
B) positive; positive
C) negative; negative
D) negative; positive
10) In the expectations-augmented Phillips curve, π = πe – 3(u –
u
). If π = 0.03 when πe = 0.06
and u = 0.06, then
u
=
A) 0.02.
B) 0.03.
C) 0.04.
D) 0.05.
11) In the expectations-augmented Phillips curve, π = πe – 3(u –
u
). If π = 0.06 when πe = 0.06
and u = 0.04, then
u
=
A) 0.02.
B) 0.03.
C) 0.04.
D) 0.05.
12) In the expectations-augmented Phillips curve, π = πe – 3(u –
u
). If π = 0.09 when πe = 0.06
and u = 0.06, then
u
=
A) 0.02.
B) 0.03.
C) 0.04.
D) 0.05.
13) In the expectations-augmented Phillips curve, π = πe – 3(u – 0.06). When π = 0.06 and πe =
0.03, the unemployment rate is
A) 0.04.
B) 0.05.
C) 0.06.
D) 0.07.
14) In the expectations-augmented Phillips curve, π = πe – 3(u – 0.05). When π = 0.06 and πe =
0.03, the unemployment rate is
A) 0.04.
B) 0.05.
C) 0.06.
D) 0.07.
15) In the expectations-augmented Phillips curve, π = πe – 3(u – 0.05). When π = 0.03 and πe =
0.06, the unemployment rate is
A) 0.04.
B) 0.05.
C) 0.06.
D) 0.07.
16) The Phillips curve is the relation between inflation and unemployment that holds for a given
natural rate of unemployment and a
A) given rate of inflation.
B) given expected rate of inflation.
C) given level of unemployment.
D) given expected level of unemployment.
17) Suppose most people had anticipated that inflation would be 3% in the coming year because
the Fed would increase the money supply by 3%. Instead, the Fed increases the money supply by
5%. In the short run, this would cause actual output to be ________ full-employment output and
prices to increase by ________ 3%.
A) above; more than
B) above; less than
C) below; more than
D) below; less than
18) An increase in the expected rate of inflation would
A) shift the Phillips curve upward.
B) shift the Phillips curve downward.
C) shift the long-run Phillips curve to the right.
D) shift the long-run Phillips curve to the left.
19) If the expected inflation rate is unchanged, a fall in the natural rate of unemployment would
A) shift the Phillips curve to the right.
B) not shift the Phillips curve.
C) shift the Phillips curve to the left.
D) shift the Phillips curve to the left and shift the long-run Phillips curve to the right.
20) If the expected rate of inflation rose at the same time the natural rate of unemployment rose,
the Phillips curve
A) would shift down.
B) would shift up.
C) would not move.
D) might shift up or down or not move, depending on which effect was larger.
21) A beneficial supply shock would cause
A) a movement up the short-run Phillips curve.
B) a movement down the short-run Phillips curve.
C) the short-run Phillips curve to shift upward and to the right.
D) the short-run Phillips curve to shift downward and to the left.
22) Classicals argue that an adverse supply shock would
A) raise neither the natural rate of unemployment nor the actual rate of unemployment.
B) raise the actual rate of unemployment, but not the natural rate of unemployment.
C) raise the natural rate of unemployment, but not the actual rate of unemployment.
D) raise both the natural rate of unemployment and the actual rate of unemployment.
23) Historically, Brazil has suffered higher and more variable rates of inflation than Venezuela.
You would expect the short-run aggregate supply curve of Brazil to be ________ than that of
Venezuela, and the Phillips curve of Brazil to be ________ than that of Venezuela.
A) flatter; flatter
B) flatter; steeper
C) steeper; flatter
D) steeper; steeper
24) The Friedman-Phelps analysis shows that a negative relationship between inflation and
unemployment holds
A) even when expected inflation changes.
B) even when the natural rate of unemployment changes.
C) even if both the expected inflation rate and the natural rate of unemployment change.
D) as long as the expected inflation rate and the natural rate of unemployment are approximately
constant.
25) The Phillips curve shifted during the 1970s primarily because of
A) the two large oil price shocks.
B) the changing demographics of the population.
C) tight monetary policy.
D) easy fiscal policy.
26) Examining data on cyclical unemployment plotted against unanticipated inflation shows
A) a positive relationship.
B) a negative relationship.
C) no significant relationship.
D) a relationship only during the 1960s.
27) The Friedman-Phelps analysis suggests that there is a long-term relationship between
A) inflation and unemployment.
B) cyclical inflation and structural unemployment.
C) unanticipated inflation and cyclical unemployment.
D) anticipated inflation and structural unemployment.
28) An analysis of the American economy since 1960 shows that there is a stable relationship
between inflation and unemployment
A) only in the short run.
B) only in the long run.
C) in neither the short run nor the long run.
D) in both the short run and the long run
29) Both classicals and Keynesians agree that policymakers
A) can exploit the Phillips curve in the short run.
B) cannot exploit the Phillips curve in the short run.
C) can keep the unemployment rate permanently below the natural rate by permanently running a
high rate of inflation.
D) cannot keep the unemployment rate permanently below the natural rate by permanently
running a high rate of inflation.
30) The Lucas critique is an objection to the assumption that
A) inflation is always and everywhere a monetary phenomenon.
B) there is a negative relationship between inflation and unemployment.
C) historical relationships between macroeconomic variables will continue to hold after new
policies are in place.
D) people form expectations rationally.
31) The argument that when policy changes, people’s behavior changes so that historical
relationships between macroeconomic variables will no longer hold is known as
A) the Phillips curve.
B) the policy irrelevance hypothesis.
C) hysteresis.
D) the Lucas critique.
32) The long-run Phillips curve is
A) vertical.
B) horizontal.
C) upward sloping.
D) downward sloping.
33) The fact that the long-run Phillips curve is vertical implies that
A) monetary policy can’t affect unemployment.
B) money is neutral in the long run.
C) there is a natural rate of inflation.
D) money can’t affect inflation in the long run.
34) Suppose Okun’s law holds and a one percentage point increase in the unemployment rate
reduces real output by 2% of full-employment output. The expectations-augmented Phillips
curve is given by
π = πe – 2.5 (u – 0.04).
Suppose π = 0.08 and πe = 0.03.
(a) What is the natural rate of unemployment?
(b) What is the actual rate of unemployment?
(c) How much is actual GDP compared with full-employment GDP?
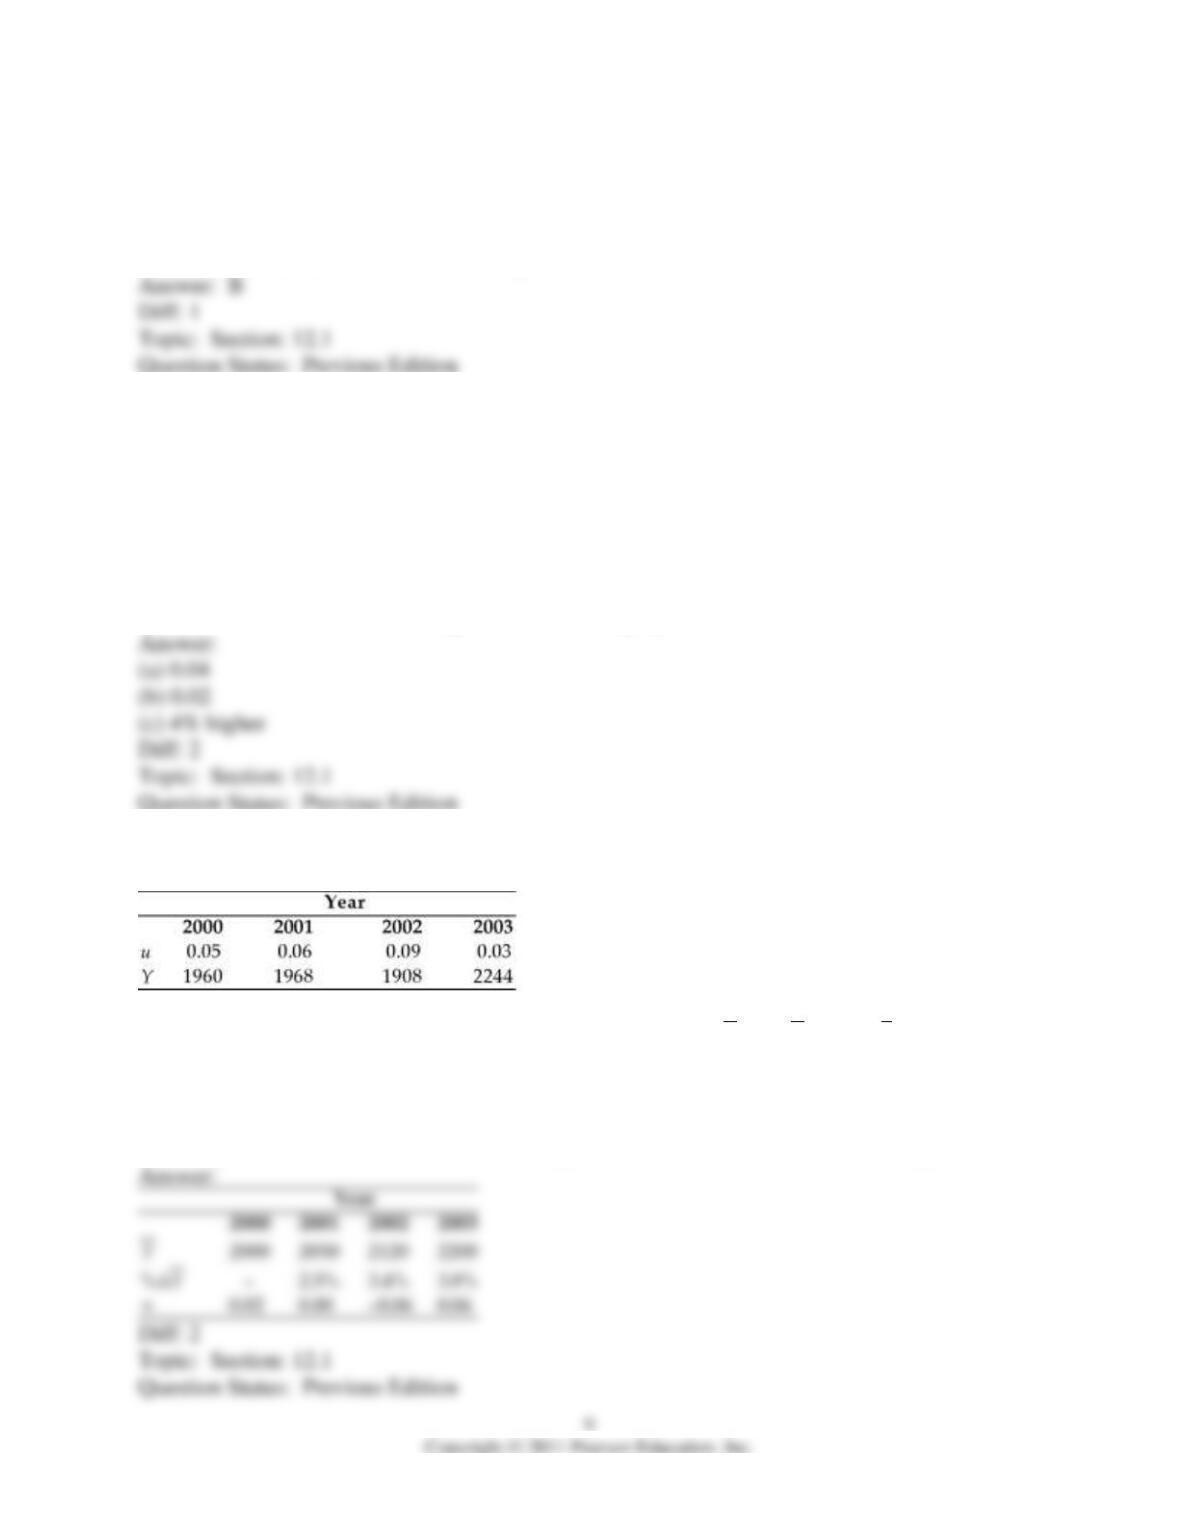
35) You are given the following information about the economy.
The natural rate of unemployment is 0.04, Okun’s Law is that (
Y
– Y)/
Y
= 2(u –
u
), and the
Phillips curve relationship is π = πe – 2 (u – 0.04).
(a) What was the full-employment level of output in each year?
(b) Calculate the growth rate of full-employment output each year.
(c) If expected inflation was 0.04 for all four years, what was the inflation rate each year?
36) Consider the following misperceptions model of the economy.
AD: Y = 600 + 10(M/P)
SRAS: Y =
Y
+ P – Pe
Okun’s Law: (Y –
Y
)/
Y
= -2(u –
u
)
Let
Y
= 750, = 0.05, M = 600, and Pe = 40.
(a) What is the price level?
(b) Suppose there is an unanticipated increase in the nominal money supply to 800. What is the
short-run equilibrium level of output, the unemployment rate, and the price level?
(c) When price expectations adjust fully, what is the price level?
37) The relationship between inflation and unemployment is given by
π = πe – 3(u – 0.06).
(a) Graph the long-run Phillips curve and three short-run Phillips curves.
(b) What is the value of the natural rate of unemployment?
(c) If actual inflation is 0.02 and expected inflation is 0.05, what is the unemployment rate?
(d) If actual inflation is 0.08 and expected inflation is 0.05, what is the unemployment rate?
u
38) The relationship between inflation and unemployment is given by
π = πe – 2(u –
u
).
(a) Draw a diagram showing a long-run Phillips curve and two short-run Phillips curves that
contain the following points:
A: π = .03, πe = .03
B: π = .06, πe = .06
C: π = .03, πe = .06
D: π = .06, πe = .03
Label points A, B, C, and D in your diagram.
The unemployment rate at point A equals .05.
(b) What are the values of the natural rate of unemployment and the unemployment rates at
points B, C, and D?
u
u
39) The relationship between inflation and unemployment is given by
π = πe – 4(u –
u
).
(a) Draw a diagram showing a long-run Phillips curve and two short-run Phillips curves that
contain the following points:
A: π = .04, πe = .04
B: π = .08, πe = .08
C: π = .04, πe = .08
D: π = .08, πe = .04
Label points A, B, C, and D in your diagram.
The unemployment rate at point A equals .05.
(b) What are the values of the natural rate of unemployment and the unemployment rates at
points B, C, and D?
40) The expectations-augmented Phillips curve is
π = πe – 3(u – 0.05).
(a) Graph the long-run Phillips curve and the short-run Phillips curve for an expected inflation
rate of 0.03. If the Fed chooses to keep the actual inflation rate at 0.03, what will be the
unemployment rate? Label the equilibrium point “A”. What is the numerical value of the natural
rate of unemployment?
(b) An aggregate demand shock (resulting from increased exports of goods) raises the inflation
rate to 0.06 (the natural rate of unemployment and the expected inflation rate are not affected).
Show what happens on your graph. Label the equilibrium point “B”. What is the numerical value
of the unemployment rate?
(c) In response to the aggregate demand shock, suppose the Fed allows the inflation rate of 0.06
to persist. Show what happens on your graph, labeling the equilibrium point “C”. In the long run,
what is the numerical value of the unemployment rate?
(d) From the situation in part (c), suppose a supply shock (an oil price increase) raises the natural
rate of unemployment by .01 from its original value. If the expected inflation rate does not
change, show what happens in your graph, labeling the equilibrium point “D”.