148) Refer to the above figure. Line ACE is called
A) the saving function.
B) the savings function.
C) the 45-degree line.
D) the consumption function.
149) Refer to the above figure. If real disposable income is $30,000, saving is
A) $0.
B) $4000.
C) $5000.
D) $6000.
150) Refer to the above figure. At an income of $10,000, saving is
A) 0.
B) $13,000.
C) $3,000.
D) -$3,000.
151) Refer to the above figure. Autonomous consumption equals
A) 0.
B) -$5000.
C) $5000.
D) $25,000.
152) Refer to the above figure. The marginal propensity to consume and the marginal propensity
to save
A) are 0.90 and 0.10, respectively.
B) are 0.83 and 0.17, respectively.
C) are 0.75 and 0.25, respectively.
D) depend on the level of income.
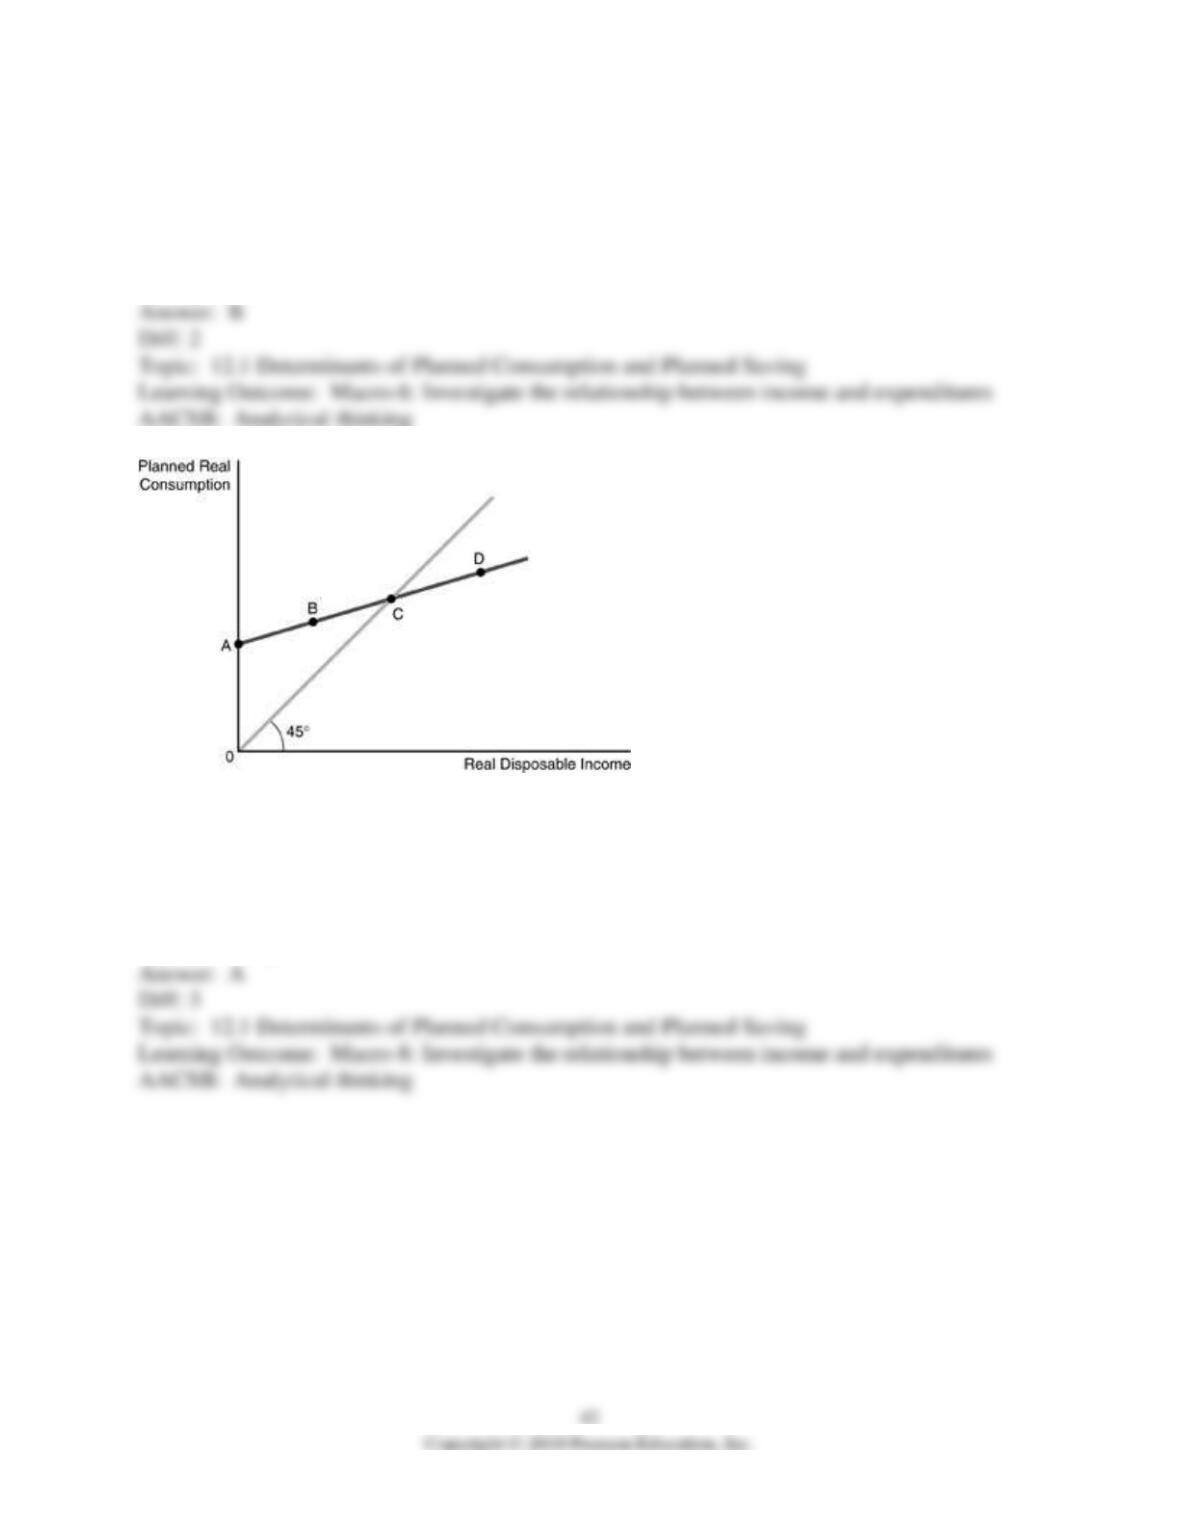
153) Refer to the above figure. The figure represents the consumption function for a consumer.
Point A represents
A) autonomous consumption.
B) positive saving.
C) negative consumption.
D) zero saving.
154) Refer to the above figure. The figure represents the consumption function for a consumer.
Point B represents
A) autonomous consumption.
B) positive saving.
C) negative saving.
D) zero saving.
155) Refer to the above figure. The figure represents the consumption function for a consumer.
Point C represents
A) autonomous consumption.
B) positive saving.
C) negative saving.
D) zero saving.
156) Refer to the above figure. The figure represents the consumption function for a consumer.
Point D represents
A) autonomous consumption.
B) saving.
C) dissaving.
D) zero saving.
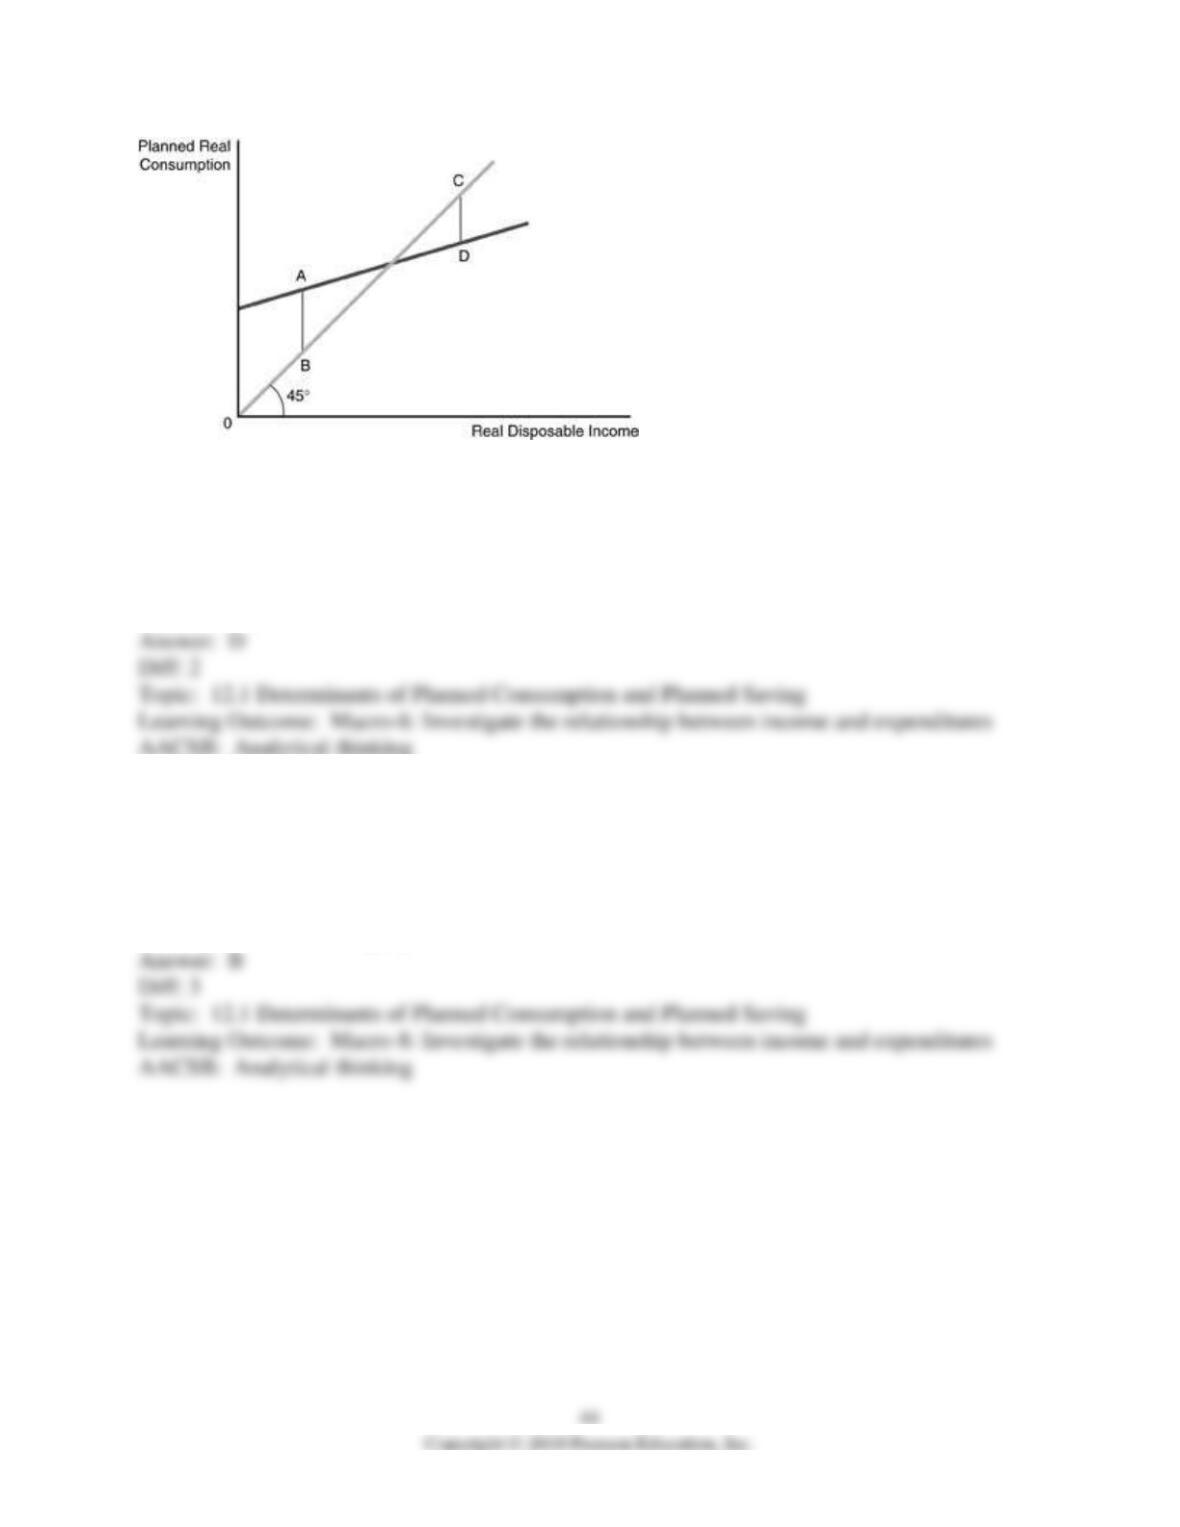
157) Refer to the above figure. The figure represents the consumption function for a consumer.
The distance between A and B represents
A) the amount of autonomous consumption.
B) the amount of autonomous saving.
C) the amount of total consumption.
D) none of the above.
158) Refer to the above figure. The figure represents the consumption function for a consumer.
The distance between C and D represents
A) the amount of autonomous consumption.
B) the amount of saving.
C) the amount of dissaving.
D) the point where saving equals zero.
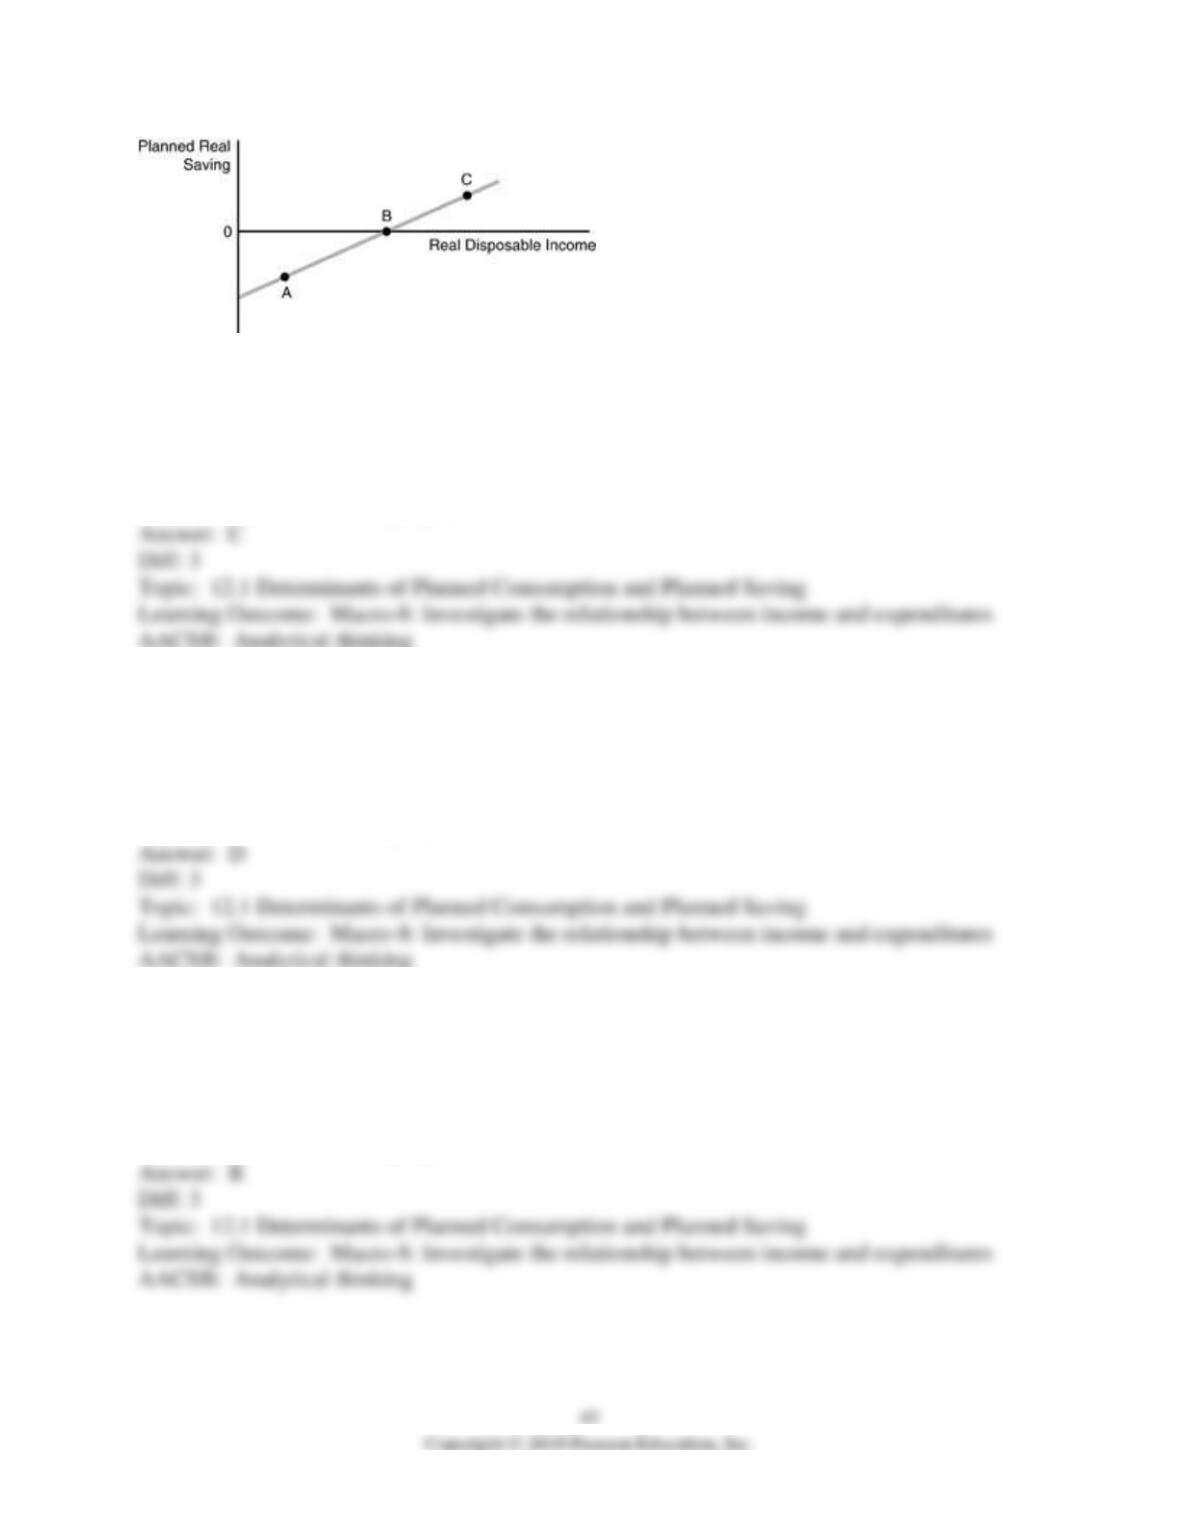
159) Refer to the above figure. The figure represents the saving function for the consumer. Point
A represents
A) the amount of autonomous consumption.
B) a situation in which saving is positive.
C) a situation in which saving is negative.
D) the point at which saving equals zero.
160) Refer to the above figure. The figure represents the saving function for the consumer. Point
B represents
A) the amount of autonomous consumption.
B) a situation in which saving is positive.
C) a situation in which saving is negative.
D) the point at which saving equals zero.
161) Refer to the above figure. The figure represents the saving function for the consumer. Point
C represents
A) the amount of autonomous consumption.
B) a situation in which saving is positive.
C) a situation in which saving is negative.
D) the point at which saving equals zero.
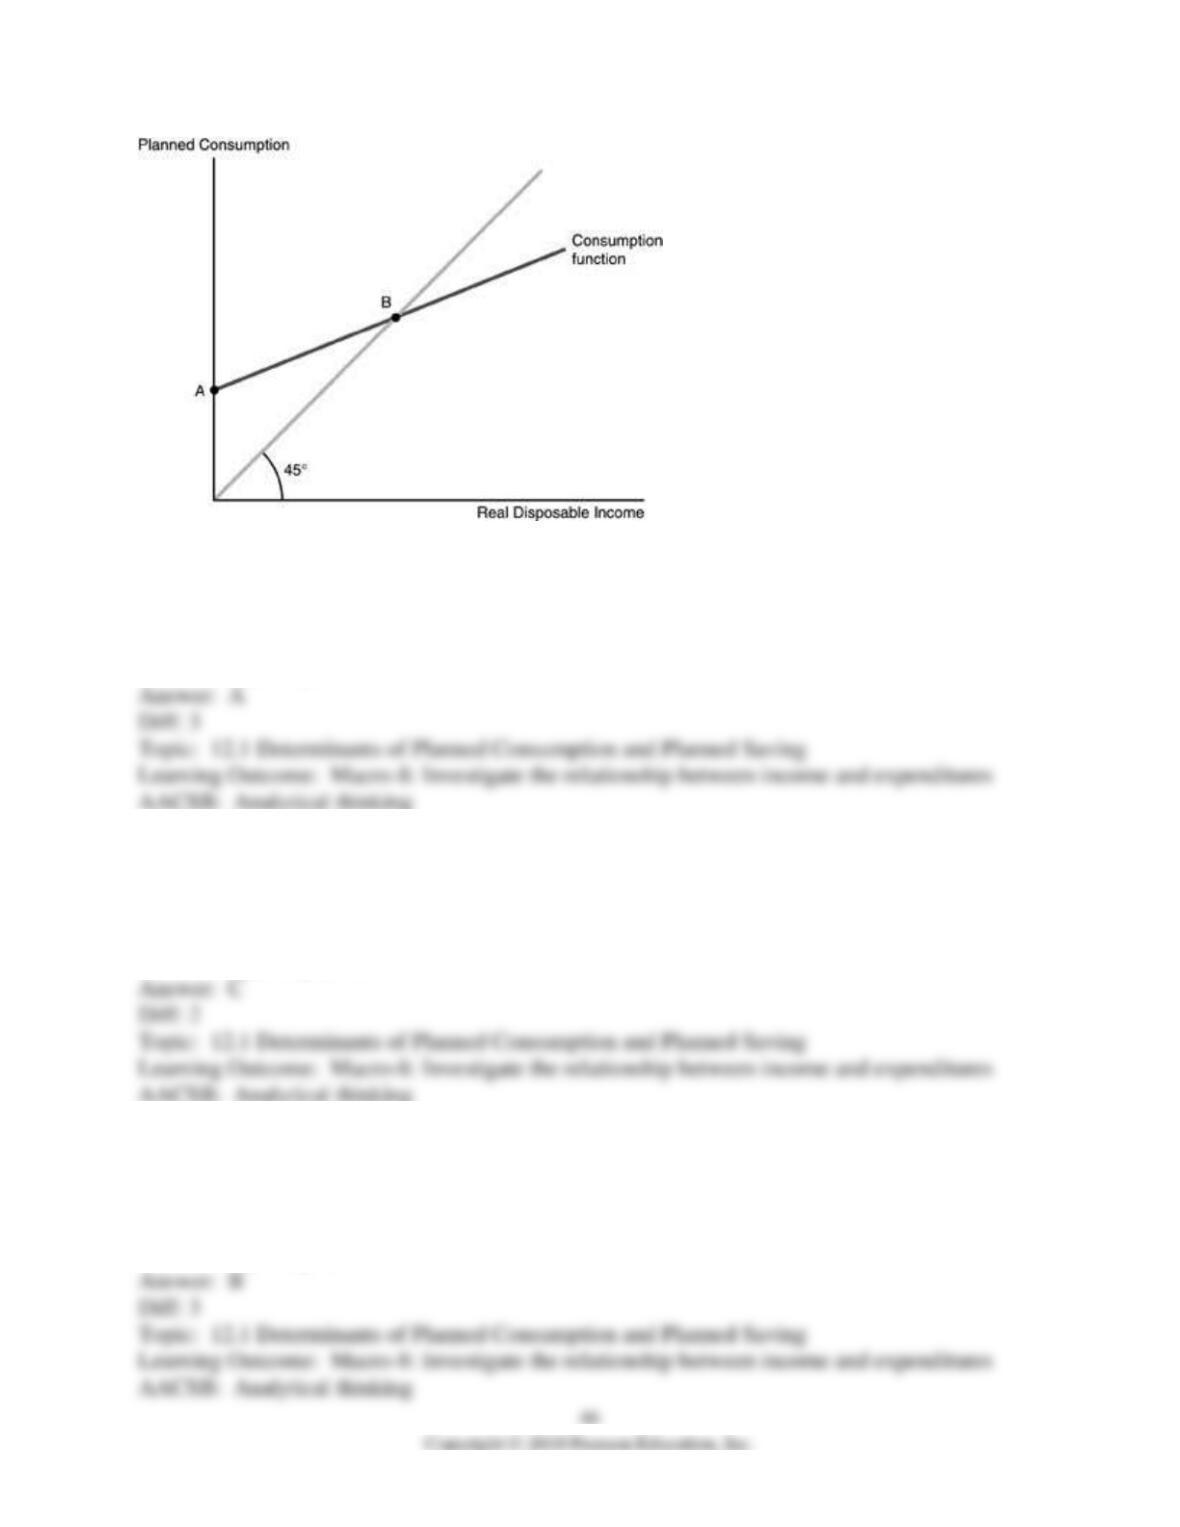
162) Refer to the above figure. Autonomous consumption is
A) only at point A.
B) to the left of point B.
C) only at point B.
D) to the right of point B.
163) Refer to the above figure. The point at which saving equals zero is
A) only at point A.
B) to the left of point B.
C) only at point B.
D) to the right of point B.
164) Refer to the above figure. Dissaving occurs,
A) only at point A.
B) to the left of point B.
C) only at point B.
D) to the right of point B.
165) Refer to the above figure. Saving occurs at
A) only at point A.
B) to the left of point B.
C) only at point B.
D) to the right of point B.
166) Along the 45° reference line
A) consumption expenditures equal saving.
B) the relationship between consumption and income is represented.
C) the average propensity to consume is represented.
D) planned real expenditures equal real disposable income.
167) Planned expenditures equal real disposable income
A) at every point on the consumption function.
B) at every point on the saving function.
C) at every point on the 45-degree line.
D) when saving equals zero.
168) The break-even point refers to
A) a zero amount of autonomous consumption.
B) the point at which planned real consumption equals real disposable income.
C) the maximum amount of dissaving a person can experience.
D) a point at which planned real consumption is greater than real disposable income.
169) Autonomous consumption
A) is the same as the break-even point.
B) gives the amount a person changes planned consumption for a change in real disposable
income.
C) is the amount of consumption that does not depend on the level of disposable income.
D) is the amount total disposable income less planned consumption.
170) The part of consumption that does NOT depend upon the level of disposable income is
A) autonomous consumption.
B) saving.
C) savings.
D) average propensity to consume.
171) Average propensity to consume
A) is the same as the break-even point.
B) gives the amount a person changes planned consumption for a change in real disposable
income.
C) is the amount of consumption that is independent of the level of disposable income.
D) is the proportion of total disposable income that is consumed.
172) The average propensity to consume is
A) real consumption expenditures divided by real disposable income.
B) real disposable income divided by real consumption expenditures.
C) real consumption expenditures divided by real saving.
D) real saving divided by real consumption expenditures.
173) Marginal propensity to consume
A) is the same as the break-even point.
B) gives the amount a person changes planned consumption for a change in real disposable
income.
C) is the amount of consumption that is independent of the level of disposable income.
D) is the proportion of total disposable income that is consumed.
174) The average propensity to consume is
A) real consumption/real disposable income.
B) real saving/real disposable income.
C) change in real consumption/change in real disposable income.
D) change in real saving/change in real disposable income.
175) The marginal propensity to save is
A) real consumption/real disposable income.
B) real saving/real disposable income.
C) change in real consumption/change in real disposable income.
D) change in real saving/change in real disposable income.
176) Which of the following is negative for the “typical” consumer at some level of real
disposable income?
A) marginal propensity to save
B) marginal propensity to consume
C) average propensity to save
D) average propensity to consume
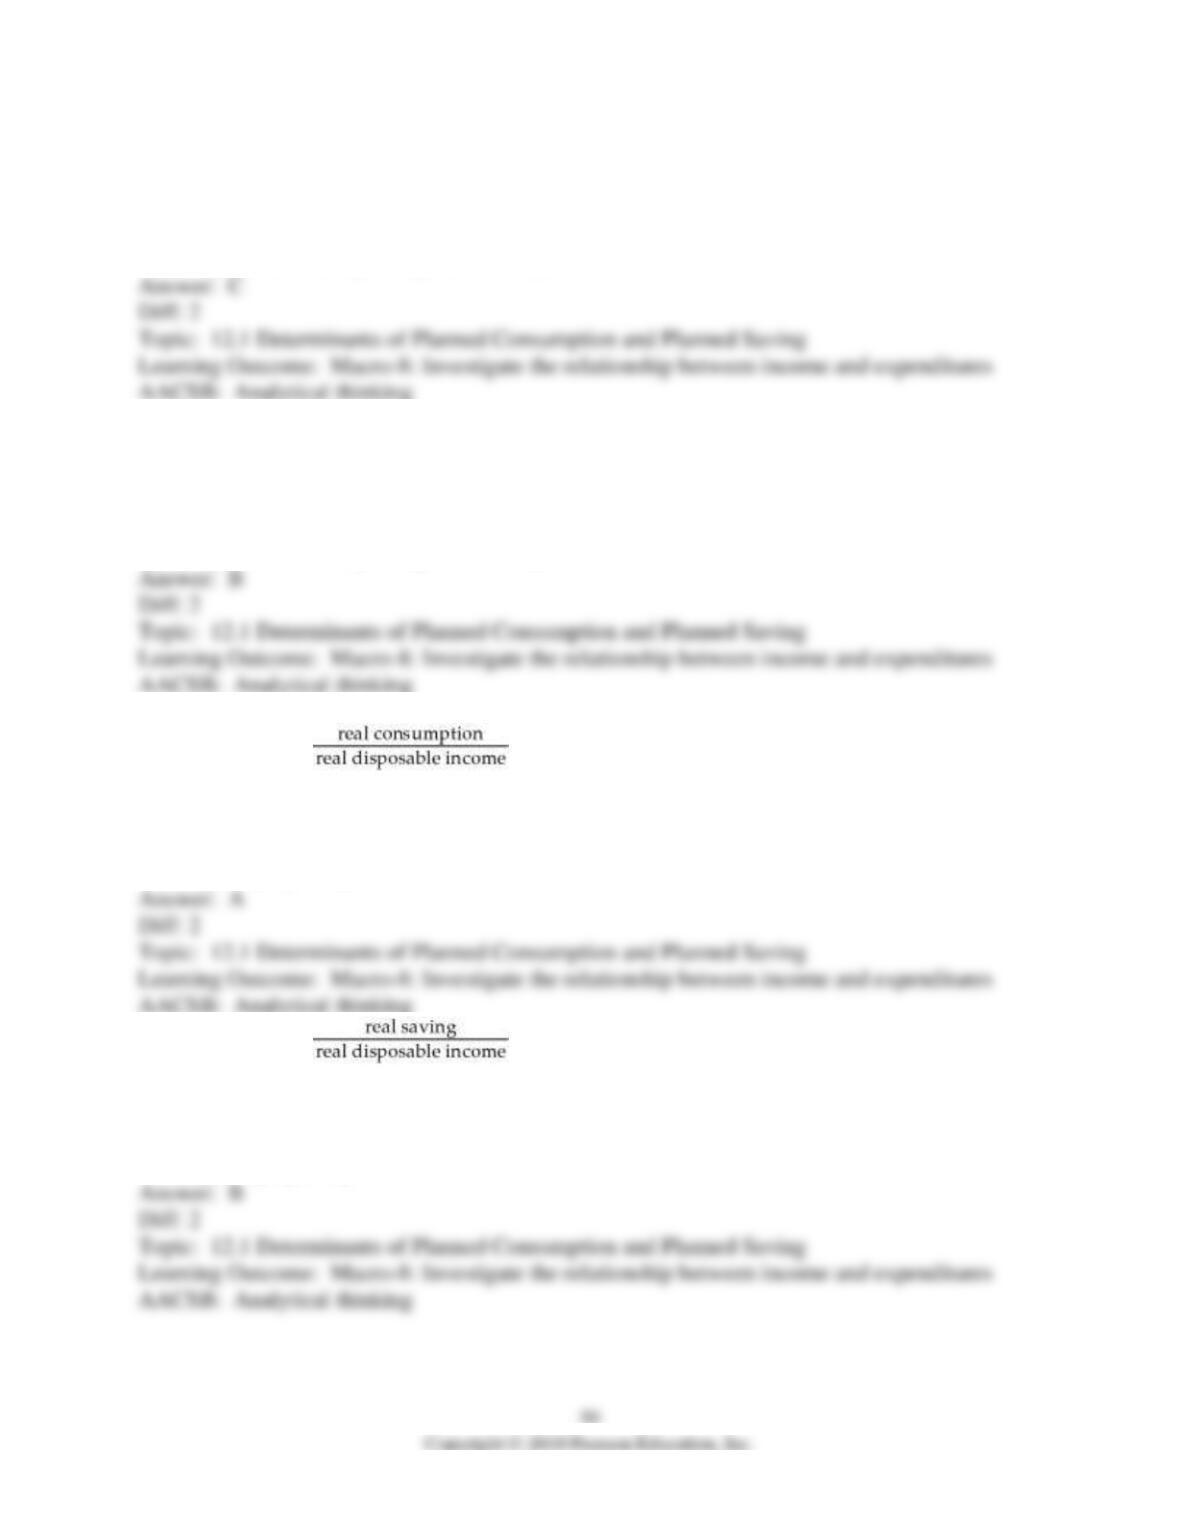
177) The marginal propensity to consume is
A) real consumption/real disposable income.
B) real saving/real disposable income.
C) change in real consumption/change in real disposable income.
D) change in real saving/change in real disposable income.
178) The average propensity to save is
A) real consumption/real disposable income.
B) real saving/real disposable income.
C) change in real consumption/change in real disposable income.
D) change in real saving/change in real disposable income.
179) The equation is the
A) average propensity to consume.
B) average propensity to save.
C) marginal propensity to consume.
D) marginal propensity to save.
180) The equation is the
A) average propensity to consume.
B) average propensity to save.
C) marginal propensity to consume.
D) marginal propensity to save.
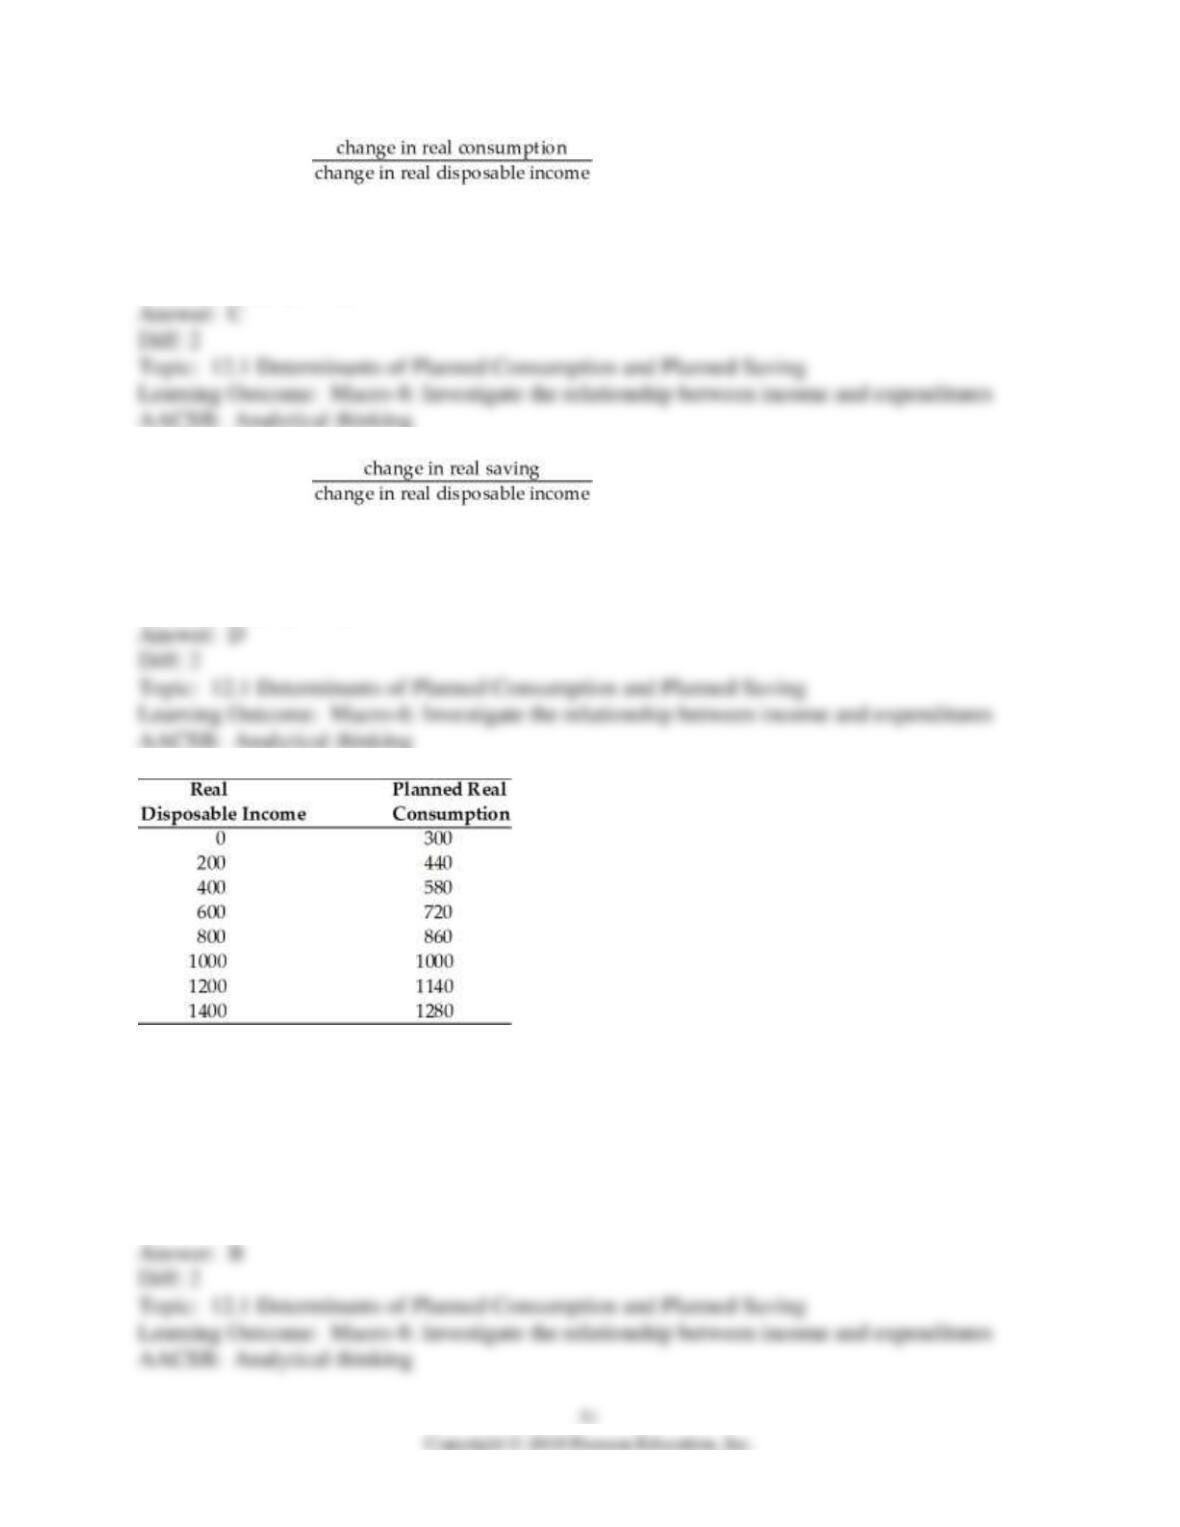
181) The equation is the
A) average propensity to consume.
B) average propensity to save.
C) marginal propensity to consume.
D) marginal propensity to save.
182) The equation is the
A) average propensity to consume.
B) average propensity to save.
C) marginal propensity to consume.
D) marginal propensity to save.
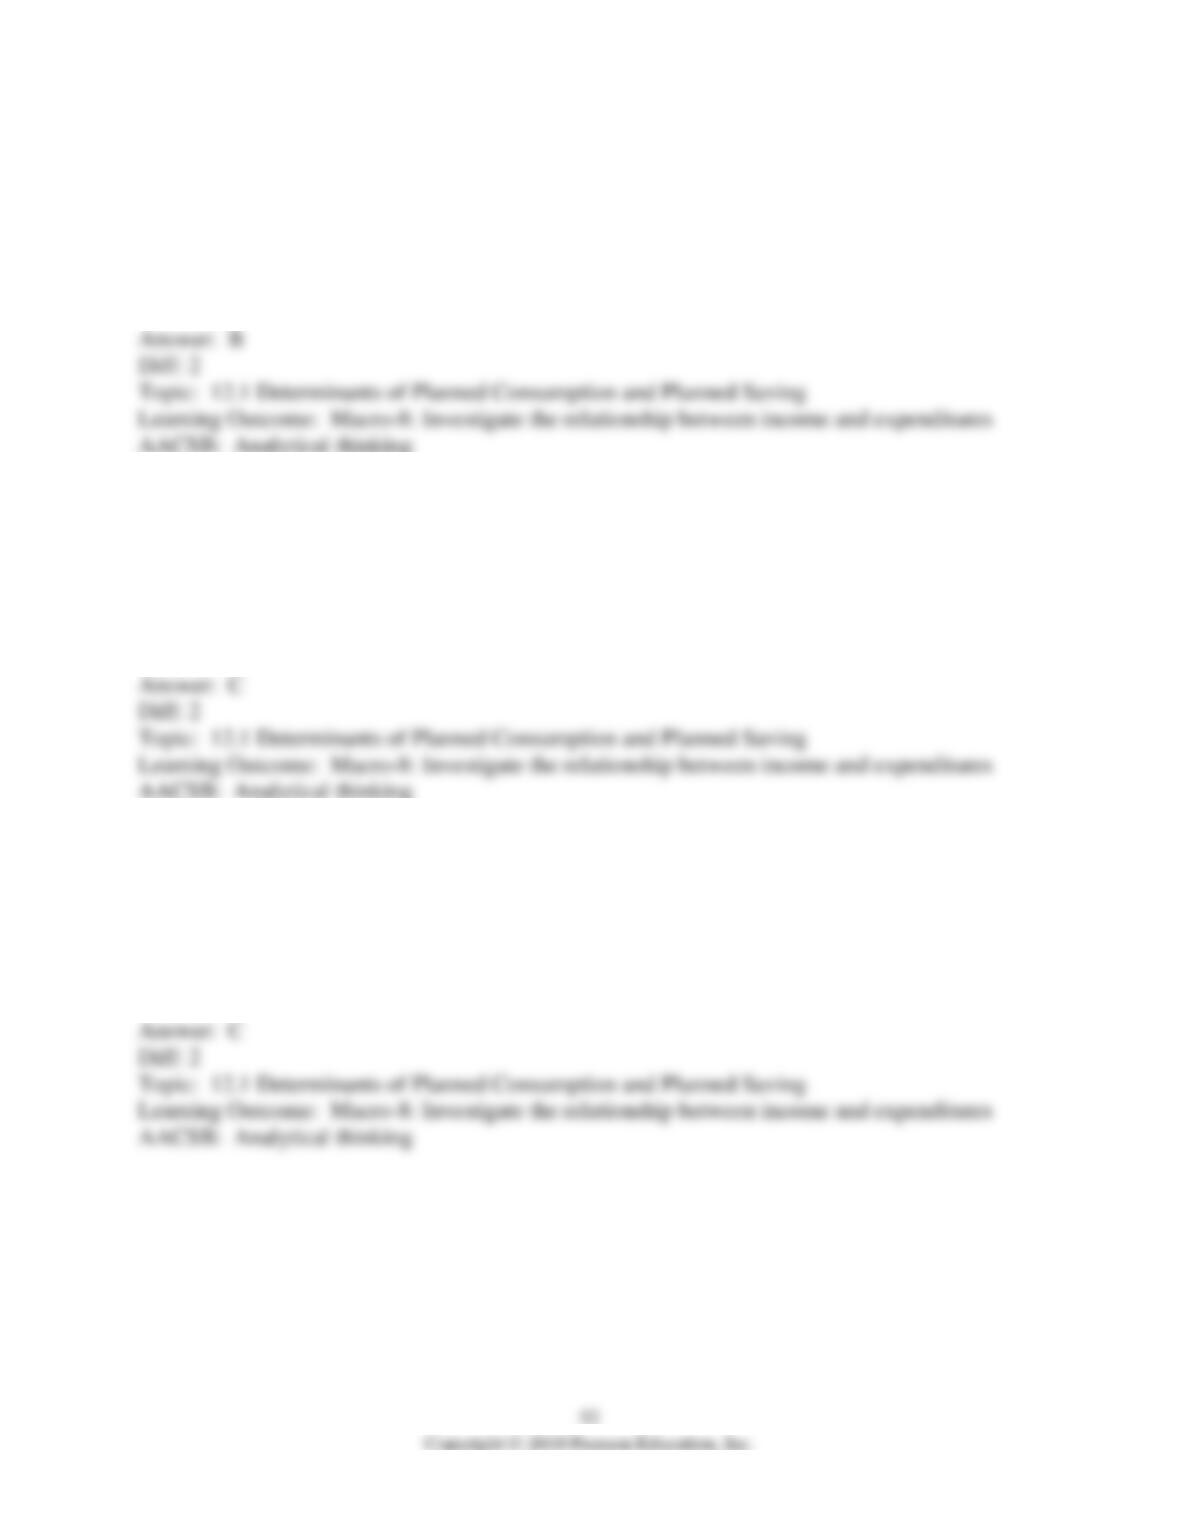
183) Refer to the above table. The table gives the combinations of real disposable income and
real consumption for a college student for a year. What does planned real saving equal when real
disposable income equals $1200?
A) 0
B) 60
C) 300
D) 1140
184) Refer to the above table. The table gives the combinations of real disposable income and
real consumption for a college student for a year. What does planned real saving equal when real
disposable income equals $600?
A) -300
B) -120
C) 0
D) 720
185) Refer to the above table. The table gives the combinations of real disposable income and
real consumption for a college student for a year. What is the value of the marginal propensity to
consume?
A) 0
B) 0.3
C) 0.7
D) 1
186) Refer to the above table. The table gives the combinations of real disposable income and
real consumption for a college student for a year. The break-even level of real disposable income
is
A) 0.
B) 6000.
C) 1000.
D) 1400.
187) Refer to the above table. The table gives the combinations of real disposable income and
real consumption for a college student for a year. What is the value of the average propensity to
consume when real disposable income equals $400?
A) -0.45
B) 0.69
C) 0.7
D) 1.45
188) Refer to the above table. The table gives the combinations of real disposable income and
real consumption for a college student for a year. What is the value of the average propensity to
save when real disposable income equals $400?
A) -0.45
B) 0.69
C) 0.7
D) 1.45
189) Refer to the above table. The table gives the combinations of real disposable income and
real consumption for a college student for a year. What is the value of the average propensity to
consume when real disposable income equals $1400?
A) 0.09
B) 0.7
C) 0.91
D) 1.1
190) Refer to the above table. The table gives the combinations of real disposable income and
real consumption for a college student for a year. What is the value of the average propensity to
save equal when real disposable income equals $1400?
A) 0.09
B) 0.7
C) 0.91
D) 1.1
191) A decrease in autonomous consumption means that
A) the consumption function shifts up.
B) the consumption function shifts down.
C) the consumption function becomes steeper.
D) the consumption function becomes less steep.
192) If the average propensity to consume is initially 0.8, the marginal propensity to consume is
0.75, and real disposable income increases by $1000, the value of saving
A) increases by $200.
B) increases by $250.
C) decreases by $250.
D) decreases by $200.
193) Suppose autonomous consumption increases. This increase in autonomous consumption
will cause which of the following to occur?
A) The consumption function shifts up.
B) The consumption function shifts down.
C) The consumption function becomes steeper.
D) The consumption function becomes less steep.
194) The ownership of stock of assets is
A) debt.
B) wealth.
C) capital investment.
D) capital consumption.
195) The average value of stock shares falls by 10 percent. Other things being equal, we would
expect
A) an increase in the marginal propensity to consume.
B) a decrease in the marginal propensity to consume.
C) a shift up of the consumption function.
D) a shift down of the consumption function.
196) Which of the following statements is TRUE?
A) APC + APS = 1
B) MPC + APS < 1
C) APC + MPS = 1
D) APC + MPS = MPC + APS
197) Another way of stating that investment is independent of real disposable income is to say
that it is
A) inversely related.
B) substitutable.
C) complementary.
D) autonomous.
198) Which one of the following statements is TRUE?
A) In the classical model, the supply of saving is determined by the rate of interest.
B) In the classical model, the supply of saving is determined by the level of income.
C) In the Keynesian model, the supply of saving is determined by the rate of interest.
D) In the Keynesian model, the supply of saving is determined by the level of investment.
199) The consumption function shows the relationship between
A) interest rates and planned real consumption.
B) employment and planned real consumption.
C) the price level and planned real consumption.
D) real disposable income and planned real consumption.
200) The relationship that tells us how much a person intends to spend at various levels of
income is
A) the income function.
B) the expenditure function.
C) the consumption function.
D) the autonomous spending function.
201) The part of consumption that is independent of disposable income is called
A) automatic consumption.
B) fixed consumption.
C) personal consumption.
D) autonomous consumption.
202) Which of the following is TRUE?
A) APC + MPS > 1
B) MPC + MPS = 1 -APC
C) APC + APS = MPS + MPS
D) APC + APS < 1
203) Which of the following is FALSE?
A) 1 – MPC = MPS
B) 1 + MPS = MPC
C) 1 – APS = APC
D) MPC + MPS = 1
204) Which of the following is TRUE?
A) APC + MPS = 1
B) APC + APS = 1
C) 1 + APC = APS
D) APC – APS = 1
205) Which one of the following is TRUE?
A) APS = 1 / MPS
B) APC = 1 – APS
C) MPS + APS = 1
D) APC * APS = 1
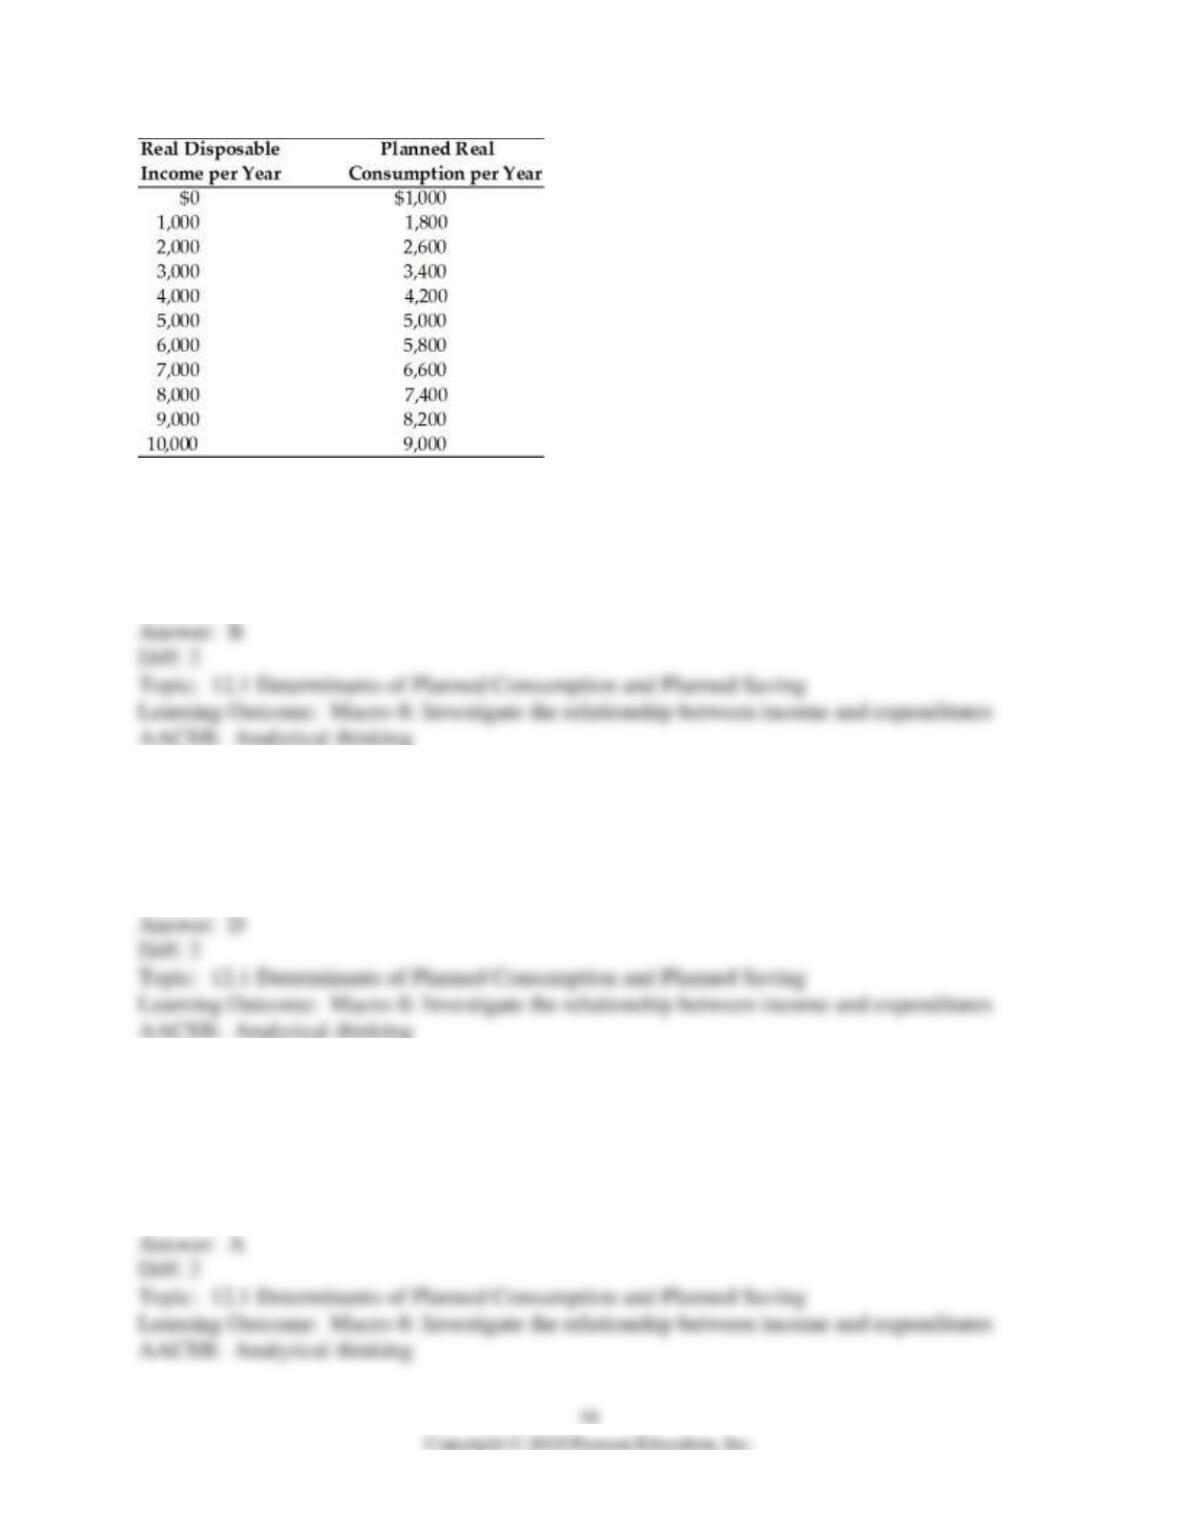
206) In the above table, the level of autonomous consumption is
A) $0.
B) $1,000.
C) $5,000.
D) $9,000.
207) In the above table, dissaving occurs at every level of income below
A) $10,000.
B) $8,000.
C) $7,000.
D) $5,000.
208) In the above table, the marginal propensity to consume when disposable income changes
from $7,000 to $8,000 is
A) 0.8.
B) 0.75.
C) 0.6.
D) 0.5.
209) In the above table, the marginal propensity to save when disposable income changes from
$5,000 to $6,000 is
A) 0.1.
B) 0.2.
C) 0.8.
D) -0.2.
210) In the above table, the average propensity to save when disposable income is $5,000 is
A) 0.2.
B) 0.1.
C) 0.0.
D) -0.1.
211) In the above table, the average propensity to consume when income is $9,000 is
A) 0.9.
B) 0.1.
C) 0.0.
D) 0.8.
212) At the point at which planned real consumption spending is equal to real disposable income
A) the consumption function is above the 45-degree line.
B) the consumption function is below the 45-degree line.
C) the consumption function intersects the 45-degree line.
D) the consumption function intersects the savings function.
213) Which one of the following would shift your consumption function in an upward direction?
A) an increase in your wealth
B) a decrease in your wealth
C) an increase in your real disposable income
D) a decrease in your real disposable income
214) According to Keynes, the most important determinant of an individual’s real saving is
A) interest rates.
B) the foreign exchange rate.
C) the individual’s real disposable income.
D) the level of investment.
215) Assuming that Yd = $10,000 and C = $12,000, we would find that the average propensity to
consume would be equal to
A) 0.9.
B) 1.2.
C) 1.1.
D) 0.8.
216) Assuming that Yd = $10,000 and C = $12,000, we would find that the average propensity to
save equals
A) 0.8.
B) 1.2.
C) -0.2.
D) -0.8.