77) When a family’s income is low and it is spending more on consumption than it is receiving in
income
A) the APC must be increasing.
B) the APC must be equal to the ratio of planned consumption expenditure to total saving.
C) the MPC must be zero.
D) some segment of the consumption function curve lies above the 45-degree line, indicating
dissaving.
78) At the break-even point for the consumption function
A) saving is positive.
B) saving is negative.
C) saving is zero.
D) the marginal propensity to consume equals l.
79) If saving equals $100 when real disposable income equals $1,000, the break-even income is
A) less than $1,000.
B) greater than $1,000.
C) equal to $1,000.
D) cannot be determined using the above information.
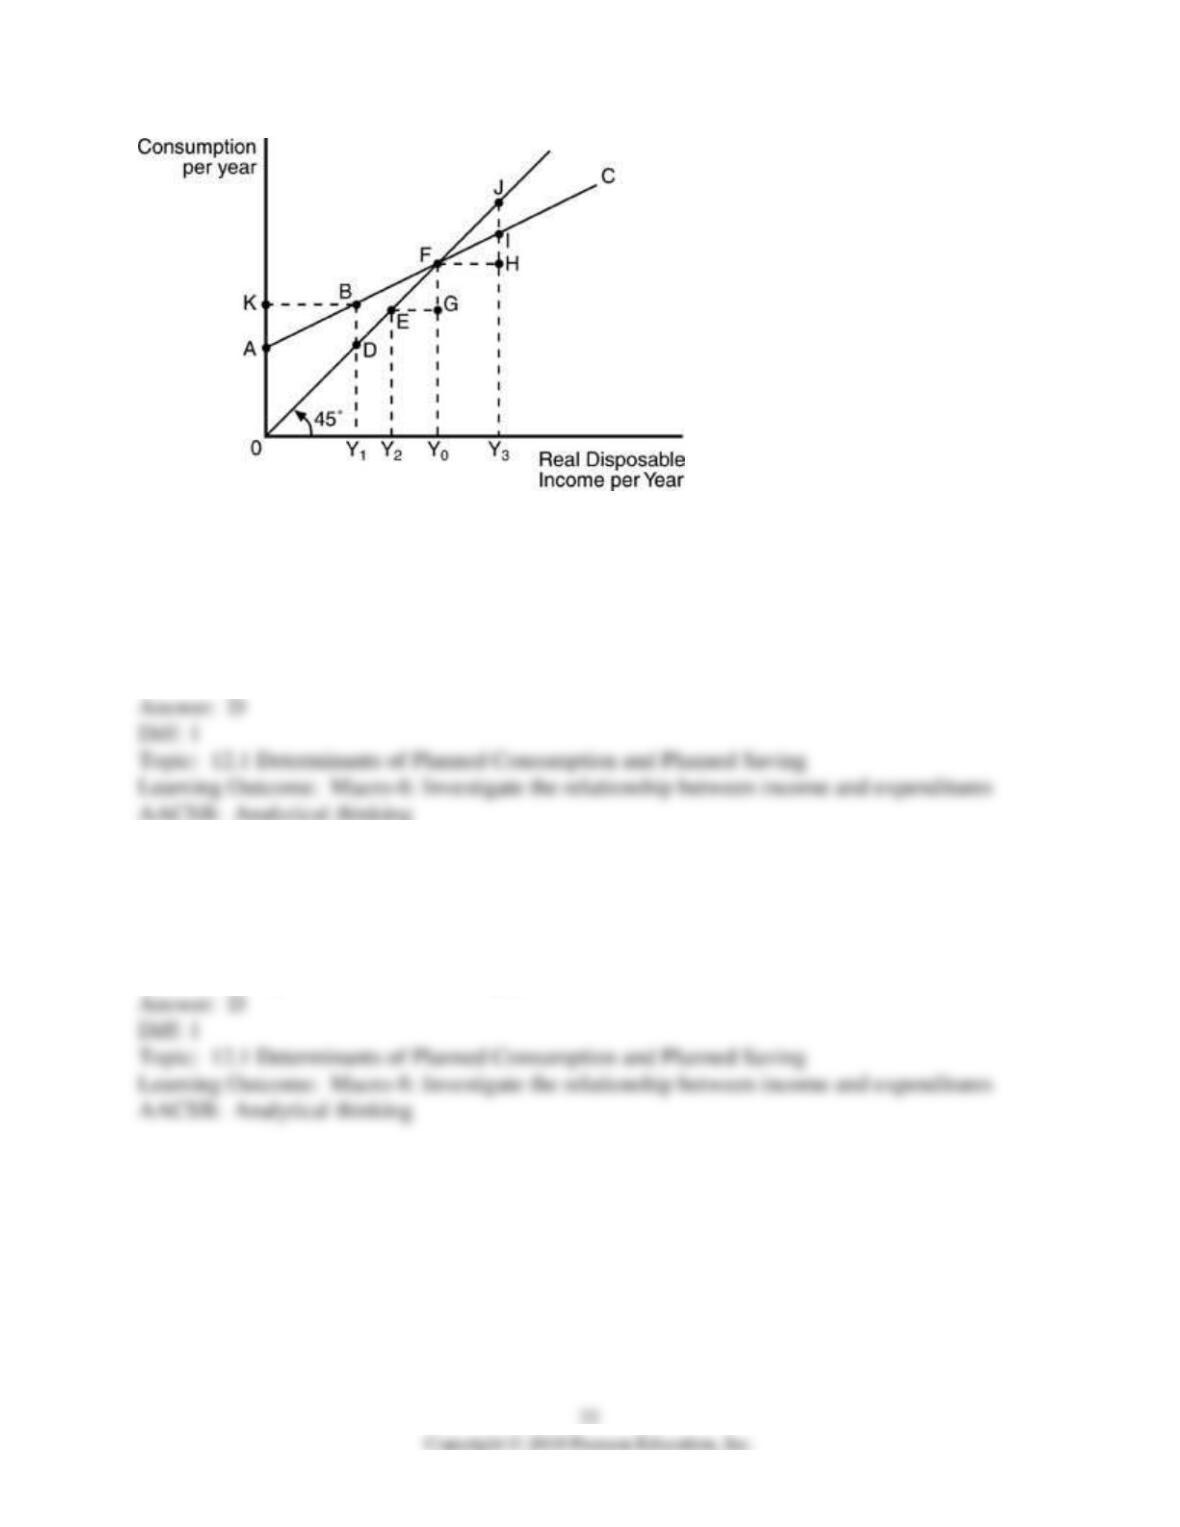
80) According to the above figure, planned consumption and income are equal at an income level
of
A) Y2.
B) Y3.
C) Y1.
D) Y0.
81) According to the above figure, at an income level of Y1,
A) the economy saves an amount equal to BD.
B) the marginal propensity to save is falling.
C) the average propensity to save is greater than one.
D) the economy dissaves an amount equal to BD.
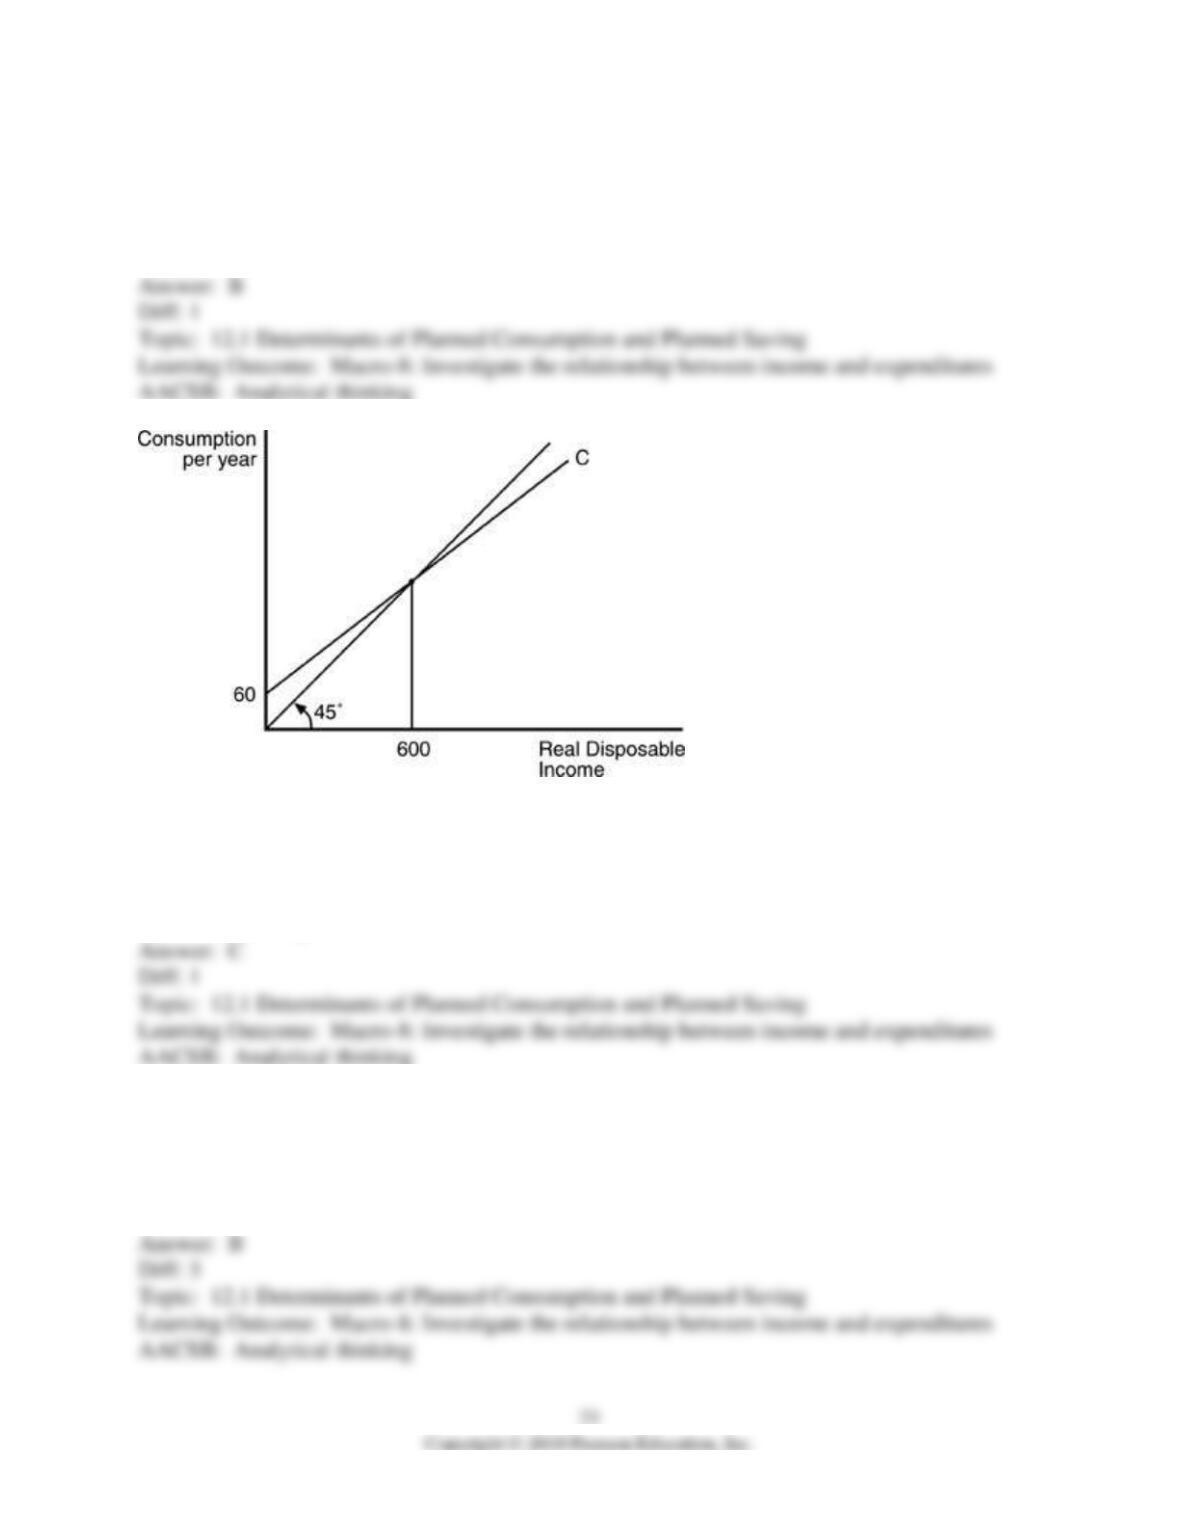
82) According to the above figure, the average propensity to save (APS) is zero at point
A) D.
B) F.
C) I.
D) J.
83) In the above figure, when disposable income is greater than 600
A) saving is negative.
B) the MPC is greater than 1.
C) saving is positive.
D) the MPS is negative.
84) In the above figure, the marginal propensity to consume (MPC) equals
A) 0.8.
B) 0.9.
C) 0.75.
D) 0.85.
85) In the above figure, a change in autonomous consumption to 100 would cause the
consumption function to
A) become steeper.
B) become flatter.
C) shift down.
D) shift up.
86) In the above figure, saving will equal zero when real disposable income equals
A) 0.
B) 60.
C) 600.
D) 500.
87) In the above figure, when real disposable income equals 600
A) there is dissaving.
B) consumption is less than disposable income.
C) real disposable income exceeds consumption.
D) consumption equals real disposable income.
88) In the above figure, when real disposable income is less than 600, then
A) consumption is less than disposable income.
B) consumption is more than disposable income.
C) consumption is the same as disposable income.
D) the MPC will fall.
89) Along the portion of the consumption function that lies above the 45-degree line, saving is
A) positive.
B) negative.
C) equal to zero.
D) equal to consumption.
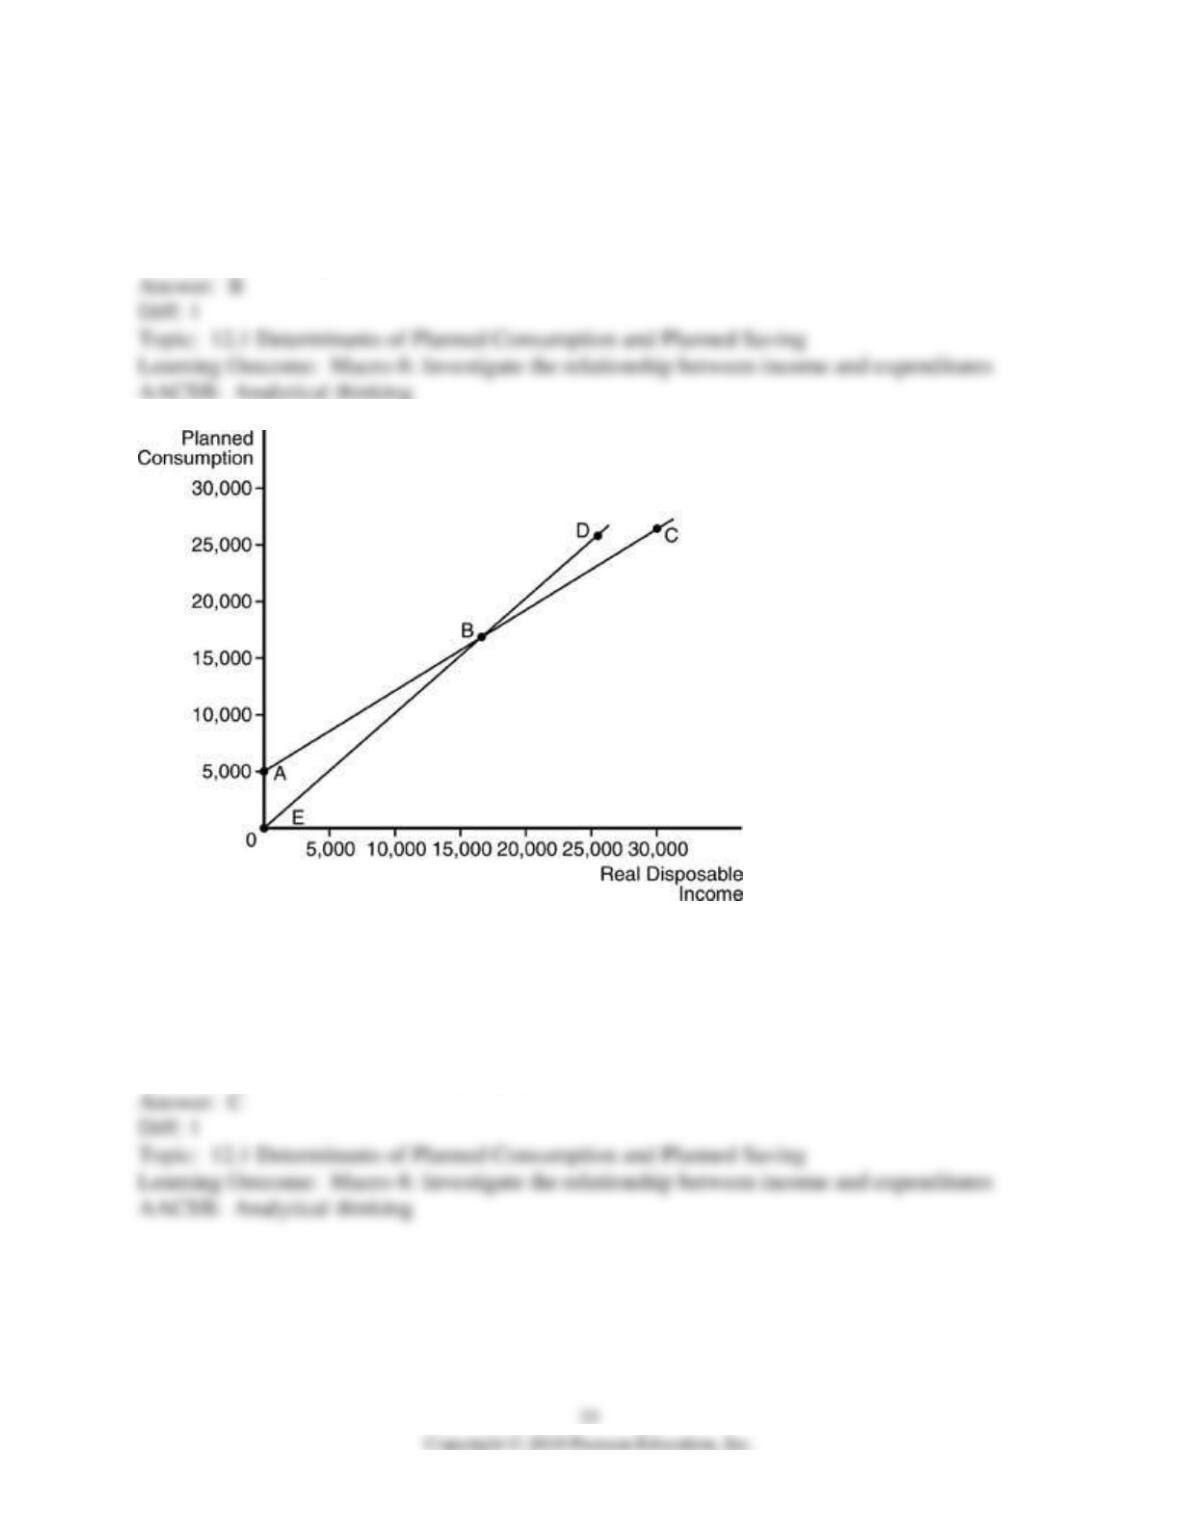
90) Refer to the above figure. If the MPC is unchanged and level of autonomous consumption
increases, what occurs?
A) Line EBD will shift up.
B) Line ABC will drop down.
C) Line ABC shifts up.
D) Line EBD rotates and becomes steeper.
91) Refer to the above figure. Line ABC is called
A) the 45-degree line.
B) the consumption function.
C) the saving function.
D) aggregate supply.
92) Refer to the above figure. Line EBD is called
A) the 45-degree line.
B) the consumption function.
C) the saving function.
D) aggregate demand.
93) According to the above figure, autonomous consumption equals
A) $0.
B) $5,000.
C) $20,000.
D) -$5,000.
94) Refer to the above figure. If real disposable income is less than $5,000, then saving is
A) 0.
B) negative.
C) positive.
D) none of the above: cannot be determined with the given information.
95) Where the consumption function intersects the 45-degree line
A) savings will be negative.
B) consumption will equal only autonomous consumption.
C) the average propensity to consume is 0.5.
D) saving will be zero.
96) If the marginal propensity to consume is unchanged and autonomous consumption
expenditures increase, then
A) saving at every level of disposable income increases.
B) the break-even disposable income decreases.
C) the break-even disposable income increases.
D) saving is unaffected.
97) Autonomous consumption is
A) consumption spending that is earned rather than transferred from the government.
B) consumption spending that does not depend on the level of income.
C) the amount spent on consumption when saving equals zero.
D) consumption spending when the marginal propensity to consume is 1.
98) In economics, the term “autonomous” means
A) existing independently.
B) non-economic related.
C) disposable income.
D) excessive spending.
99) When a household’s disposable income falls to zero, what do we expect will happen?
A) The household’s consumption spending also falls to zero.
B) The household will maintain a positive level of saving.
C) The household will maintain its previous level of consumption.
D) Consumption will fall to the level of autonomous consumption.
100) If the level of consumption is $120 billion and disposable income is $150 billion, then the
A) APC = 0.75 and saving is positive.
B) APC = 0.8 and saving is negative.
C) APC = 0.8 and saving is positive.
D) APC = 0.75 and saving is negative.
101) If disposable income = $200 billion and the APC = 0.8, then saving
A) is $40 billion.
B) is $160 billion.
C) is $280 billion.
D) cannot be determined.
102) If the marginal propensity to save is 0.4 and disposable income increases from $1,000 to
$2,000, saving will increase
A) $100.
B) $200.
C) $300.
D) $400.
103) If the marginal propensity to save is 0.4 and disposable income decreases from $2,000 to
$1,000, saving will
A) decrease by $400.
B) increase by $400.
C) decrease by $80.
D) increase by $80
104) If consumption is $650 when real disposable income is $1,000, the average propensity to
consume is
A) 0.80.
B) 0.65.
C) 0.065.
D) 0.08.
105) The average propensity to consume is the
A) percentage of total disposable income consumed.
B) rate at which real disposable income changes as autonomous consumption changes.
C) ratio of changes in planned consumption to changes in real disposable income.
D) slope of the consumption function.
106) Average propensity to consume (APC) equals
A) change in planned consumption divided by change in real disposable income.
B) planned consumption divided by real disposable income.
C) real disposable income divided by planned consumption.
D) change in real disposable income divided by change in planned consumption.
107) As real disposable income decreases, the average propensity to consume (APC)
A) is always be below MPC.
B) decreases.
C) increase.
D) remains unchanged.
108) If the average propensity to consume is 0.75, then the average propensity to save is
A) 1.25
B) 0.25.
C) 0.75.
D) 1.33.
109) The average propensity to consume (APC) equals
A) real disposable income divided by consumption expenditures.
B) consumption expenditures divided by real disposable income.
C) the change in consumption expenditures divided by the change in real disposable income.
D) the change in real disposable income divided by the change in consumption expenditures.
110) If the average propensity to save (APS) is 0.70, then this means
A) people are saving 70 percent of their disposable income.
B) people are spending 70 percent of their disposable income.
C) people are saving 70 percent of their amount of consumption.
D) people are spending 70 percent of their amount of saving.
111) When the average propensity to save (APS) is 0.25, then this means
A) people are spending 25 percent of their disposable income.
B) people are spending 75 percent of their disposable income.
C) people are saving $0.25 of the last dollar earned.
D) people are spending 40 percent of their disposable income and investing the remaining 60
percent.
112) If the marginal propensity to save (MPS) = 0.3, then
A) the MPC = 0.7.
B) the APS = 0.3.
C) the APC = 0.7.
D) consumption equals $700 when income equals $1,000.
113) The marginal propensity to consume (MPC) can best be defined as that fraction of
A) real disposable income that is consumed.
B) real disposable income that is not consumed.
C) a change in real disposable income that is spent.
D) a change in real disposable income that is saved.
114) The fraction of a change in real disposable income that is spent is referred to as the
A) APC.
B) MPC.
C) MPS.
D) APS.
115) The marginal propensity to consume (MPC)
A) shows how much real disposable income changes when consumption falls.
B) is greater than 1 only if the marginal propensity to save is greater than 1.
C) shows how much of an extra dollar of real disposable income is spent.
D) shows the percentage of real disposable income consumed at each level of income.
116) The marginal propensity to consume explains how much of the next dollar of disposable
income
A) a household will spend.
B) a business will invest.
C) the government will spend.
D) foreign residents will use to purchase domestic exports.
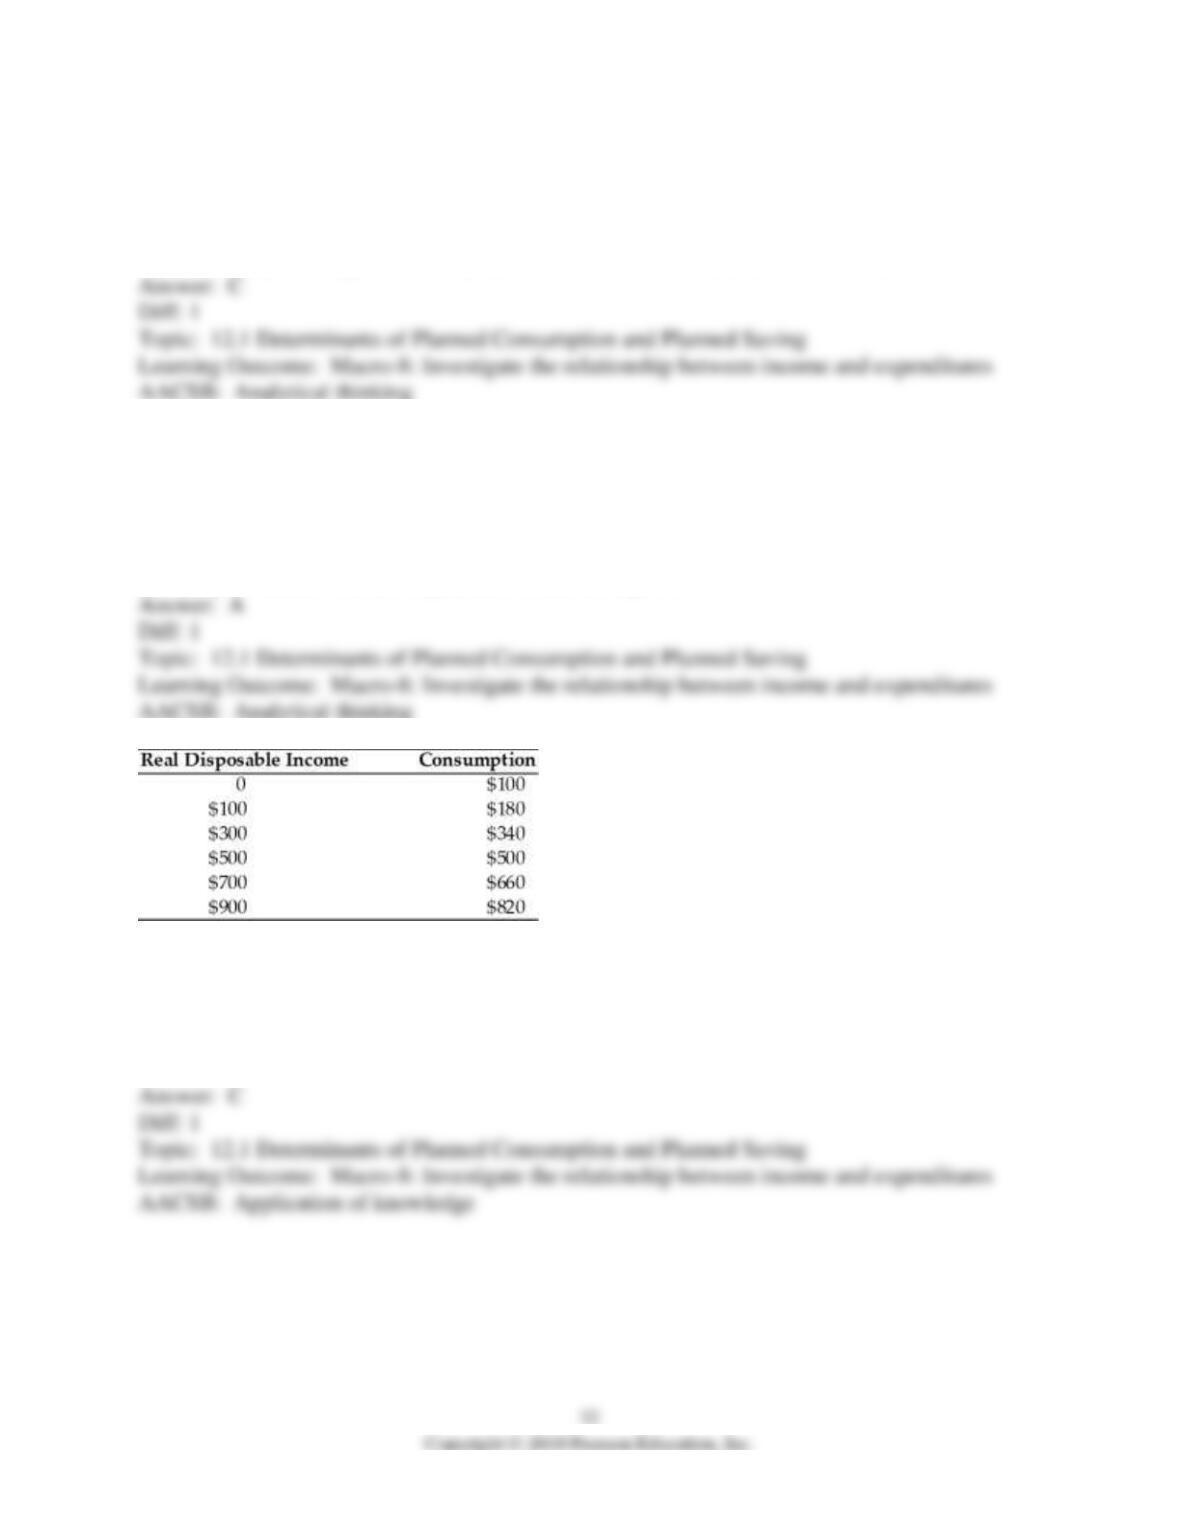
117) In the above table, the marginal propensity to consume (MPC) is
A) 0.9.
B) 0.75.
C) 0.8.
D) 0.85.
118) In the above table, saving is positive when real disposable income is greater than
A) zero.
B) $100.
C) $300.
D) $500.
119) In the above table, saving equals zero when real disposable income equals
A) $0.
B) $200.
C) $300.
D) $500.
120) In the above table, the marginal propensity to save is
A) 0.8.
B) 0.6.
C) 0.2.
D) 0.4.
121) The arithmetic value of (1 – MPC) equals
A) APC.
B) MPS.
C) APS.
D) NDP.
122) The ratio of the change in consumption to the change in disposable income is the
A) marginal propensity to consume.
B) marginal propensity to save.
C) average propensity to consume.
D) average propensity to save.
123) The marginal propensity to consume is calculated by
A) dividing consumption by income.
B) dividing income by consumption.
C) dividing the change in income by the change in consumption.
D) dividing the change in consumption by the change in income.
124) If the average propensity to consume is 1.0, the marginal propensity to consume is 0.6, and
real disposable income increases by $100, the additional saving is
A) $0.
B) $40.
C) $60.
D) $100.
125) If the MPC is 0.75, then the MPS is
A) 0.25.
B) 1.39.
C) 1.25.
D) cannot be determined without more information.
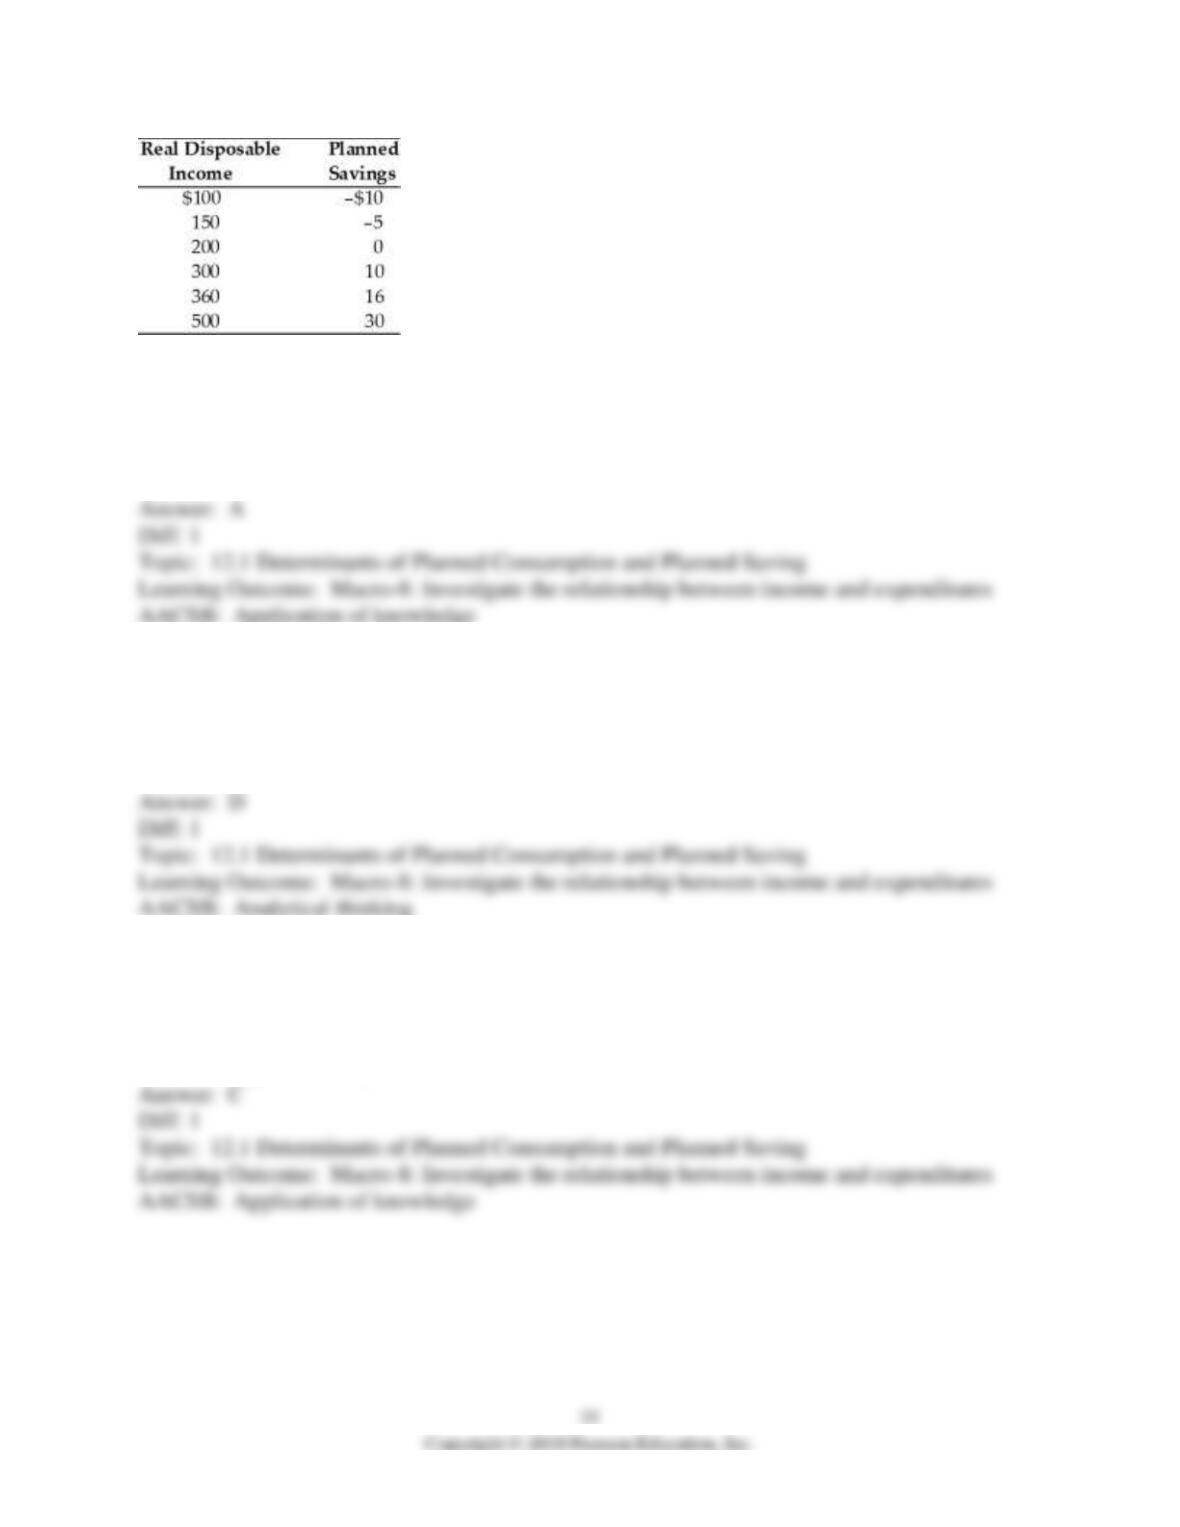
126) According to the above table, the value of the MPC is
A) 0.9.
B) 0.1.
C) 0.5.
D) 0.7.
127) According to the above table, as the level of real disposable income decreases
A) the marginal propensity to save increases.
B) the APC increases.
C) the marginal propensity to consume decreases.
D) the APS decreases.
128) According to the above table, the value of MPS is
A) 0.9.
B) 0.2.
C) 0.1.
D) increasing as real disposable income rises.
129) It is conceivable that the APC, APS, MPC, and MPS could simultaneously be
A) APC = 1.0; APS = 0.1; MPC = 0.85; MPS = 0.25.
B) APC = 0.8; APS = 0.2; MPC = 1.1; MPS = 0.1.
C) APC = 1.3; APS = -0.3; MPC = 0.8; MPS = 0.2.
D) APC = 1.0; APS = 0; MPC = 0.15; MPS = 0.15.
130) What can we say about APC + APS and MPC + MPS?
A) Each must sum to 1.
B) MPC + MPS = 100% of total income.
C) APC + APS = 100% of the change in income.
D) MPC + MPS always equals 1, but the sum of APC + APS can vary.
131) Which of the following would be expected to shift the consumption function down?
A) increases in wealth
B) expectations of more business profits ahead
C) decreases in the nation’s population
D) increases in real disposable income
132) The non-income determinants of consumption include all of the following EXCEPT
A) stock of assets owned by household.
B) changes in business investment spending.
C) the interest rate.
D) real wealth.
133) All of the following shift the consumption function upward EXCEPT
A) an increase in wealth.
B) a decrease in the rate of interest.
C) an increase in income.
D) an expectation of better economic conditions.
134) The consumption function shifts upward when
A) real income increases.
B) saving increases.
C) households’ real wealth increases.
D) households buy more imports.
135) The consumption function will shift downward when
A) the rate of interest decreases.
B) household saving decreases.
C) real disposable income increases.
D) household wealth decreases.
136) According to Keynes, the primary determinant of Amy’s saving is
A) the nominal interest rate.
B) the real interest rate.
C) the level of Amy’s consumption spending.
D) the level of Amy’s real current income.
137) Which of the following is correct?
A) 1 + MPS = MPC
B) 1 – MPS = MPC
C) 1 – MPS = MPC + 1
D) 1 – MPS = MPC – 1
138) The consumption function relates
A) a household’s consumption to its wealth.
B) planned household consumption to real disposable income.
C) planned household consumption and real interest rates.
D) real disposable incomes earned by households with the level of unexpected consumption
spending.
139) How much people plan to consume at various levels of disposable income is known as
A) dissaving.
B) investment.
C) the consumption function.
D) aggregate demand.
140) The relationship between planned real consumption expenditures of households and their
current level of real disposable income is
A) investment.
B) dissaving.
C) saving.
D) the consumption function.
141) In the Keynesian model, consumption
A) is positively related to the interest rate but negatively related to a temporary change in
income.
B) is positively related to income but saving is not systematically related to either income or
interest rates.
C) and saving are negatively related to the real interest rate.
D) and saving are positively related to income.
142) Dissaving occurs when
A) the amount of consumption exceeds the amount of saving.
B) saving exceeds consumption.
C) consumption spending exceeds disposable income.
D) people save smaller and smaller amounts.
143) A situation in which spending exceeds income is
A) autonomous consumption.
B) positive saving.
C) average propensity to save.
D) dissaving.
144) As real disposable income decreases, consumption expenditures
A) decrease by the same amount.
B) decrease by a smaller amount.
C) increase by a larger amount.
D) remain constant.
145) When disposable income equals consumption expenditures, then
A) saving is zero.
B) saving is greater than income.
C) both saving and savings are zero.
D) we can’t tell what saving is without more information.
146) At a level of real disposable income of 0, consumption is $1000. Then
A) saving equals 0.
B) saving equals -$1000.
C) savings equal -$1000.
D) saving equals $1000.
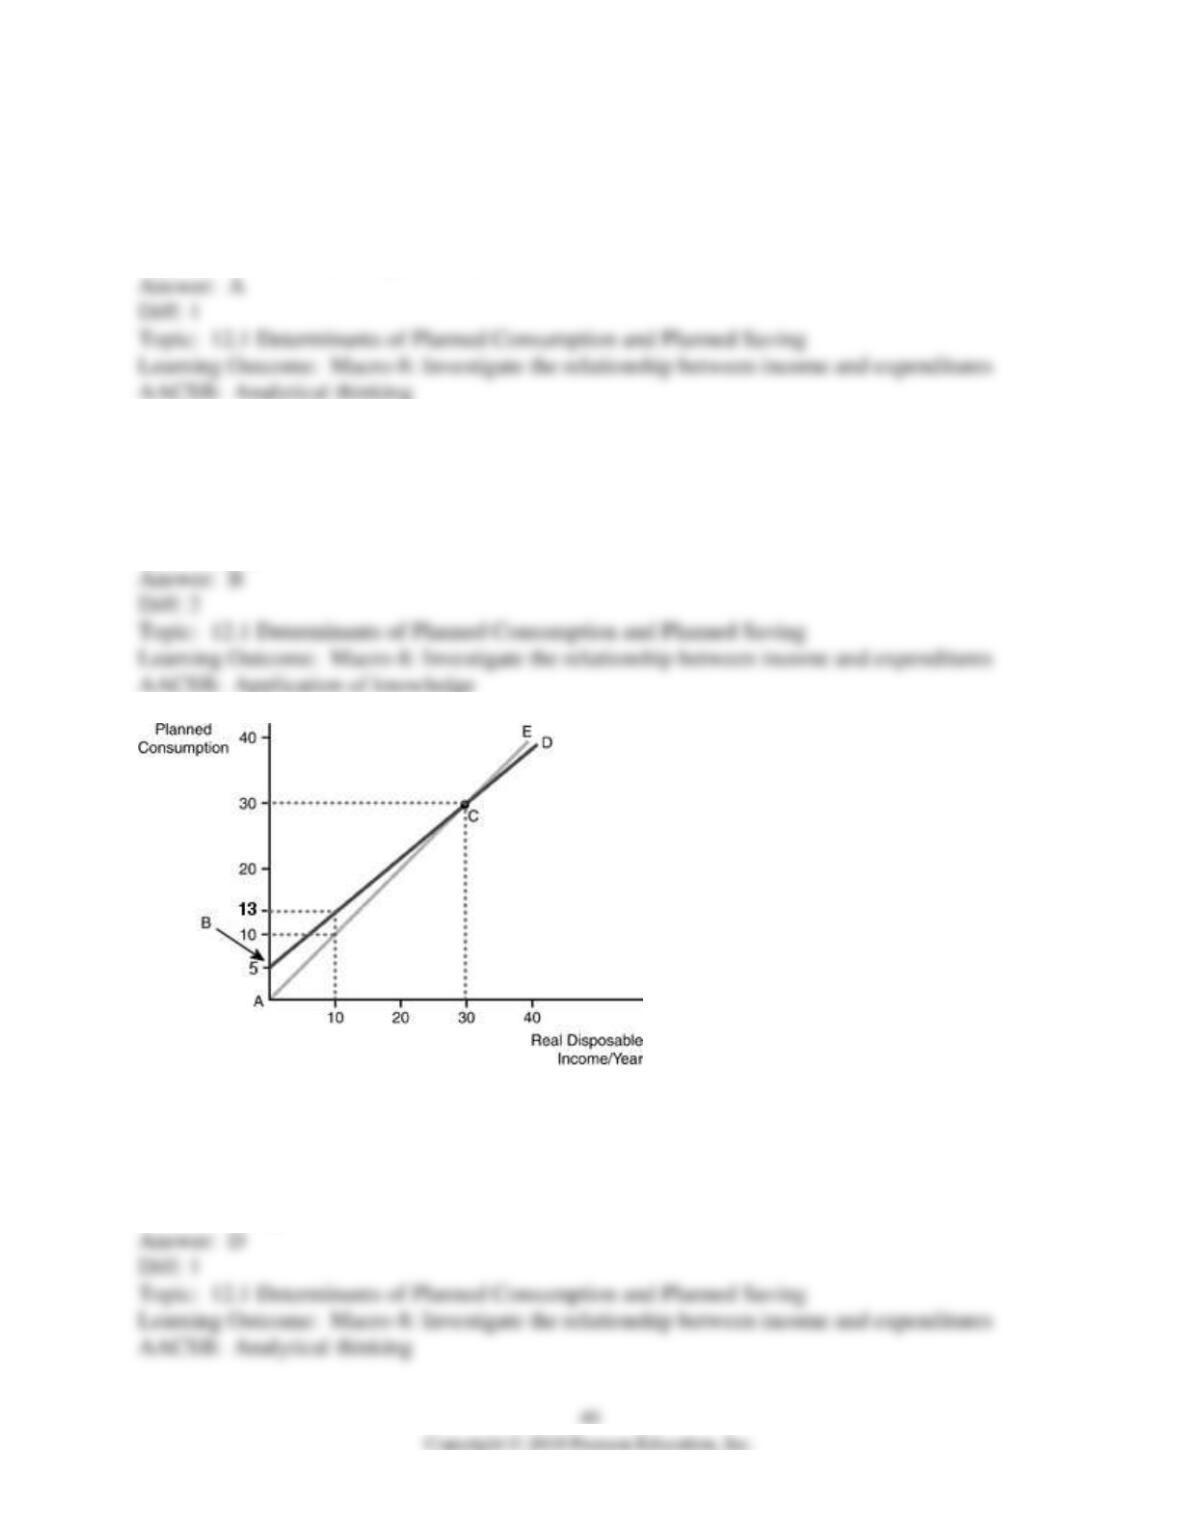
147) Refer to the above figure. Line BCD is called
A) the saving function.
B) the savings function.
C) the 45-degree line.
D) the consumption function.