115
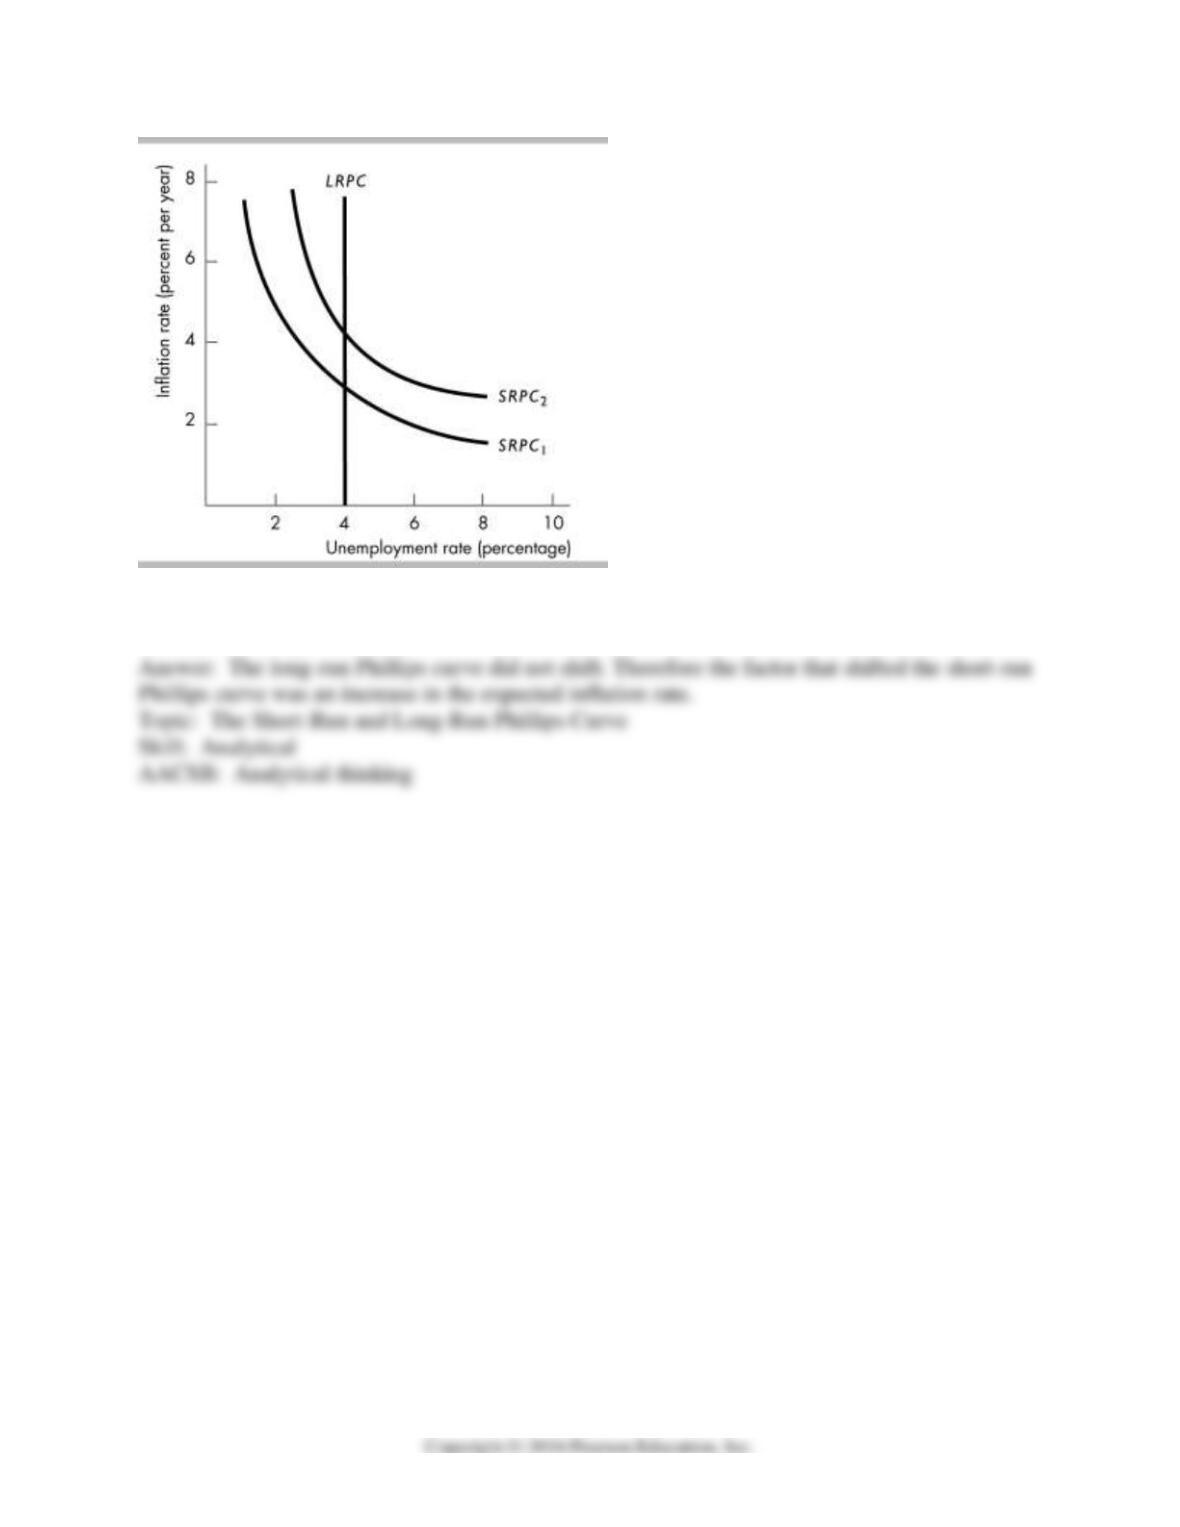
2) In the above figure, what factor might have led to the shift in the short-run Phillips curve from
SRPC1 to SRPC2?
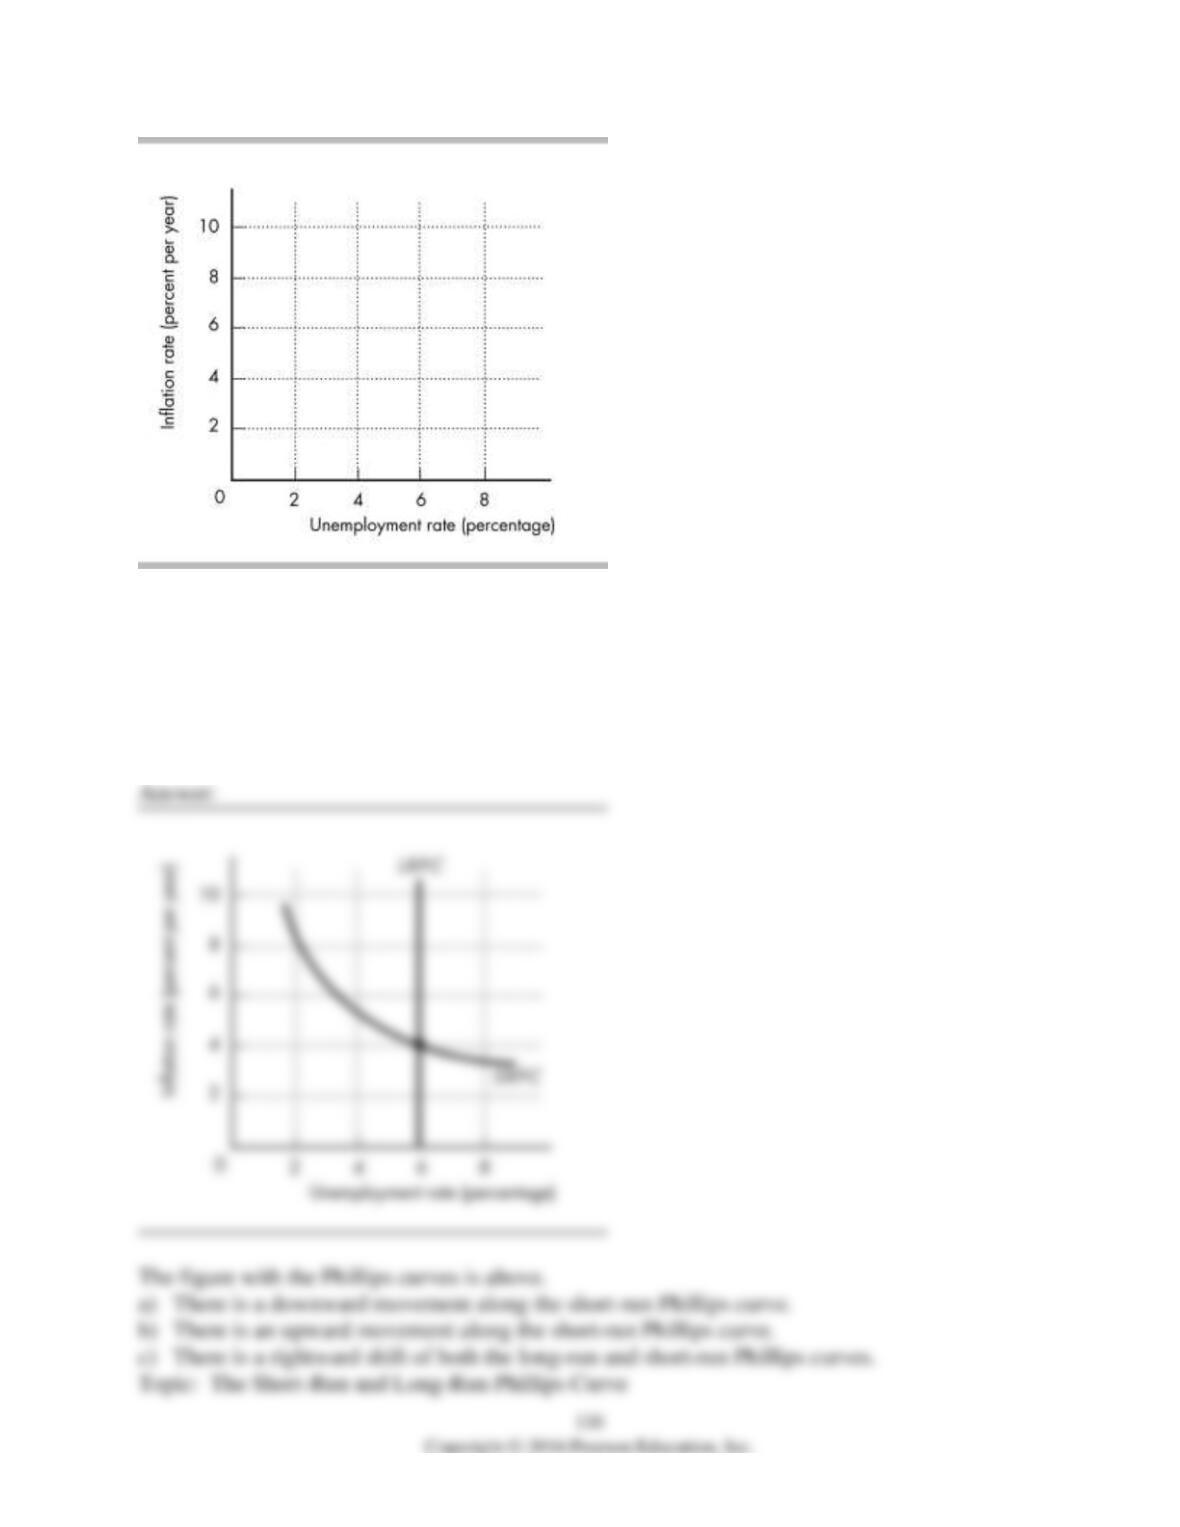
3) In the figure above, draw a short-run Phillips curve and a long-run Phillips curve if the
expected inflation rate is 4 percent and the natural unemployment rate is 6 percent. Explain how
the two change in the short run if:
a) slower growth in aggregate demand causes a recession.
b) the inflation rate increases.
c) the natural unemployment rate increases.
8 True or False
1) Inflation describes the event of increasing output and rising prices.
2) A one-time increase in aggregate demand creates inflation.
3) Increases in the quantity of money can create demand-pull inflation.
4) For a persistent demand-pull inflation to occur, government expenditure must persistently
increase.
5) The early 1990s were the last period of substantial demand-pull inflation in the U.S.
6) Increases in government expenditure can create cost-push inflation.
7) Increases in the prices of raw materials can create cost-push inflation.

8) For a persistent cost-push inflation to occur, the Fed must persistently increase the quantity of
money.
9) Stagflation occurs when the SAS curve shifts leftward.
10) The Phillips curve describes the relationship between real GDP and inflation.
11) The short-run Phillips curve is vertical at the natural unemployment rate.
12) An increase in the expected inflation rate leads to a movement upward along the short-run
Phillips curve.
13) The long-run Phillips curve slopes downward.
14) The long-run Phillips curve is vertical at the natural unemployment rate.
15) The short-run Phillips curve intersects the long-run Phillips curve at the actual inflation rate.
16) The short-run Phillips curve intersects the long-run Phillips curve at the expected inflation
rate.
17) An increase in the natural unemployment rate shifts both the long-run Phillips curve and the
short-run Phillips curve rightward.
18) Monetarists believe in changes in animal spirits are the factor that leads to business cycles.
19) The monetarist theory of the business cycle views fluctuations in the growth rate of the
quantity of money as the main source of economic fluctuations.
20) The new classical cycle theory views anticipated fluctuations in aggregate demand as the
main source of business cycle economic fluctuations.
21) The new Keynesian cycle theory views only anticipated changes in aggregate demand as the
source of business cycle economic fluctuations.
120
22) The real business cycle theory views fluctuations in the quantity of money as the main source
of business cycles.
23) The real business cycle theory views fluctuations in productivity as the main source of
business cycles.
24) The intertemporal substitution effect is the factor that creates business cycles in the
Keynesian theory of the business cycle.
25) According to the real business cycle theory, a decrease in the real interest rate today
increases current labor supply.
121
9 Extended Problems
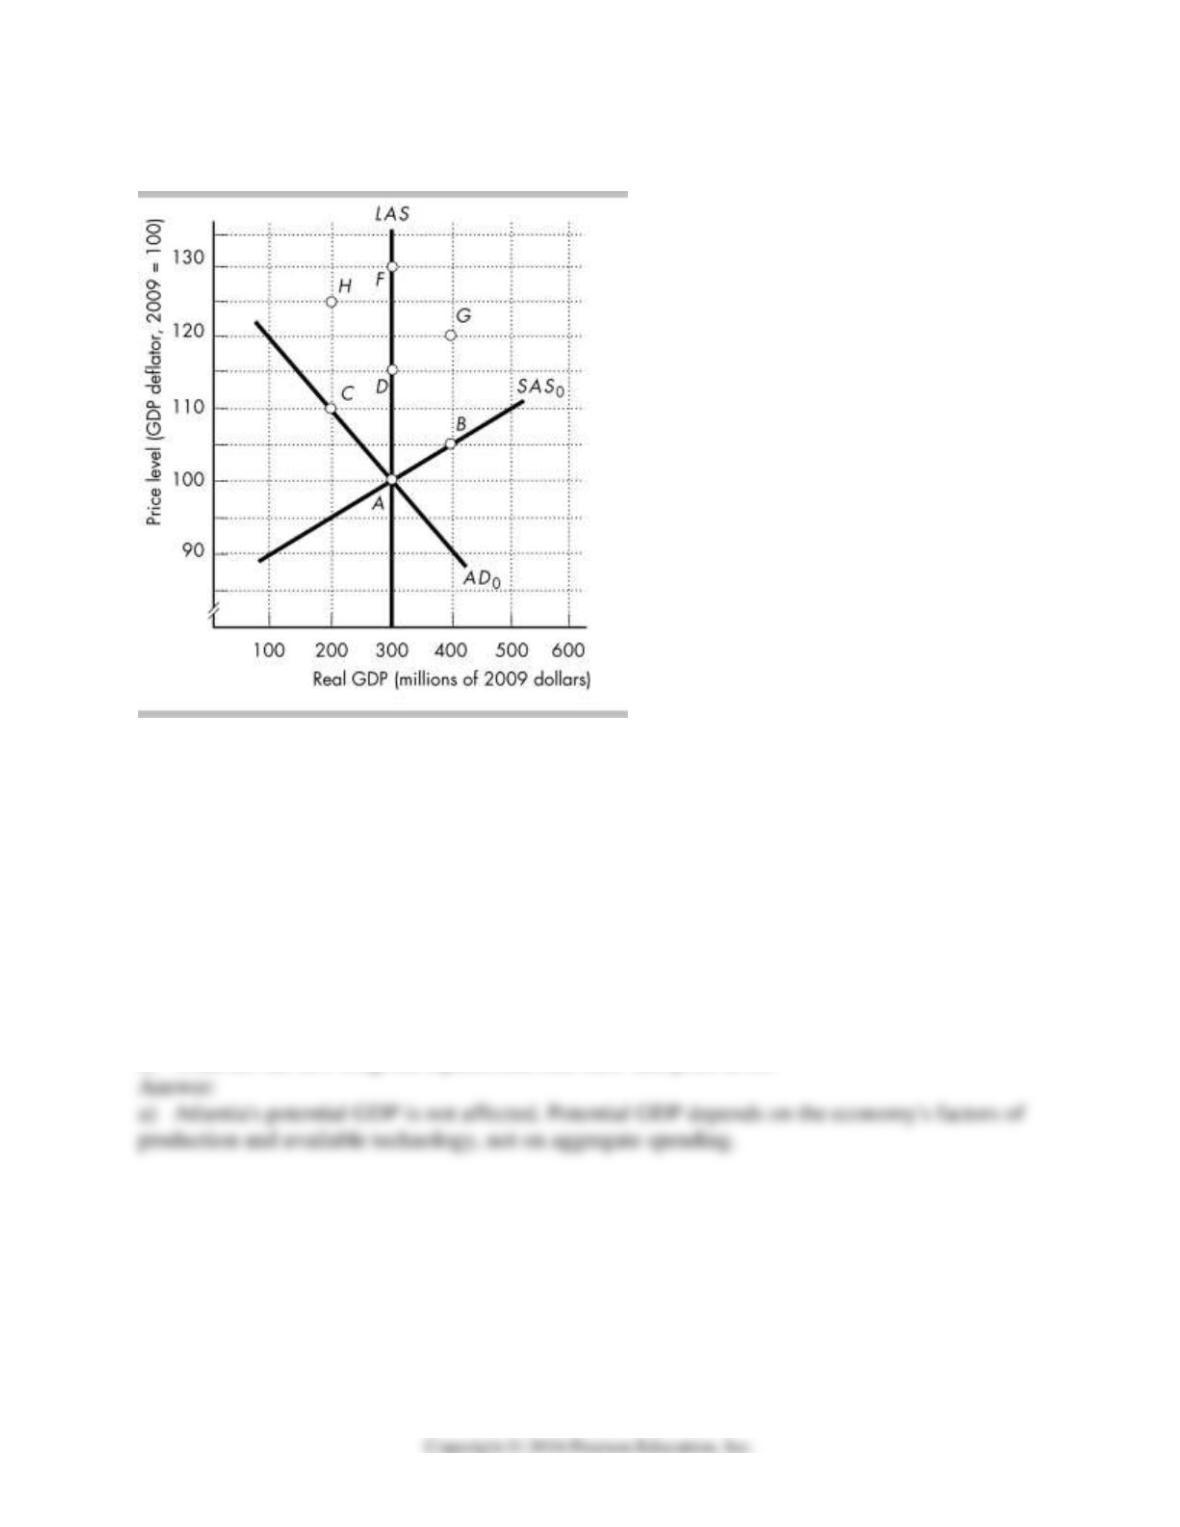
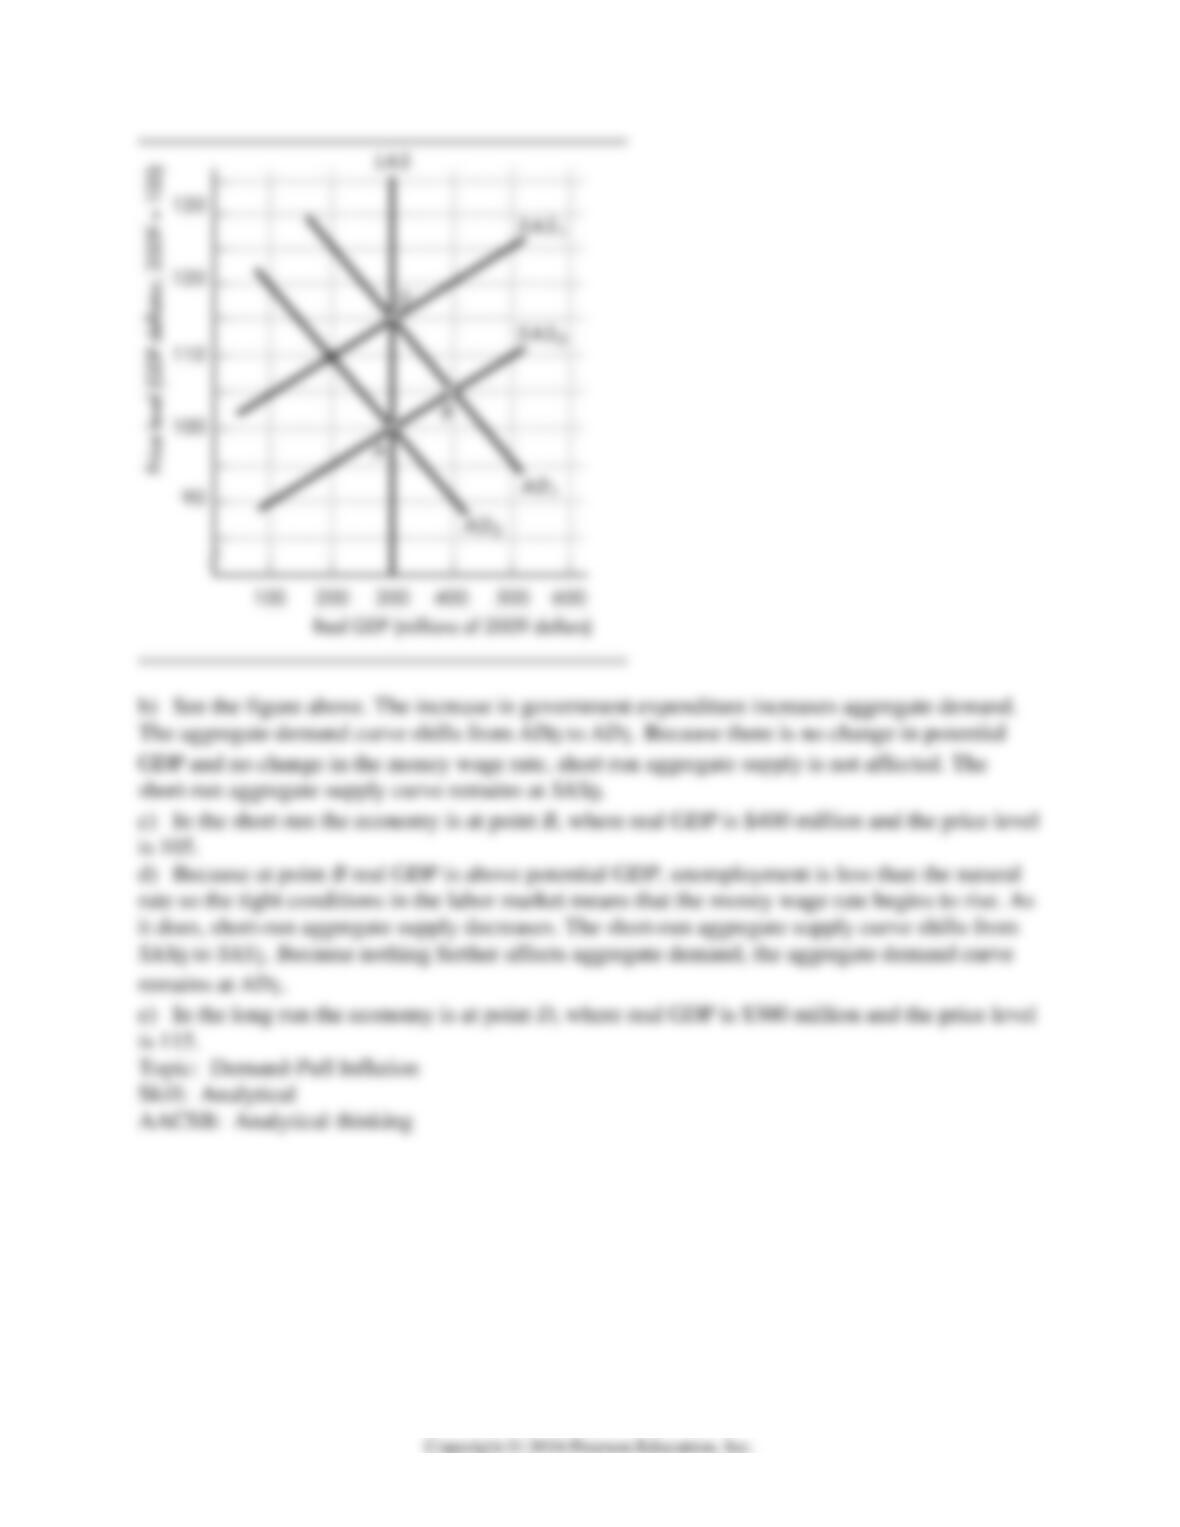
1) The figure above shows the initial aggregate demand curve, AD0, the initial short-run
aggregate supply curve, SAS0, and the long-run aggregate supply curve, LAS. The points in the
figure show possible combinations of real GDP and the price level at which the economy of
Atlantia is in macroeconomic equilibrium. The economy is initially at point A. Then, the
government increases its expenditure on goods and services. Draw the new aggregate demand
and short-run aggregate supply curves in the figure to show the effects of this event on Atlantia’s
real GDP and price level.
a) What happens to Atlantia’s potential GDP?
b) In the short run, what happens to aggregate supply and aggregate demand?
c) What are the new short-run equilibrium real GDP and price level?
d) In the long run, what happens to the short-run aggregate supply and aggregate demand?
e) What are the new long-run equilibrium real GDP and price level?
122
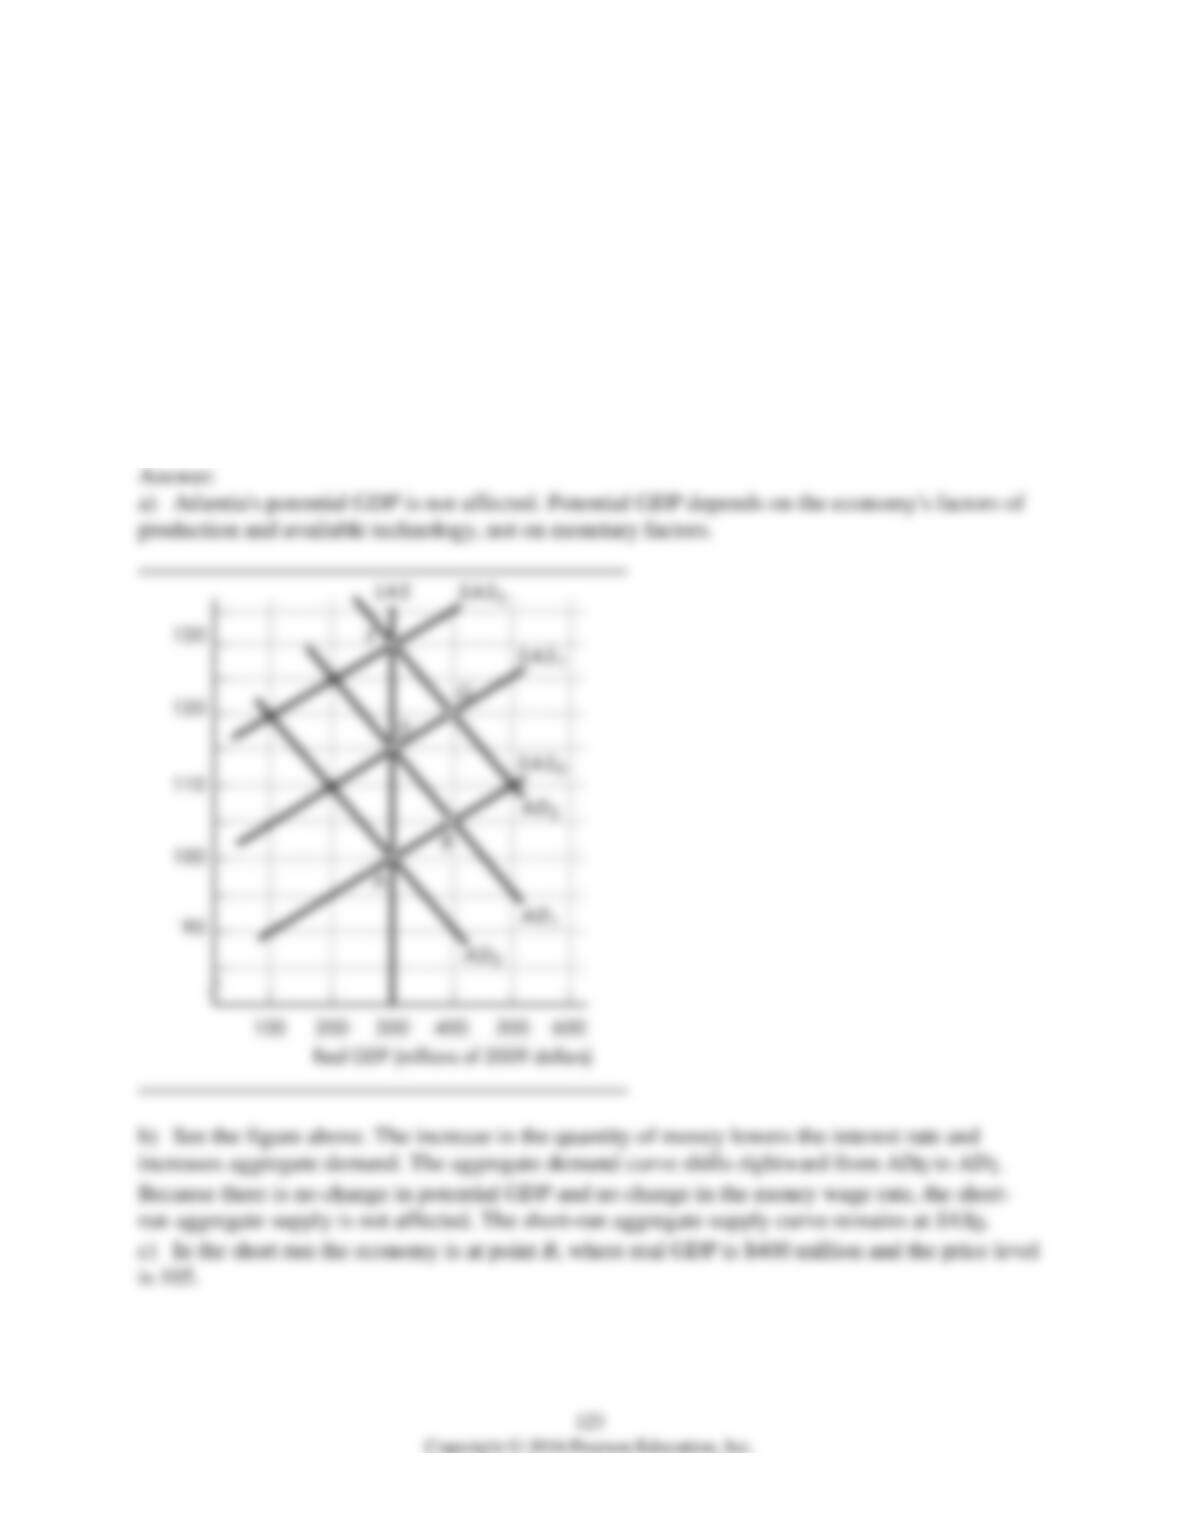
2) The figure above shows the initial aggregate demand curve, AD0, the initial short-run
aggregate supply curve, SAS0, and the long-run aggregate supply curve, LAS. The points in the
figure show possible combinations of real GDP and the price level at which the economy of
Atlantia is in macroeconomic equilibrium. The economy is initially at point A. Atlantia’s Central
Bank then increases the quantity of money year after year. Draw the necessary curves in the
figure to show the effects of this on Atlantia’s real GDP and price level.
a) What happens to Atlantia’s potential GDP?
b) In the short run, what happens to aggregate supply and aggregate demand?
c) What are the new short-run equilibrium real GDP and price level?
d) In the long run, what happens to aggregate supply and aggregate demand?
e) In the long run, what process is unfolding?
124
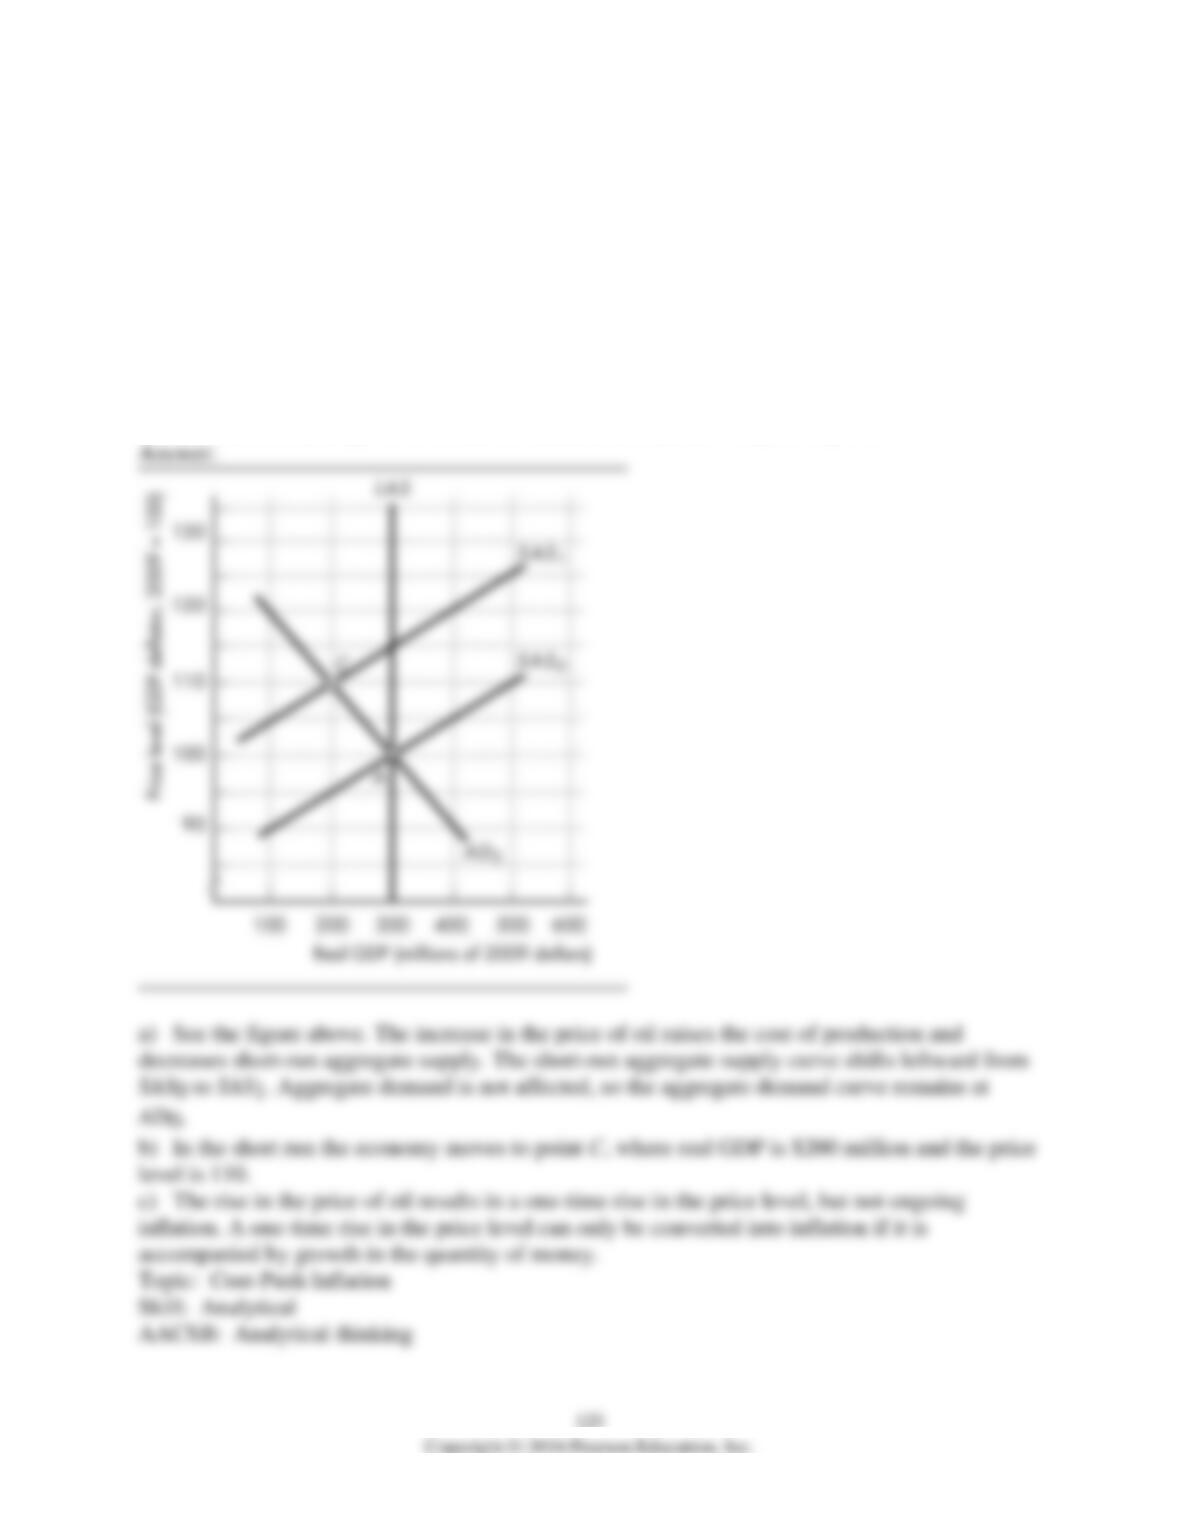
3) The figure above shows the initial aggregate demand curve, AD0, the initial short-run
aggregate supply curve, SAS0, and the long-run aggregate supply curve, LAS. The points in the
figure show possible combinations of real GDP and the price level at which the economy of
Atlantia is in macroeconomic equilibrium. The economy is initially at point A. Then, Atlantia’s
oil producers form a price-fixing organization and increase the price of oil. Suppose that
potential GDP does not change and that Atlantia’s Central Bank takes no action. Draw the new
aggregate demand and short-run aggregate supply curves in the figure to show the effects of this
event on Atlantia’s real GDP and price level.
a) What happens to aggregate supply and aggregate demand?
b) What are the new equilibrium real GDP and price level?
c) Will the rise in the price of oil lead to inflation in Atlantia? Why or why not?
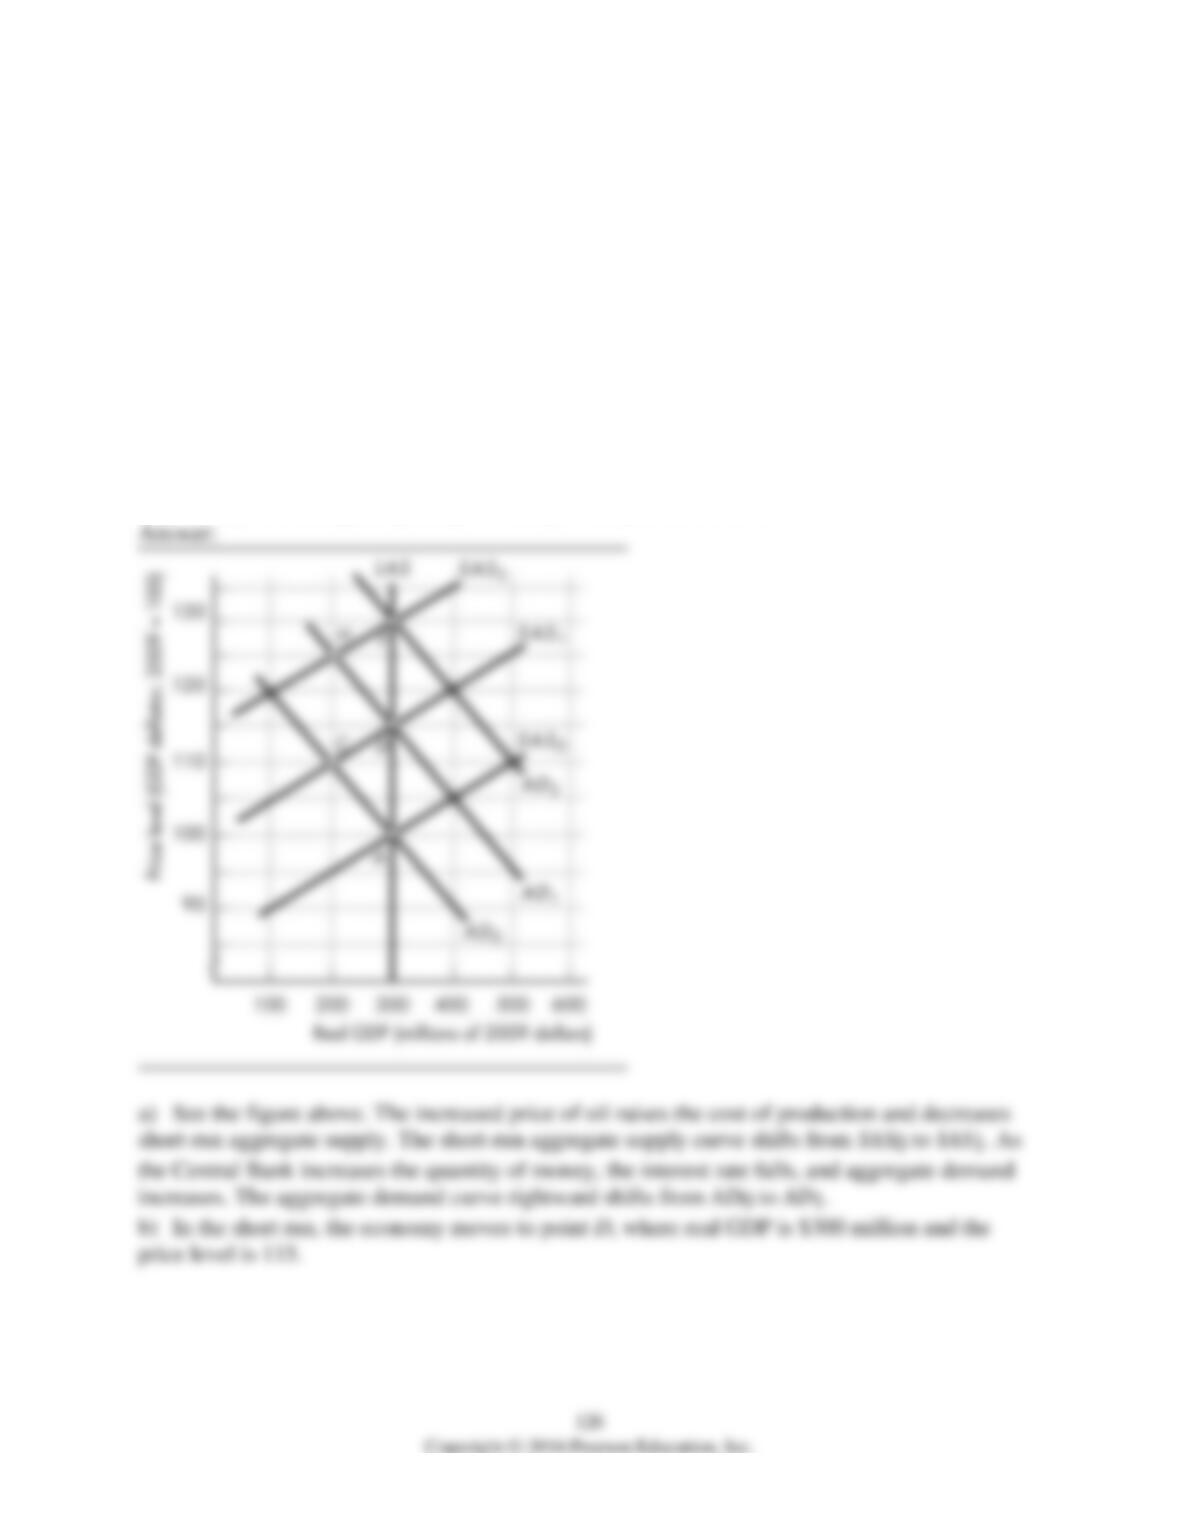
4) The figure above shows the initial aggregate demand curve, AD0, the initial short-run
aggregate supply curve, SAS0, and the long-run aggregate supply curve, LAS. The points in the
figure show possible combinations of real GDP and the price level at which the economy of
Atlantia is in macroeconomic equilibrium. The economy is initially at point A. Then, Atlantia’s
oil producers form a price-fixing organization and increase the price of oil. Suppose that
potential GDP does not change and that Atlantia’s Central Bank responds by increasing the
quantity of money. Draw necessary curves in the figure to show the effects of this on Atlantia’s
real GDP and price level.
a) In the short run, what happens to aggregate supply and aggregate demand?
b) What are the new short-run equilibrium real GDP and price level?
c) In the long run, if Atlantia’s continue to hike the price of oil and the Central Bank continues
to increase the quantity of money, what happens to aggregate supply and aggregate demand?
d) If Atlantia’s oil producers continue to hike the price of oil and Atlantia’s Central Bank
responds by increasing the quantity of money, what process unfolds?
127