141
32) During the first half of the 2000s, the price of pork rose. After that, within a couple of years
the price fell back to about the level before the initial increase. What might have led to these
events?
33) Describe how economic losses are eliminated in a perfectly competitive industry.
34) Pumpkin growing is a perfectly competitive industry. Suppose that pumpkin growers are all
incurring an economic loss. What happens as time passes? What is the long-run equilibrium
outcome?
142
35) Suppose a farmer raising beef is making a normal profit. Then, because of a scare about mad
cow disease, the demand for beef decreases drastically. What happens to the profits of the beef
farmer in the short run and in the long run?
36) How does a decrease in the demand for wheat ultimately lead to normal profits for wheat
growers in the long run?
37) Entry by competitive firms decreases the market price, while exit by competitive firms
increases the market price. Explain why firms enter or exit an industry and why these price
changes occur.
38) In the long run, a perfectly competitive firm makes zero economic profit. What incentive
does the firm have to stay in business if it is making zero economic profit?
143
39) When a perfectly competitive firm is in long-run equilibrium, what is the relationship
between the firm’s marginal cost, average total cost, marginal revenue, and price?
40) With regard to its economic profits and economic losses, how is the short run different from
the long run for a perfectly competitive firm?
9 Numeric and Graphing Questions
Quantity
(dozens of roses a
week)
Price (dollars per
dozen roses)
1
12
2
12
3
12
4
12
1) Pete is a perfectly competitive rose grower. The above table gives quantities and the price for
which Pete can sell his roses.
a) What is Pete’s total revenue if he sells 1 dozen roses? 2 dozen roses? 3 dozen roses? 4 dozen
roses?
b) What is the marginal revenue of the 2nd dozen roses sold? Of the 3rd dozen? Of the 4th
dozen?
Answer:
144
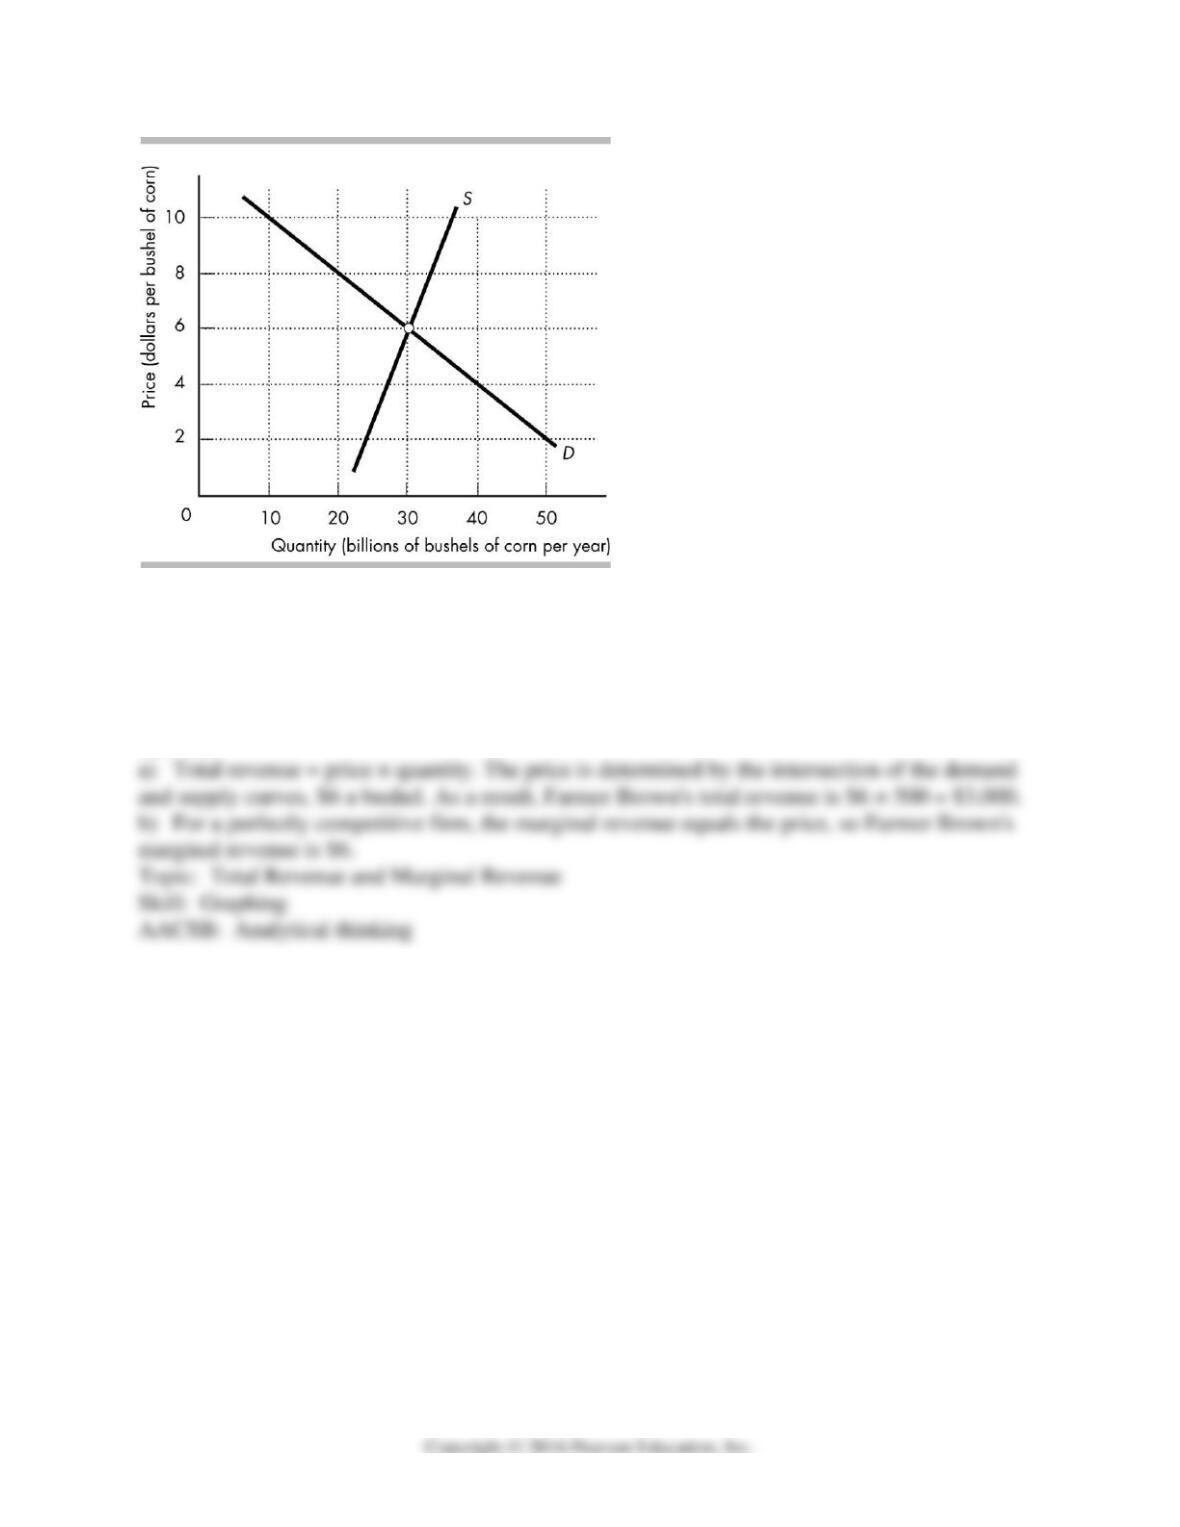
2) Farmer Brown produces corn in a perfectly competitive market. Farmer Brown produces and
sells 500 bushels of corn. The market supply and demand curves are illustrated in the above
figure.
a) What is Farmer Brown’s total revenue?
b) What is Farmer Brown’s marginal revenue?
Answer:
145
Quantity
(wreaths)
Total cost
(dollars)
Total revenue
(dollars)
Profit or loss
(dollars)
0
1
1
10
2
18
3
24
4
28
5
33
6
40
7
49
8
60
9
73
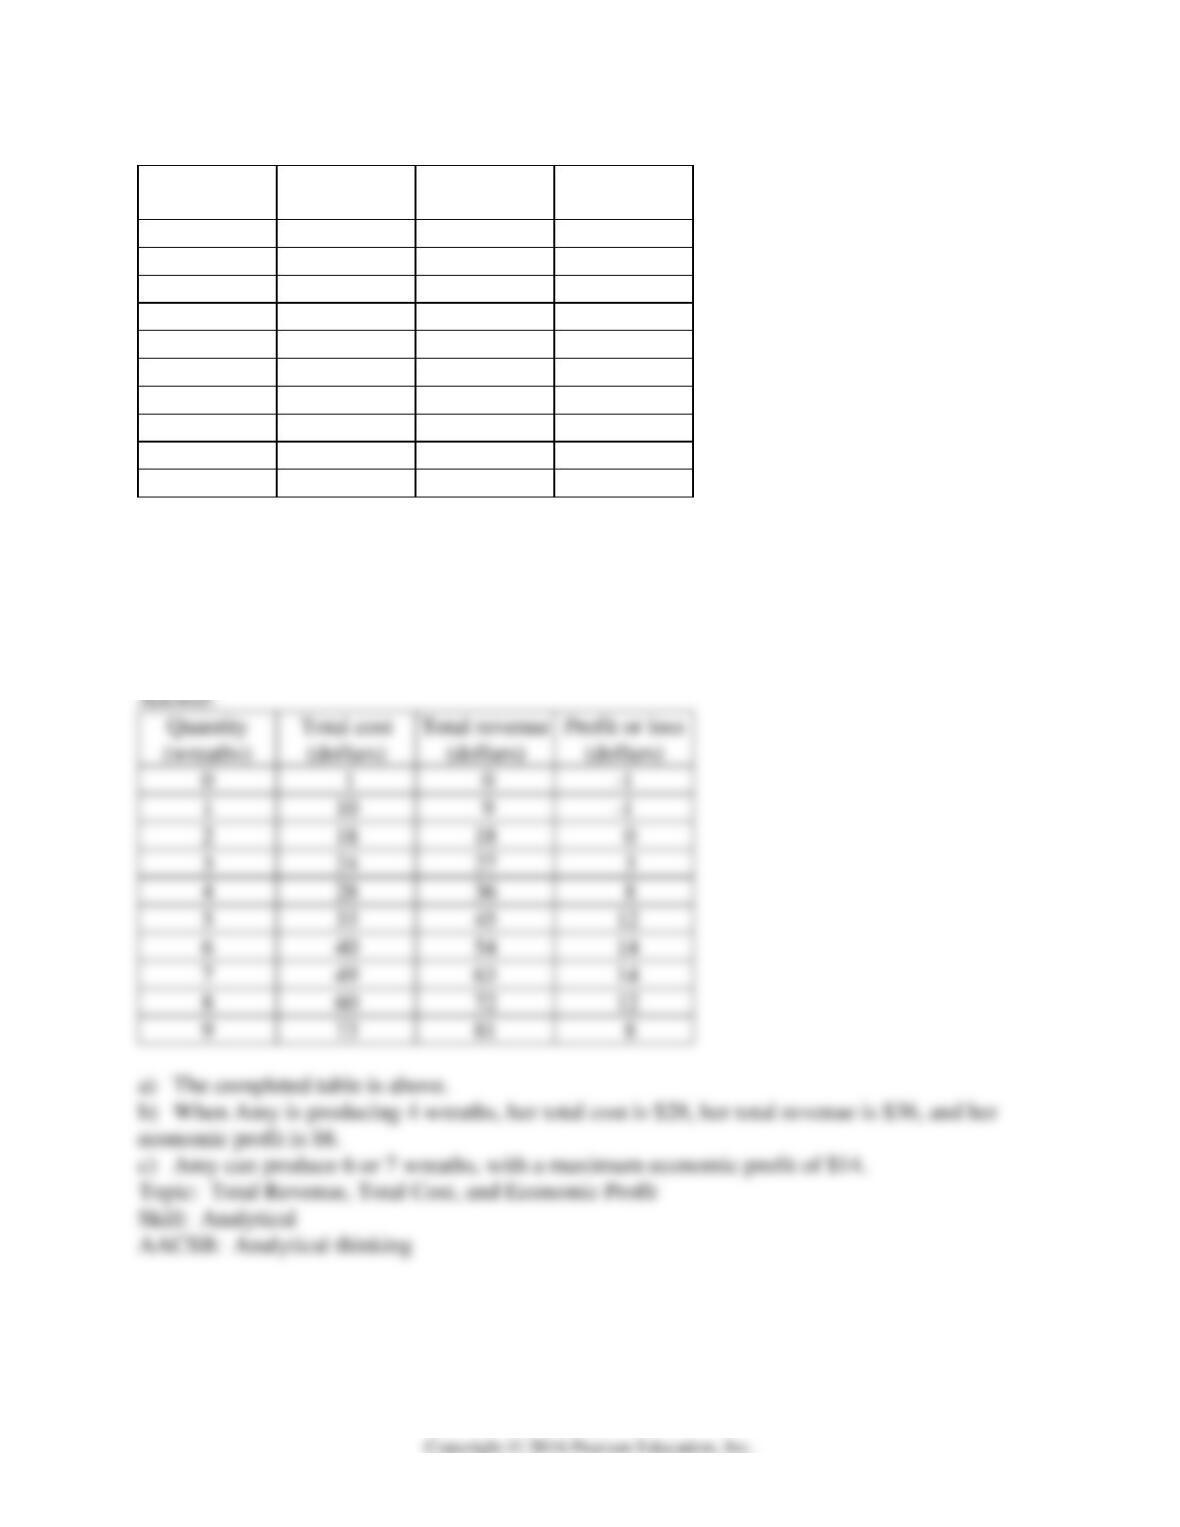
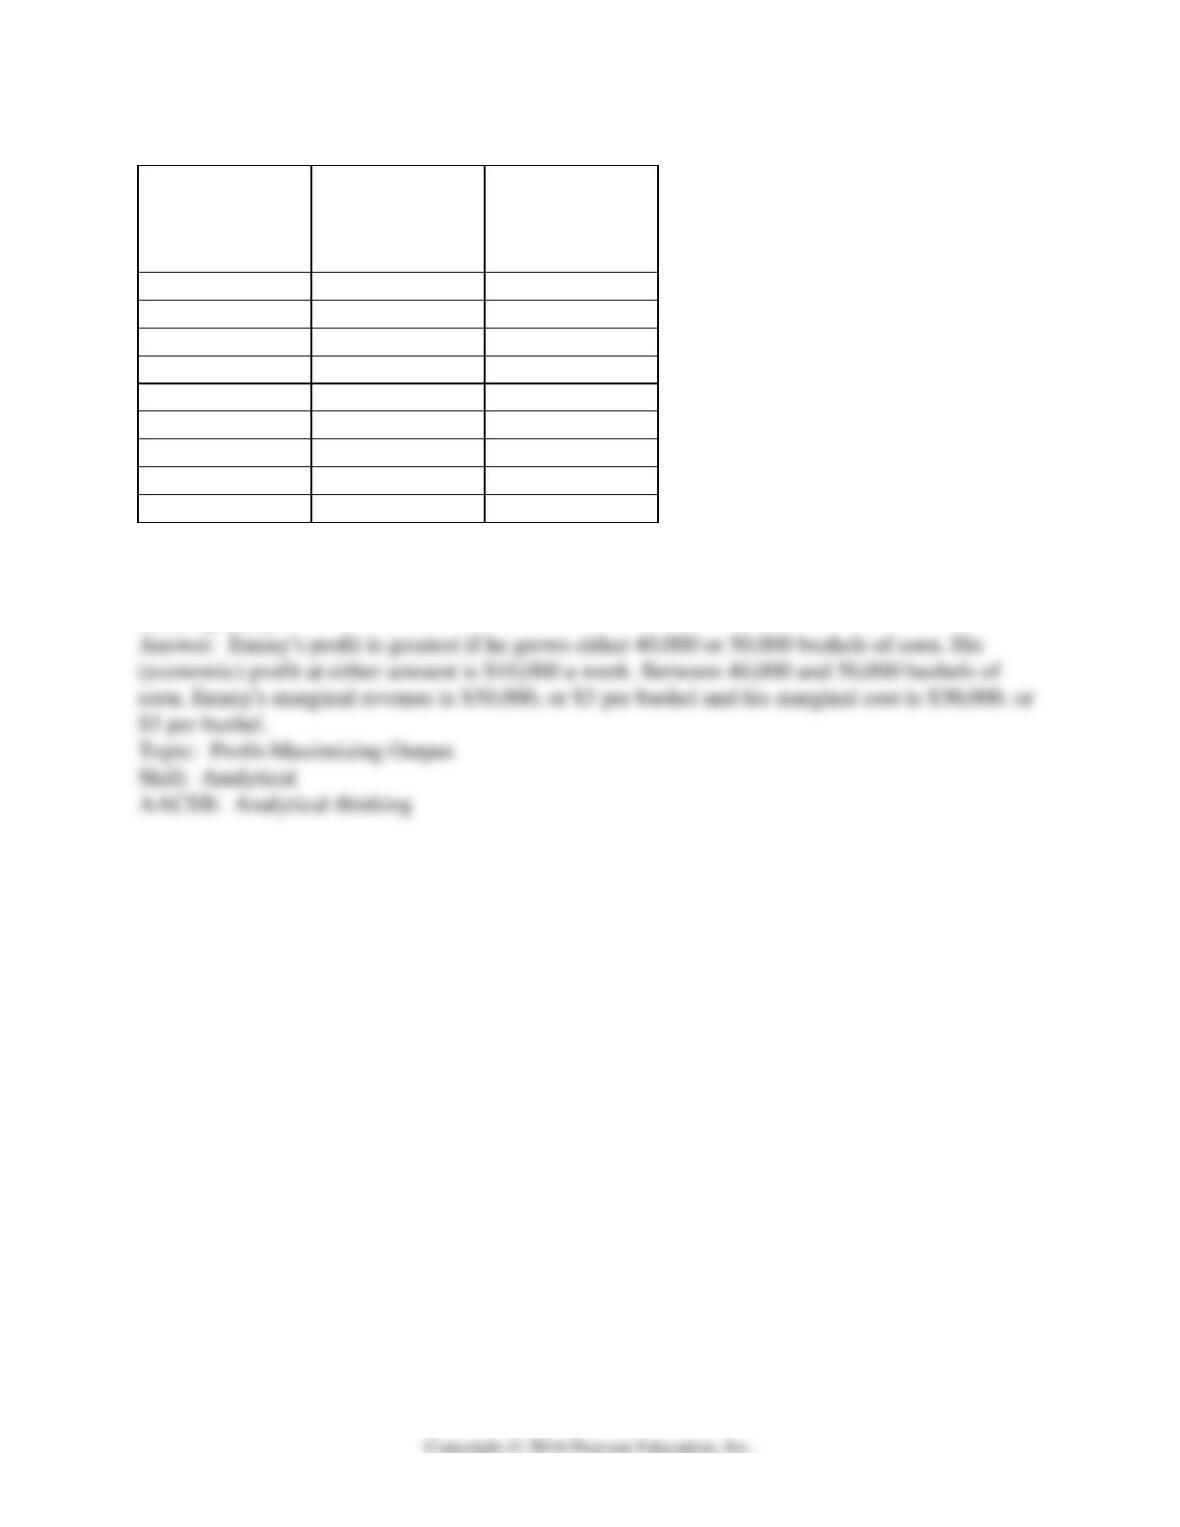
3) The above table gives Amy’s total cost schedule for producing holiday wreaths. Amy is a
perfect competitor and can sell each wreath for $9.
a) Complete the table by calculating Amy’s total revenue and her profit or loss schedule.
b) When Amy is producing 4 wreaths, what is her total cost? What is her total revenue? What is
her economic profit or economic loss?
c) What number of wreaths maximizes Amy’s profit?
Quantity
(wreaths)
Total cost
(dollars)
Total revenue
(dollars)
Profit or loss
(dollars)
0
1
10
2
18
18
0
3
24
27
3
4
28
36
8
5
33
45
6
40
54
7
49
63
8
60
72
9
73
81
8
146
Quantity
(thousands of
bushels of corn a
week)
Total revenue
(thousands of
dollars per week)
Total cost
(thousands of
dollars per week)
0
0
50
10
30
70
20
60
80
30
90
90
40
120
110
50
150
140
60
180
200
70
210
280
80
240
400
4) Jimmy grows corn. His total revenue and total cost are in the above table. What quantity of
corn maximizes his profit and what is his profit? What is the marginal revenue and marginal cost
at this quantity?
147
Quantity
(units)
Total cost
(dollars)
0
3
1
6
2
12
3
21
4
33
5
49
5) The above table gives the quantity of output and the total cost for a perfectly competitive firm
that can sell all of its output at $9 per unit.
a) Find the profit maximizing level of output for this firm.
b) How much economic profit is the firm making?
Answer:
Quantity
(units)
Total cost
(dollars)
Total revenue
(dollars)
Profit or loss
(dollars)
0
3
0
-3
1
6
9
3
2
12
18
6
3
21
27
6
4
33
36
3
5
49
45
-4
a) Total revenue equals price times quantity sold. We can find the total revenue for this firm
because the market price is a constant $9. The total revenue schedule is given in the table above.
The total profit (or loss) equals total revenue minus total cost. The last column shows that the
total profit is largest if either 2 or 3 units are produced.
b) When the firm produces either 2 or 3 units of output, the total economic profit is $6.
Topic: Profit-Maximizing Output
Skill: Analytical
AACSB: Analytical thinking
148
Quantity
(units)
Total cost
(dollars)
Total revenue
(dollars)
Profit or loss
(dollars)
0
400
___
___
1
550
___
___
2
600
___
___
3
650
___
___
4
740
___
___
5
850
___
___
6
990
___
___
7
1,140
___
___
8
1,400
___
___
9
1,690
___
___
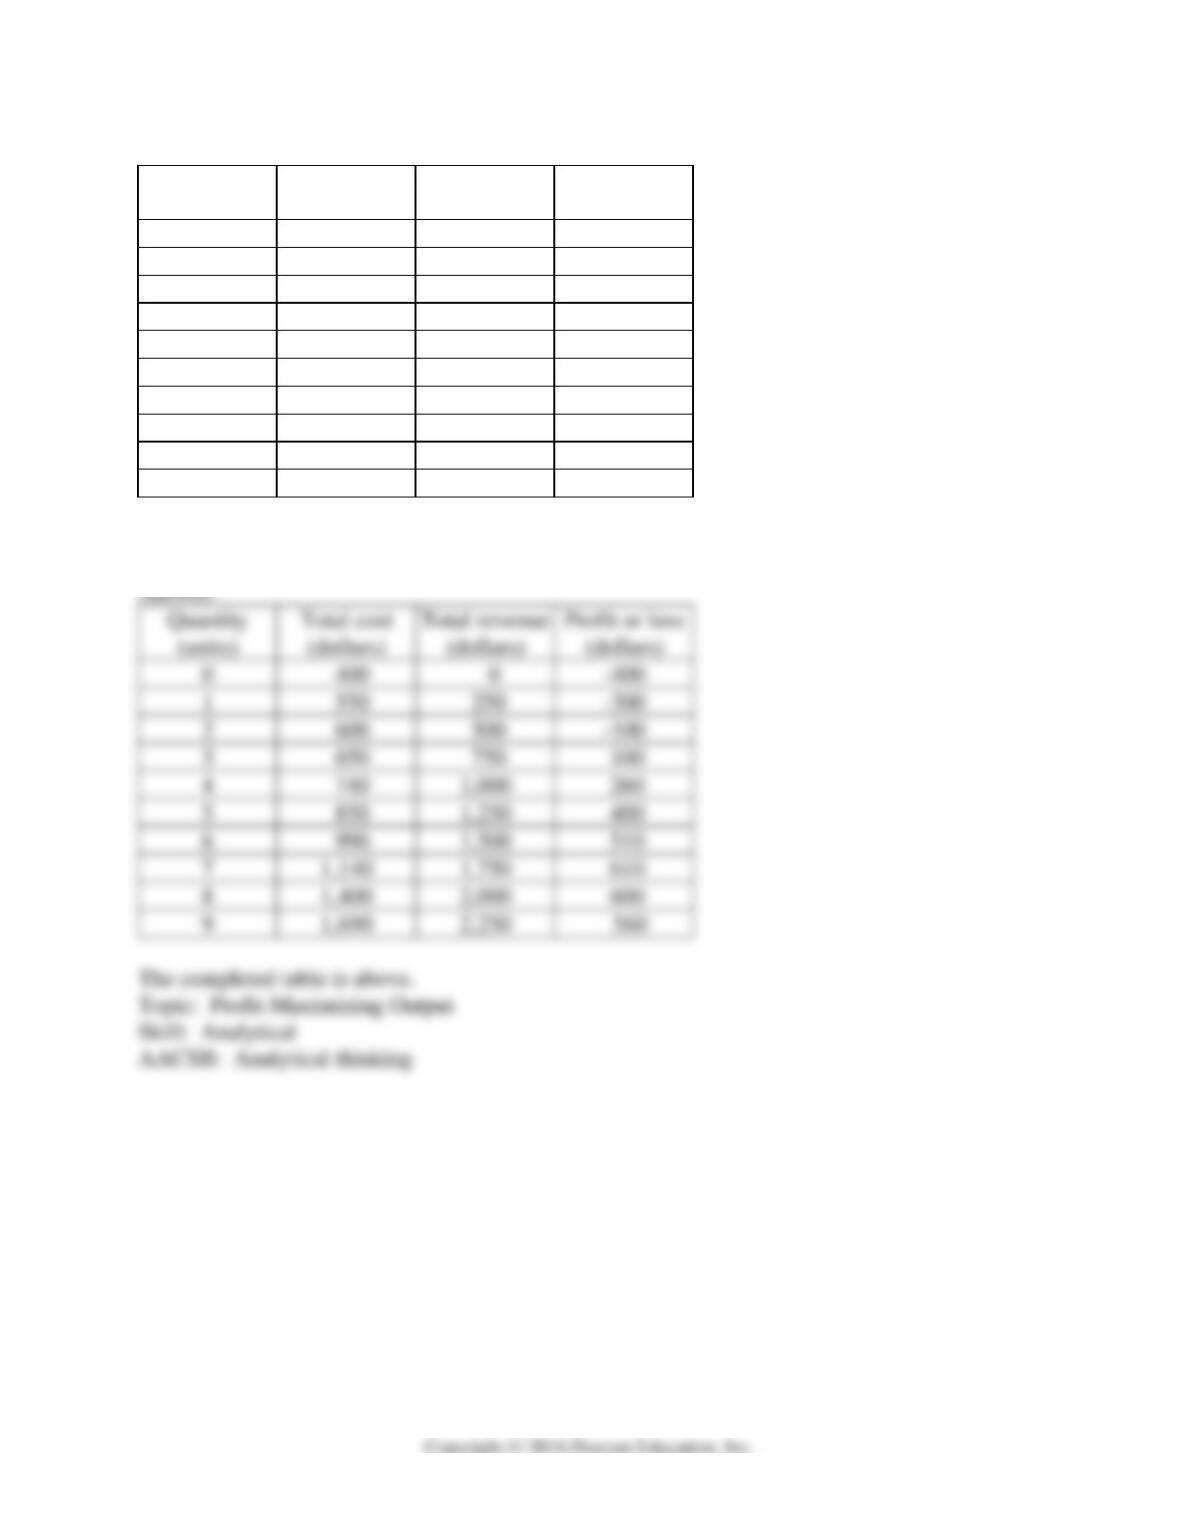
6) The above table shows the total cost schedule for a perfectly competitive firm. The market
price is $250 per unit. Complete the table.
Quantity
(units)
Total cost
(dollars)
Total revenue
(dollars)
Profit or loss
(dollars)
0
1
2
3
4
1,000
5
1,250
6
1,500
7
1,140
1,750
8
1,400
2,000
9
1,690
2,250
Quantity
(units)
Total cost
(dollars)
0
12.00
1
20.00
2
26.00
3
30.00
4
32.00
5
36.00
6
42.00
7
49.80
8
64.00
9
87.60
10
124.00
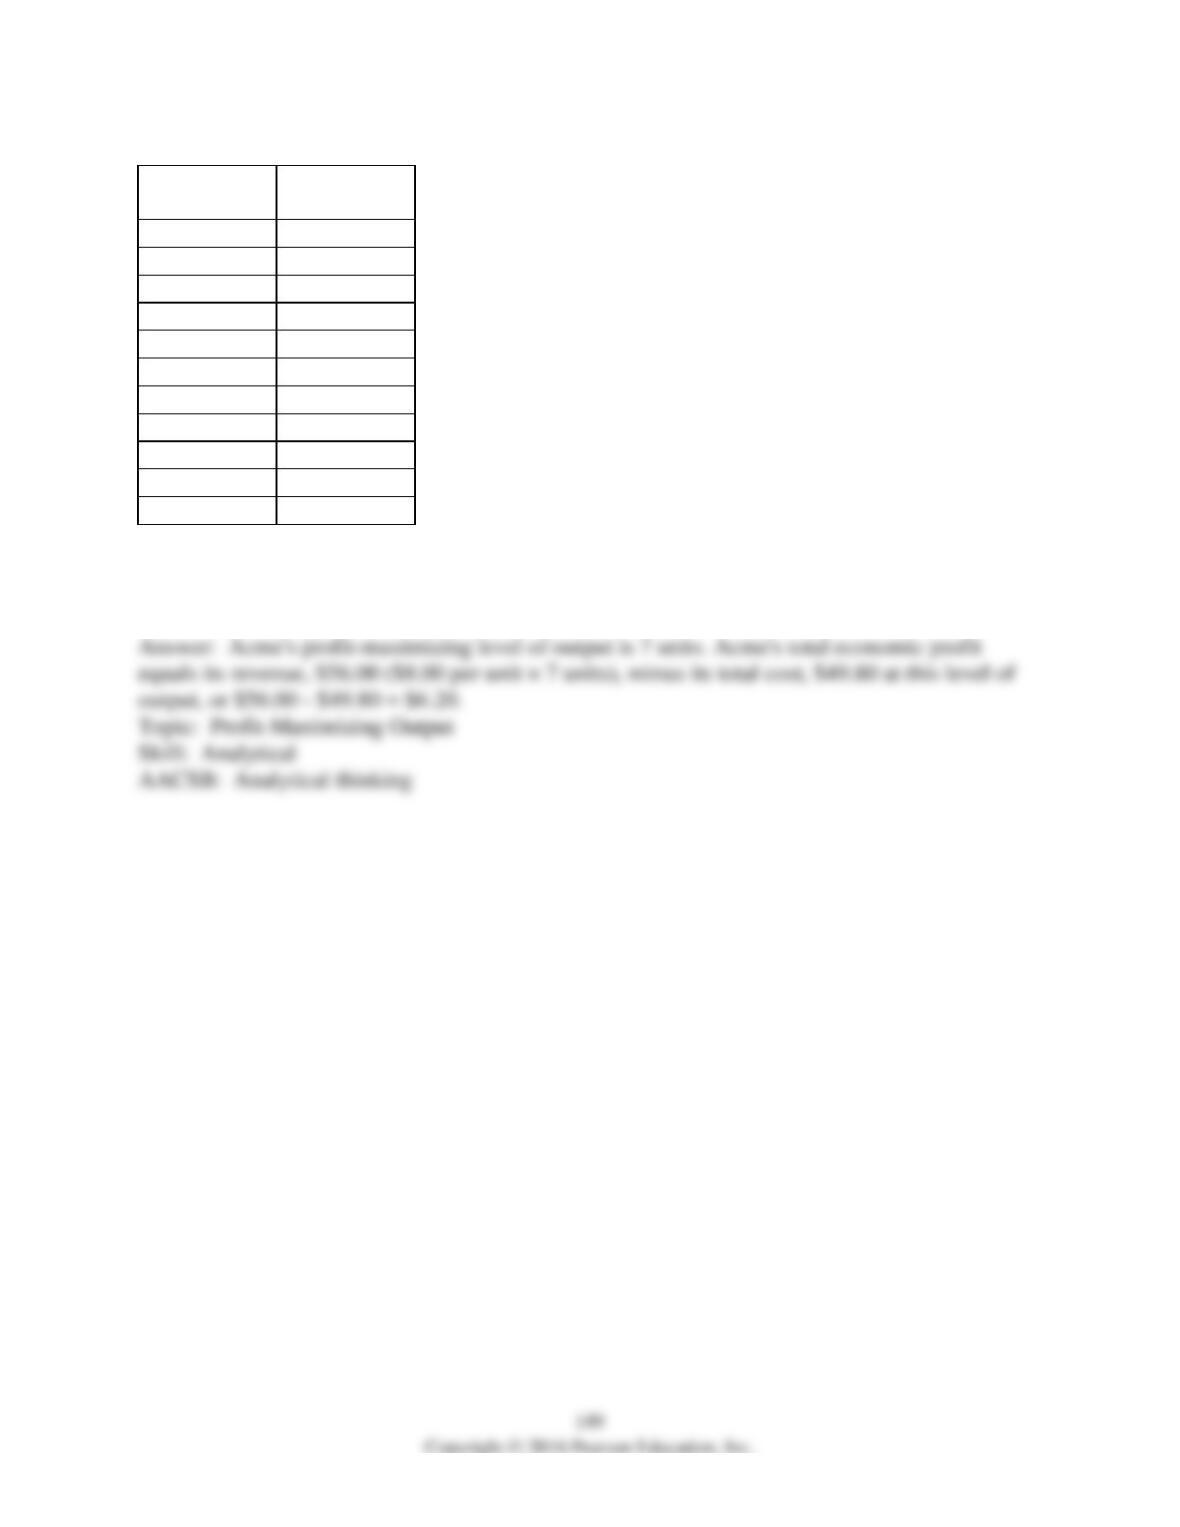
7) Acme is a perfectly competitive firm. It has the total cost schedule given in the above table.
Acme’s product sells for $8.00 per unit. What amount of output is the most profitable and what is
Acme’s economic profit or economic loss?
150
Quantity
(cones per
day)
Total cost
(dollars per day)
0
100
100
250
200
350
300
500
400
700
500
950
600
1,2500
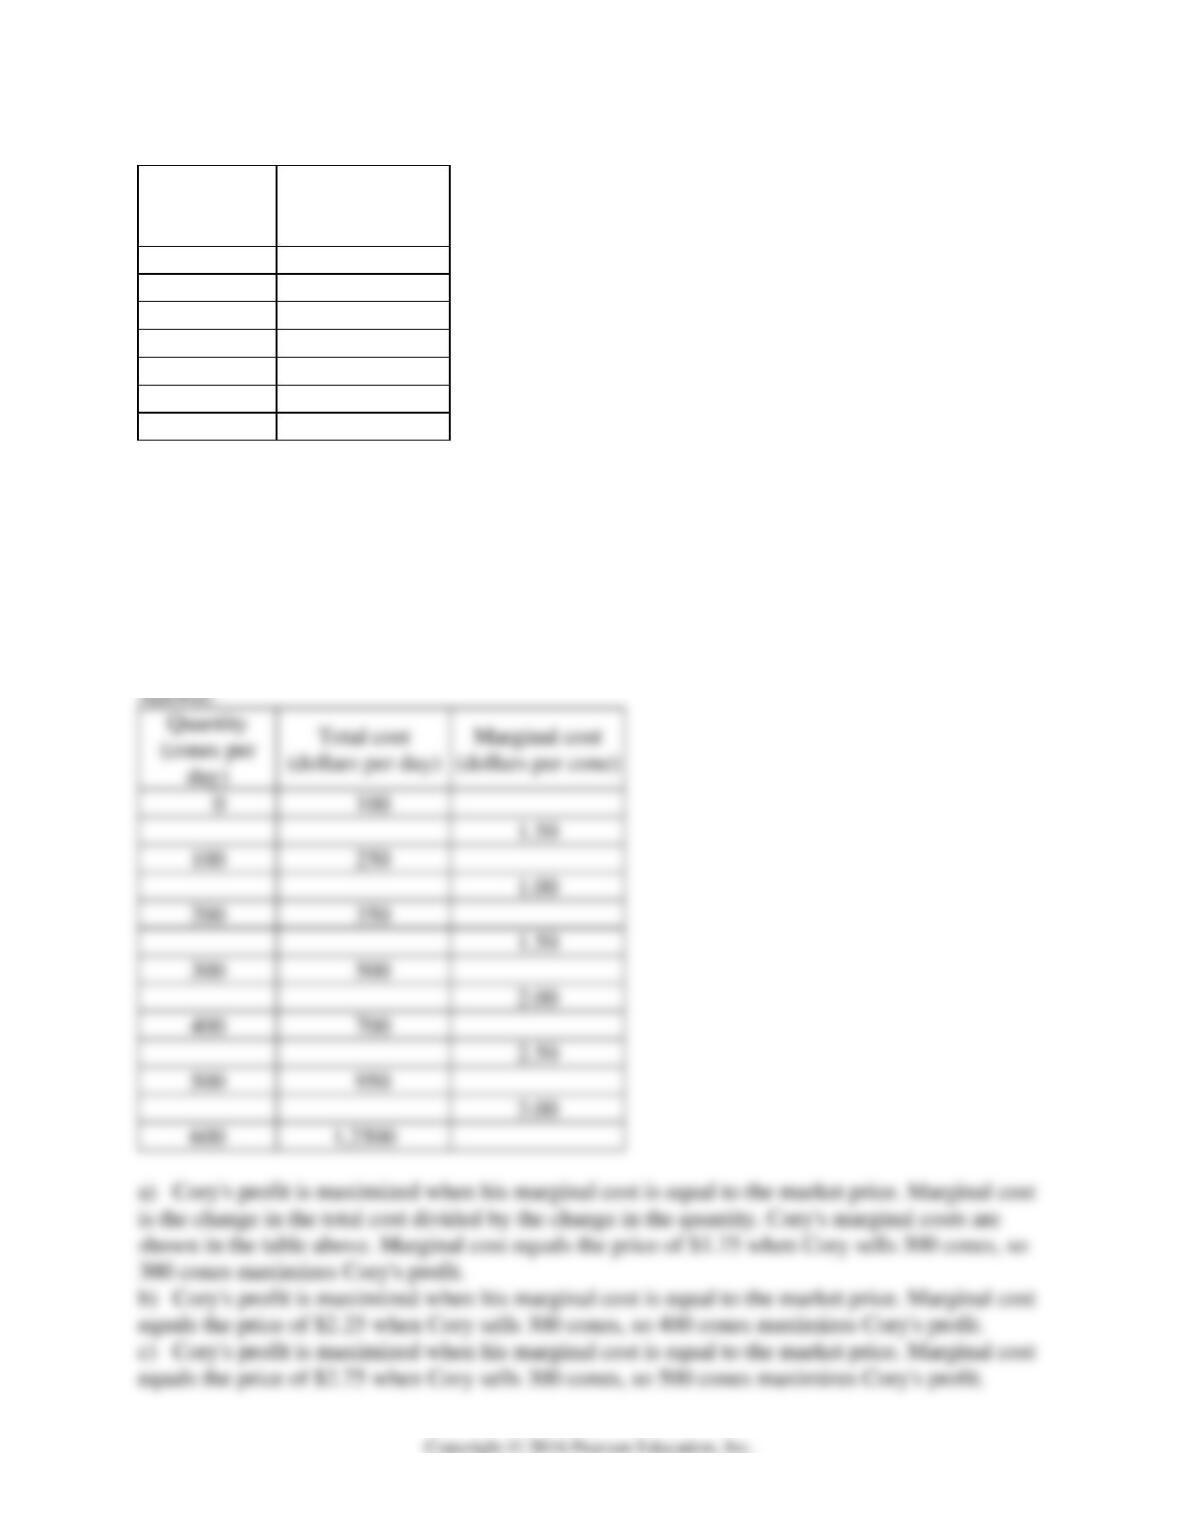
8) Cory’s is one of many ice cream stands in town. Cory’s costs are shown in the table above.
a) If the market price of ice cream is $1.75 per cone, what is Cory’s profit-maximizing quantity
of cones?
b) If the market price of ice cream is $2.25 per cone, what is Cory’s profit-maximizing quantity
of coins?
c) If the market price of ice cream is $2.75 per cone, what is Cory’s profit-maximizing quantity
of coins?
d) Can you determine any points on Cory’s supply curve?
Quantity
(cones per
day)
Total cost
(dollars per day)
0
100
200
300
400
500
600
1,2500
151
d) One point on Cory’s supply curve is a price of $1.75, quantity of 300 cones; another point is a
price of $2.25, quantity of 400 cones; and a third point is price of $2.75, quantity of 500 cones.
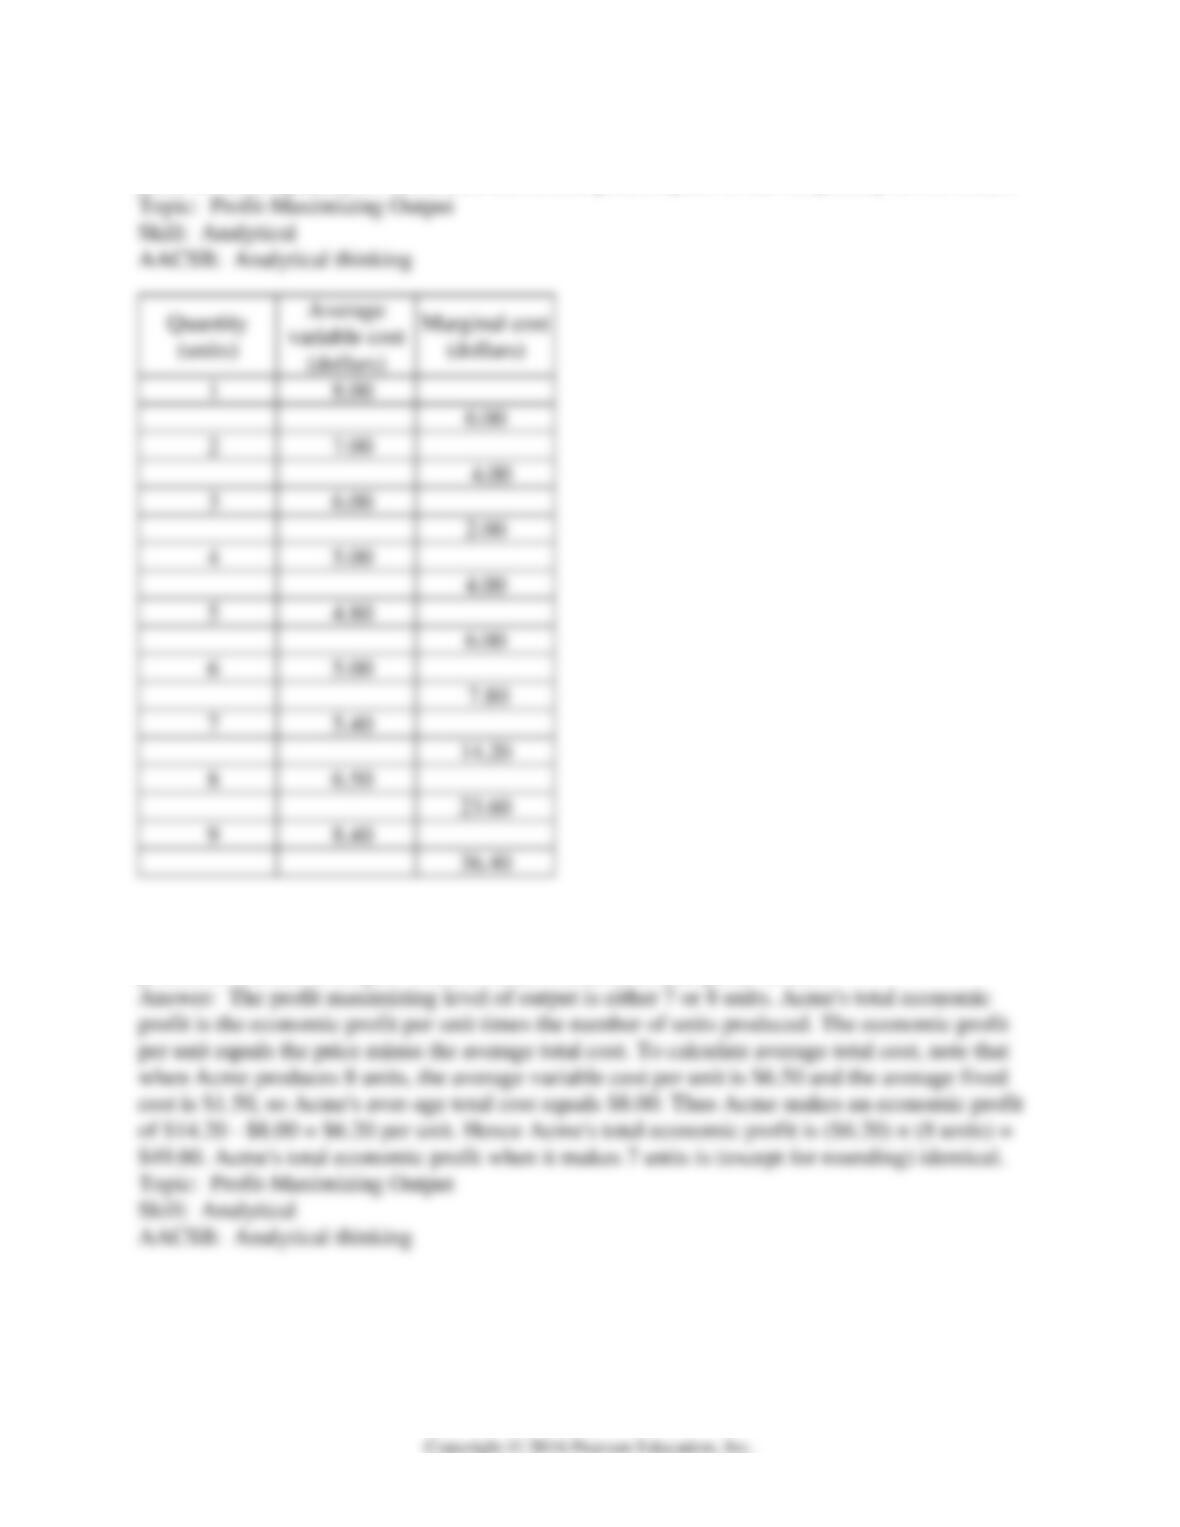
9) Acme is a perfectly competitive firm. It has the cost schedules given in the above table and
has a fixed cost of $12.00. The price of Acme’s product is $14.20. What is Acme’s most
profitable amount of output? What is Acme’s total economic profit or loss?
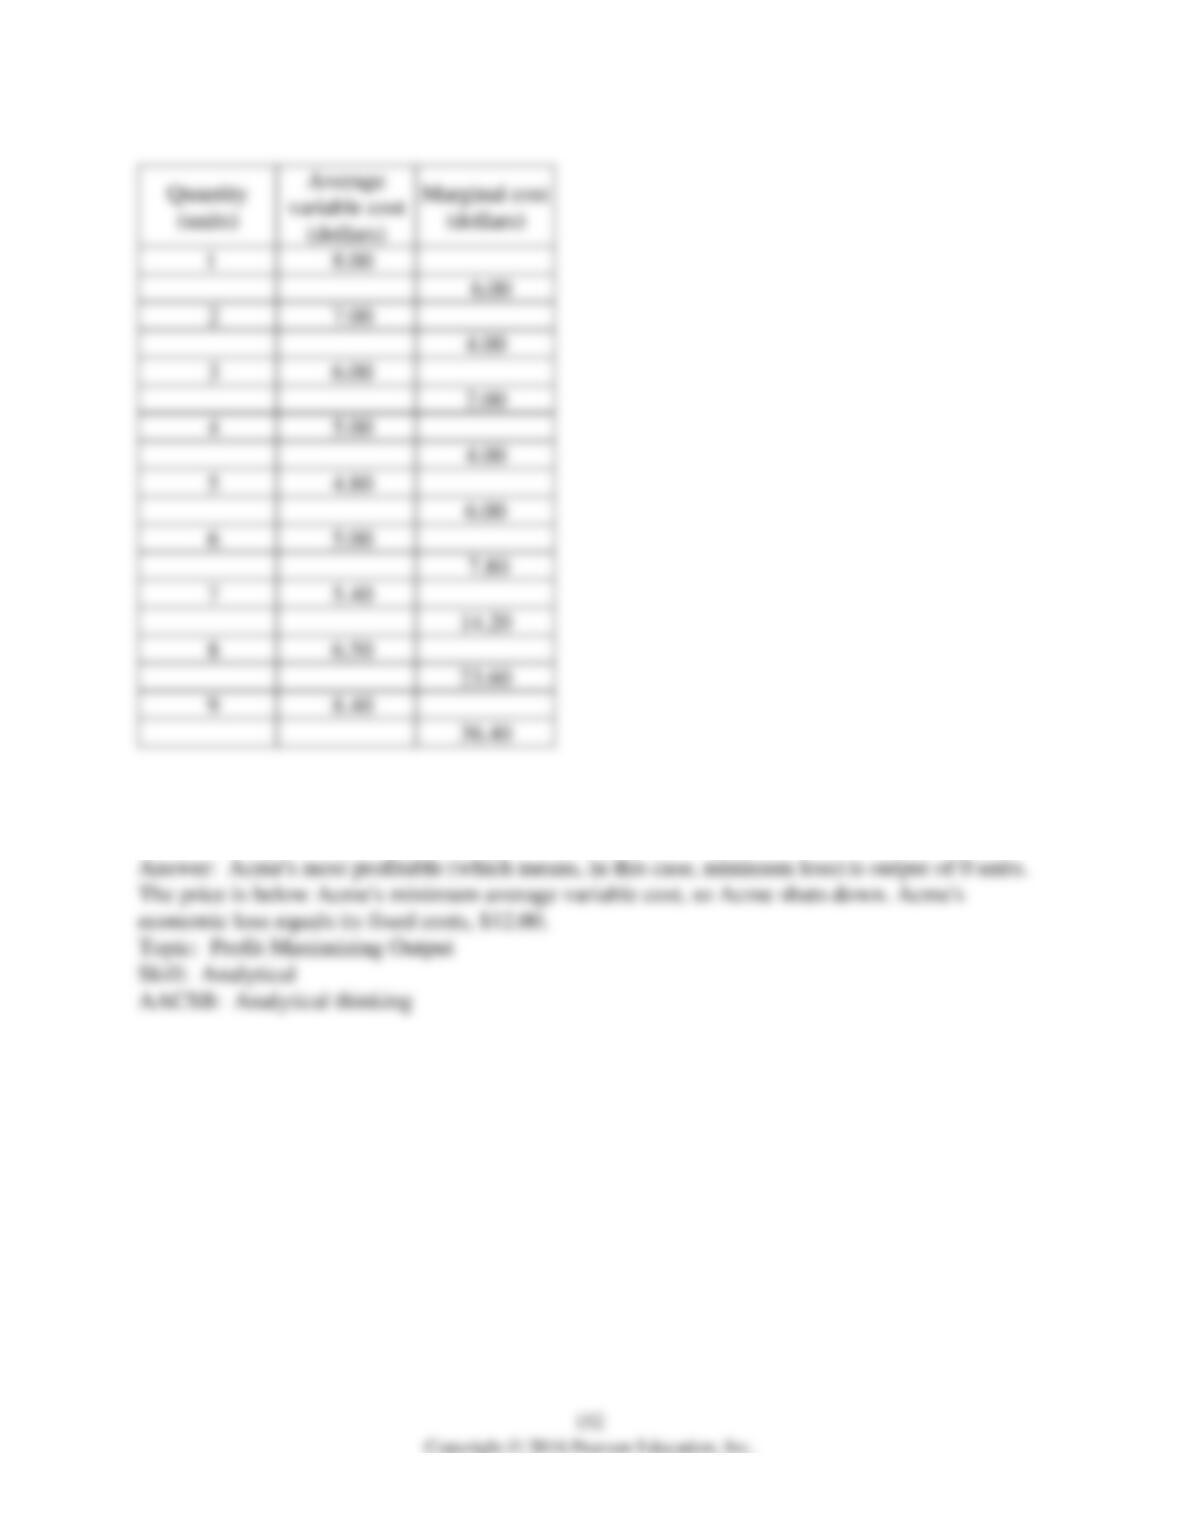
10) Acme is a perfectly competitive firm. It has the cost schedules given in the above table and
has a fixed cost of $12.00. The price of Acme’s product is $4.00. What is Acme’s most profitable
amount of output? What is Acme’s total economic profit or loss?
153
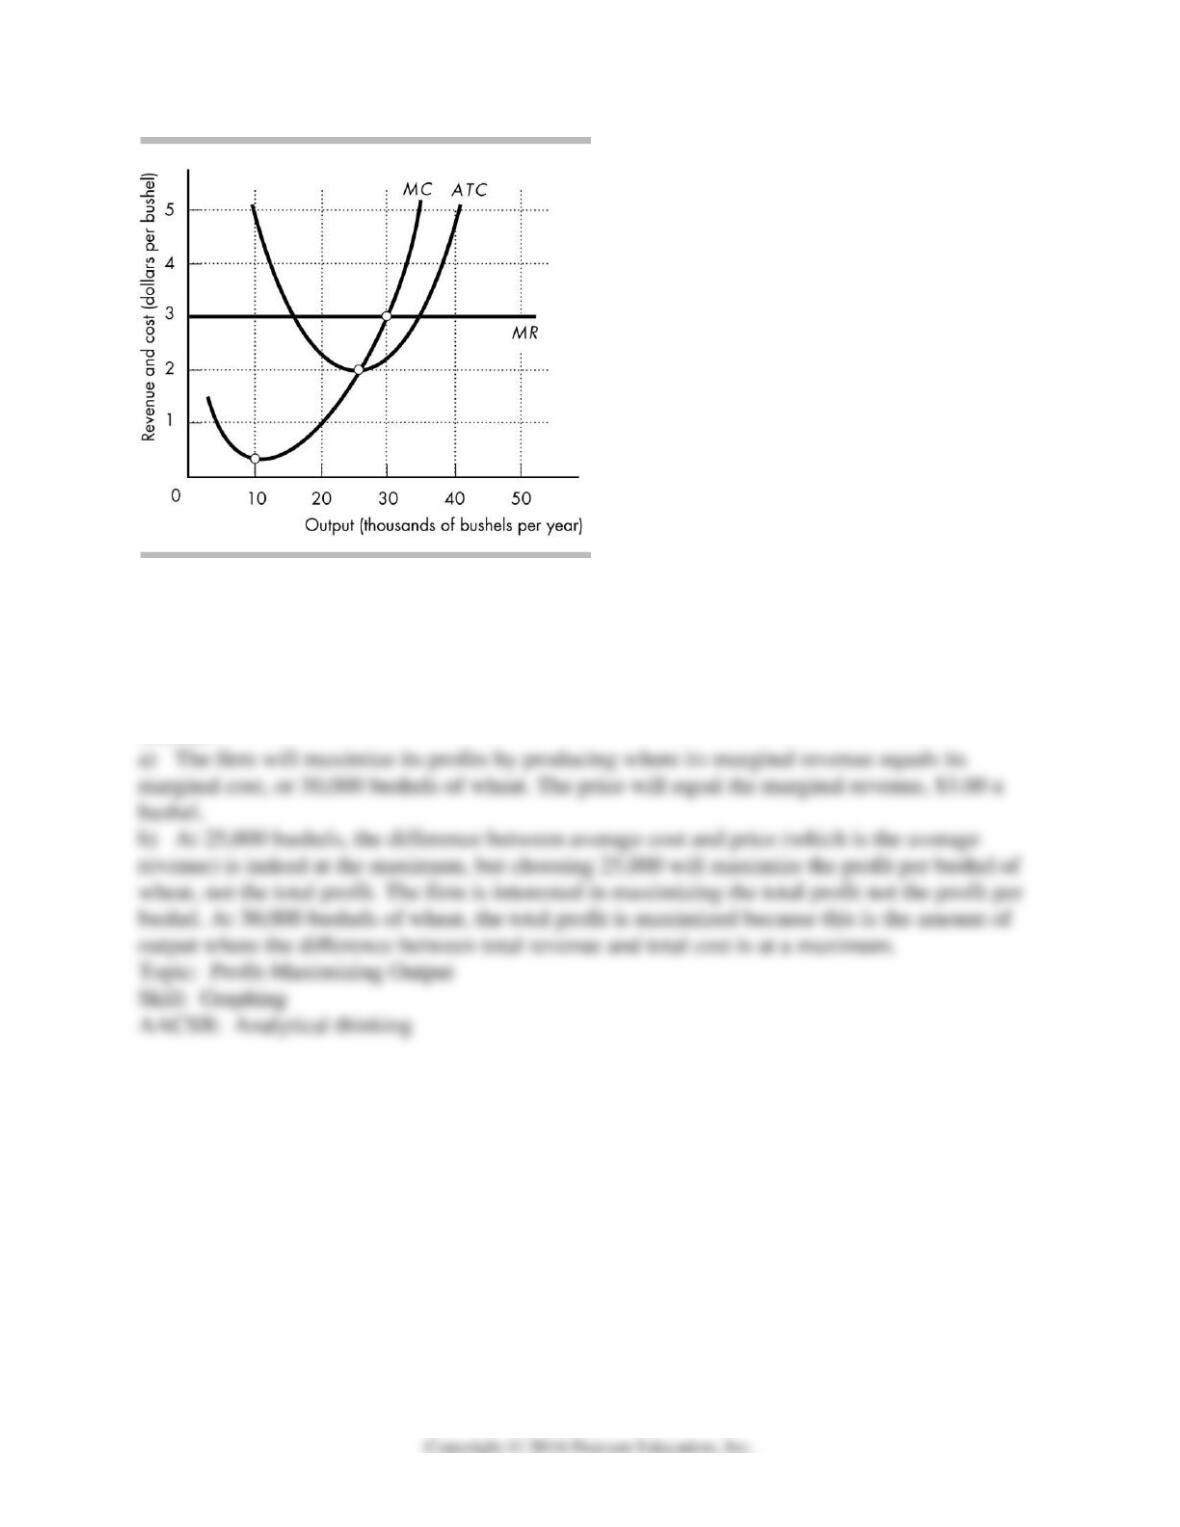
11) The above figure illustrates a perfectly competitive wheat farmer.
a) What will be the firm’s profit-maximizing price and output?
b) When the farmer produces 25,000 bushels of wheat, the difference between the firm’s
average total cost and the price is at its maximum. Explain why this amount of wheat either is or
is not the profit-maximizing quantity.
Answer:
154
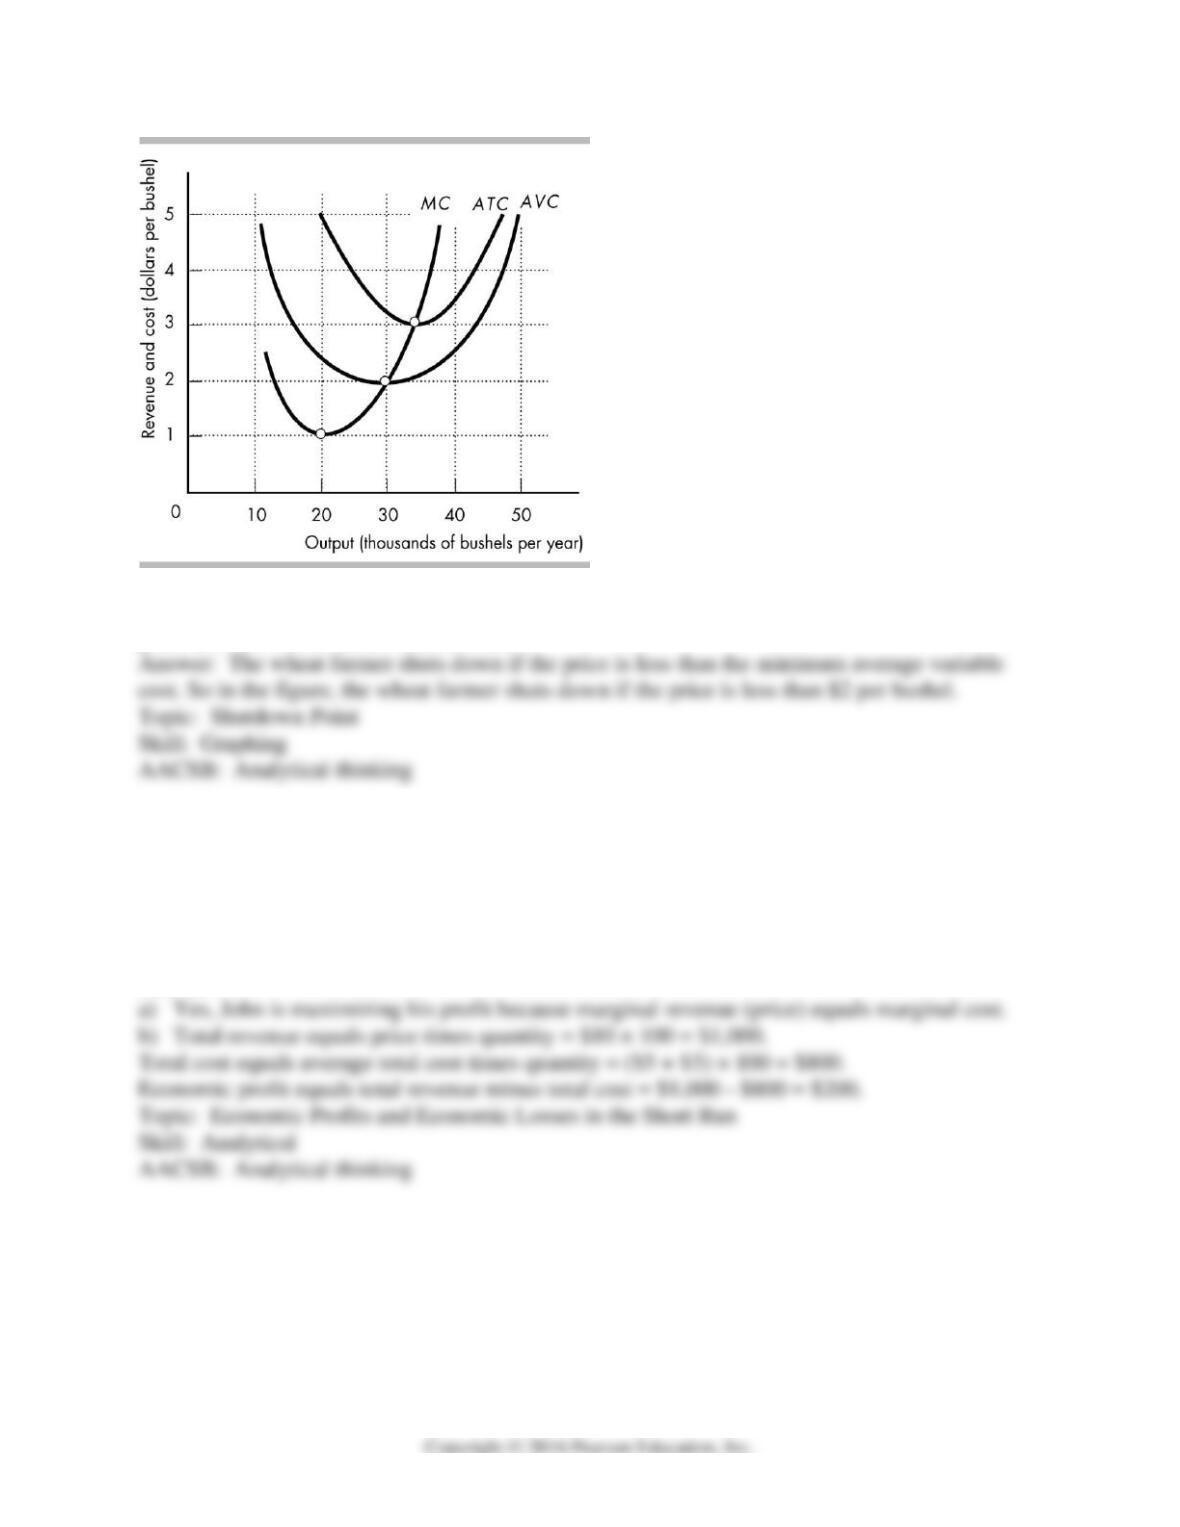
12) The above diagram shows the cost curves for a perfectly competitive wheat farmer. At what
price does the wheat farmer shut down?
13) John keeps beehives and sells 100 quarts of honey per month. The honey market is perfectly
competitive, and the price of a quart of honey is $10. John has an average variable cost of $5 and
an average fixed cost of $3. At 100 quarts per month, John’s marginal cost is $10.
a) Is John maximizing his profit? If not, what should John do?
b) Calculate John’s total revenue, total cost, and total economic profit or economic loss when he
produces 100 quarts of honey.
Answer: