Chapter 12 – The Demand for Resources
20 _____
10 _____
1 _____
Chapter 12 – The Demand for Resources
12–15
14. Complete the following table, where L is the units of labor, TPL is the total product of labor, MPL is the
marginal product of labor, P is product price, TR is total revenue, and MRPL is the marginal revenue
product of labor.
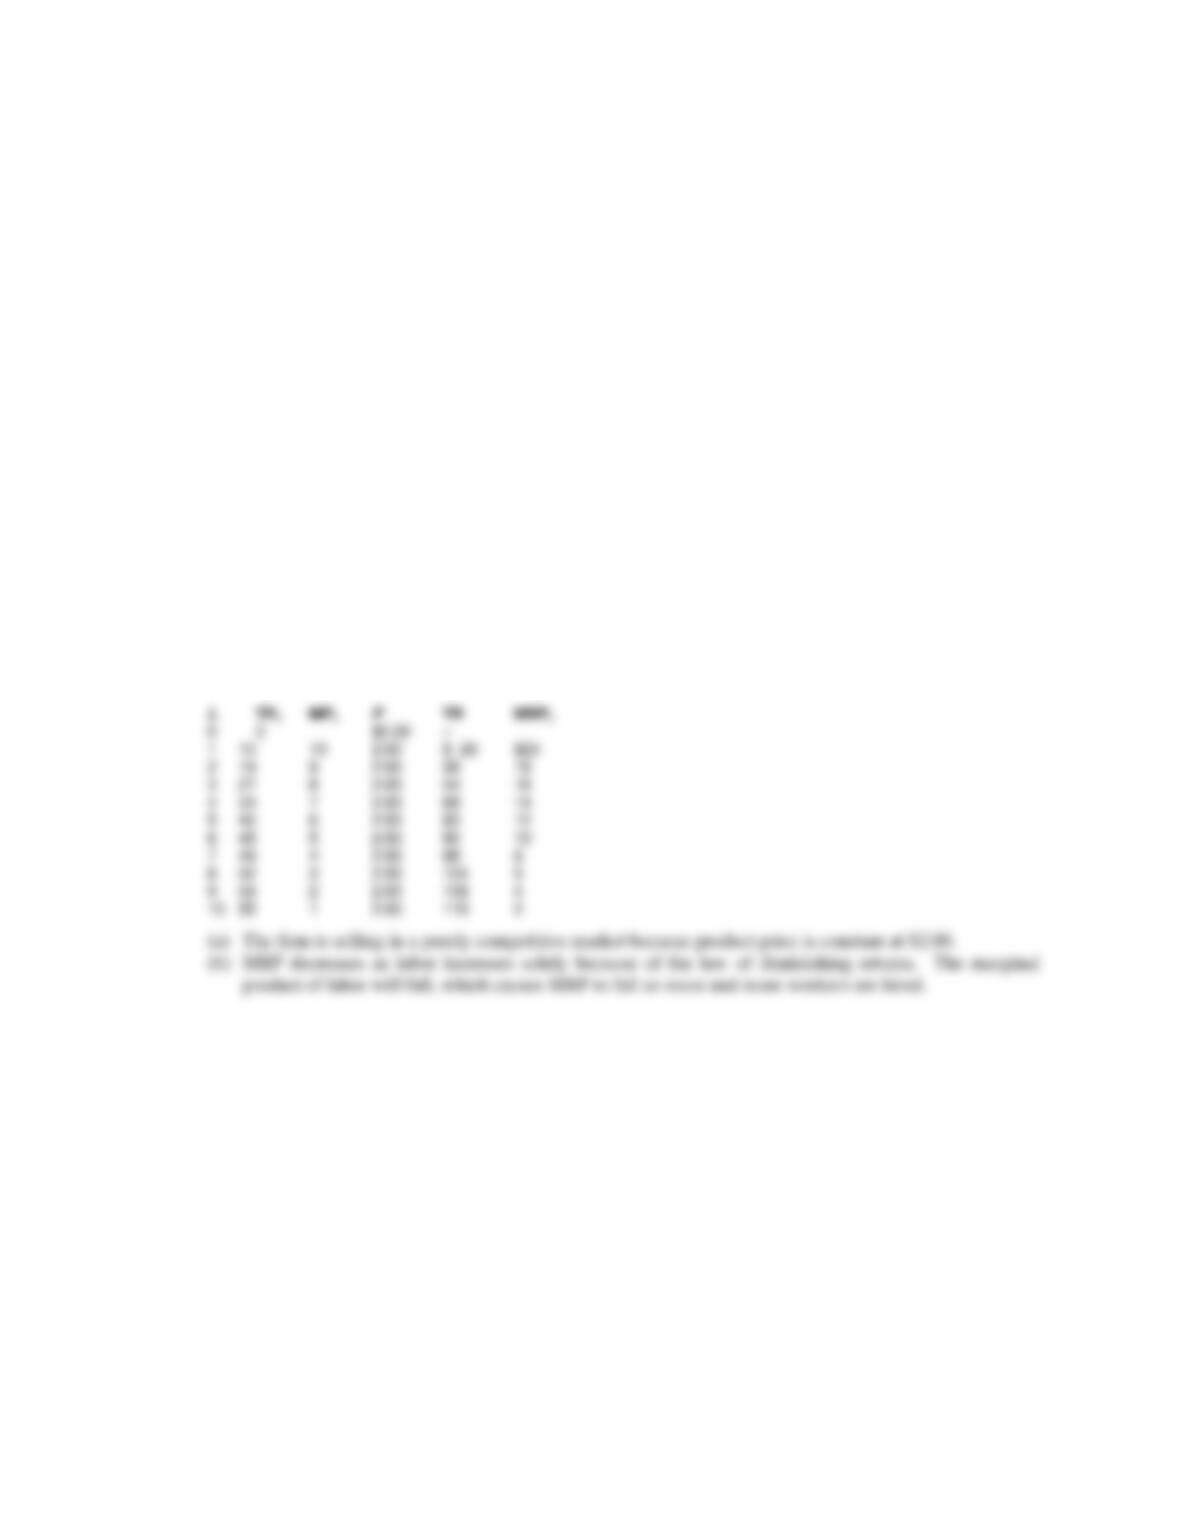
L TPL MPL P TR MRPL
0 0 $2.00 $_____
1 10 _____ 2.00 _____ $_____
2 19 _____ 2.00 _____ _____
3 27 _____ 2.00 _____ _____
4 34 _____ 2.00 _____ _____
5 40 _____ 2.00 _____ _____
6 45 _____ 2.00 _____ _____
7 49 _____ 2.00 _____ _____
8 52 _____ 2.00 _____ _____
9 54 _____ 2.00 _____ _____
10 55 _____ 2.00 _____ _____
(a) In what type of market is the firm selling its product? How do you know?
(b) Why does the MRP schedule decrease as labor increases?
(c) Complete the following table.
Wage rate Quantity of
workers employed
$16 _____
14 _____
12 _____
10 _____
8 _____
6 _____
Chapter 12 – The Demand for Resources
12–16
15. Complete the following table, where L is the units of labor, TPL is the total product of labor, MPL is the
marginal product of labor, P is product price, TR is total revenue, and MRPL is the marginal revenue
product of labor.
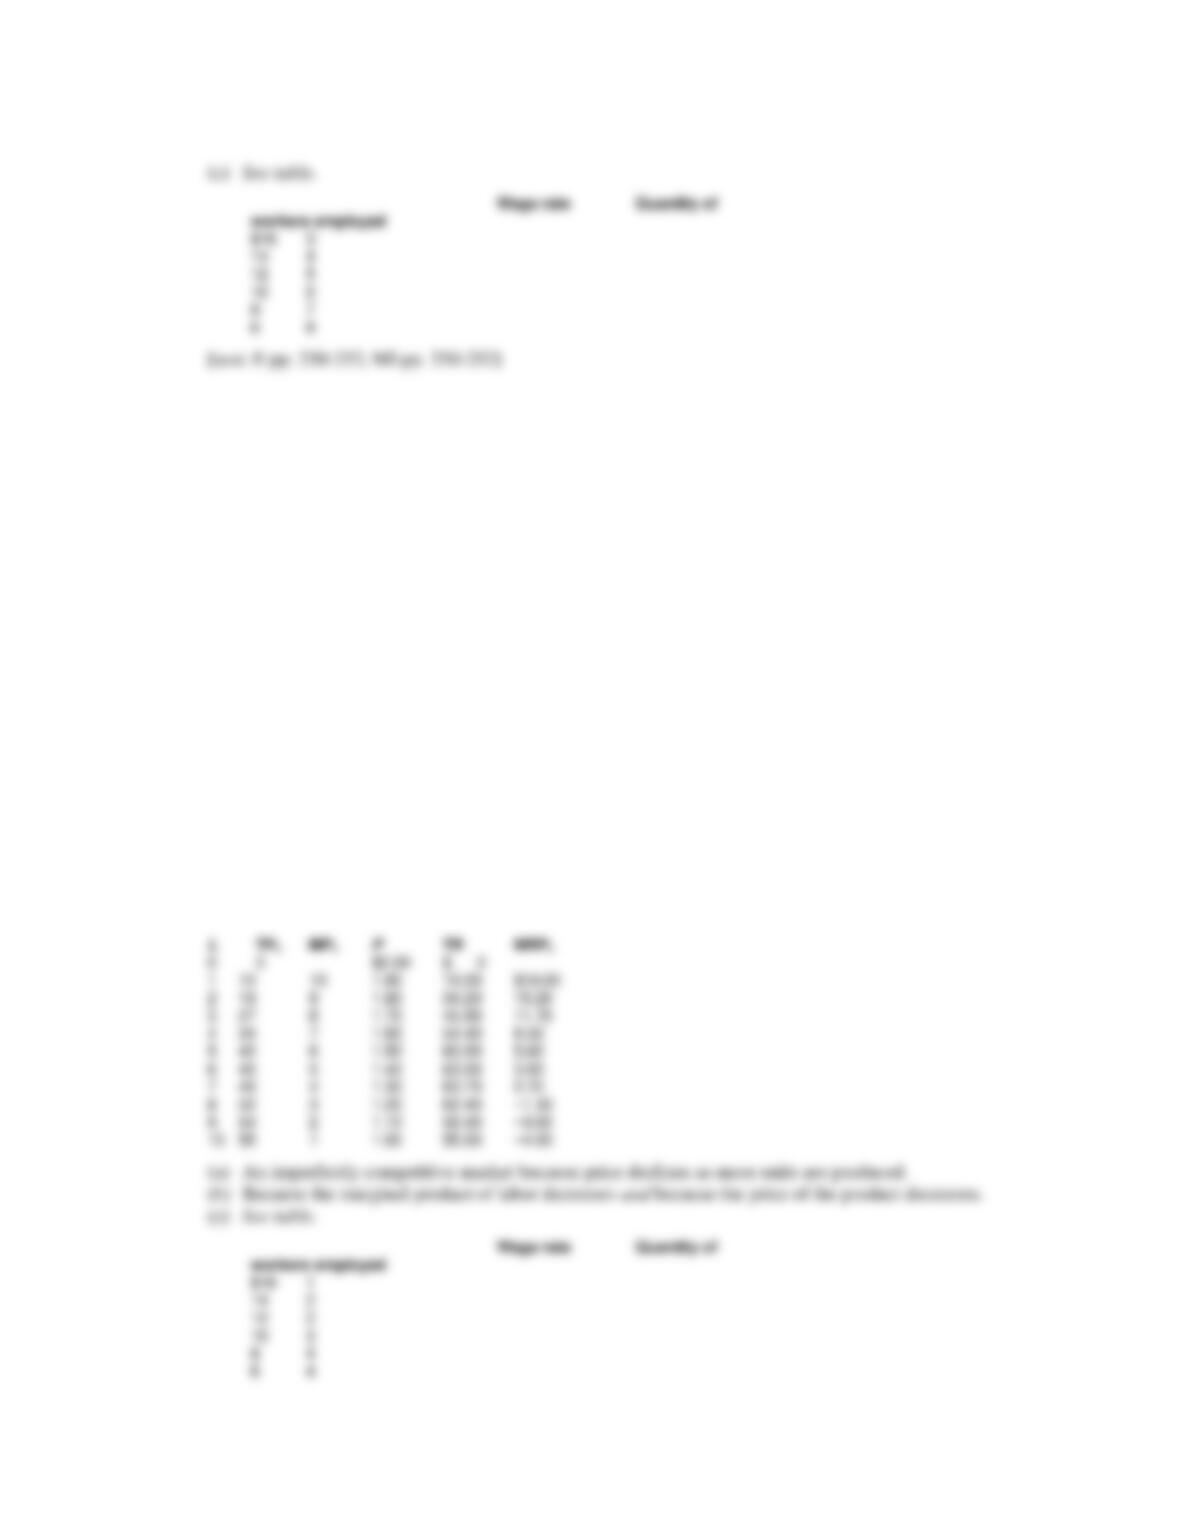
L TPL MPL P TR MRPL
0 0 $2.00 $_____
1 10 _____ 1.90 _____ $_____
2 19 _____ 1.80 _____ _____
3 27 _____ 1.70 _____ _____
4 34 _____ 1.60 _____ _____
5 40 _____ 1.50 _____ _____
6 45 _____ 1.40 _____ _____
7 49 _____ 1.30 _____ _____
8 52 _____ 1.20 _____ _____
9 54 _____ 1.10 _____ _____
10 55 _____ 1.00 _____ _____
(a) In what type of market is the firm selling its product? How do you know?
(b) Why does the MRP schedule decrease as labor increases?
(c) Complete the following table.
Wage rate Quantity of
workers employed
$16 _____
14 _____
12 _____
10 _____
8 _____
6 _____

Chapter 12 – The Demand for Resources
12–17
16. Complete the following table, where L is the units of labor, TPL is the total product of labor, MPL is the
marginal product of labor, P is product price, TR is total revenue, and MRPL is the marginal revenue
product of labor.
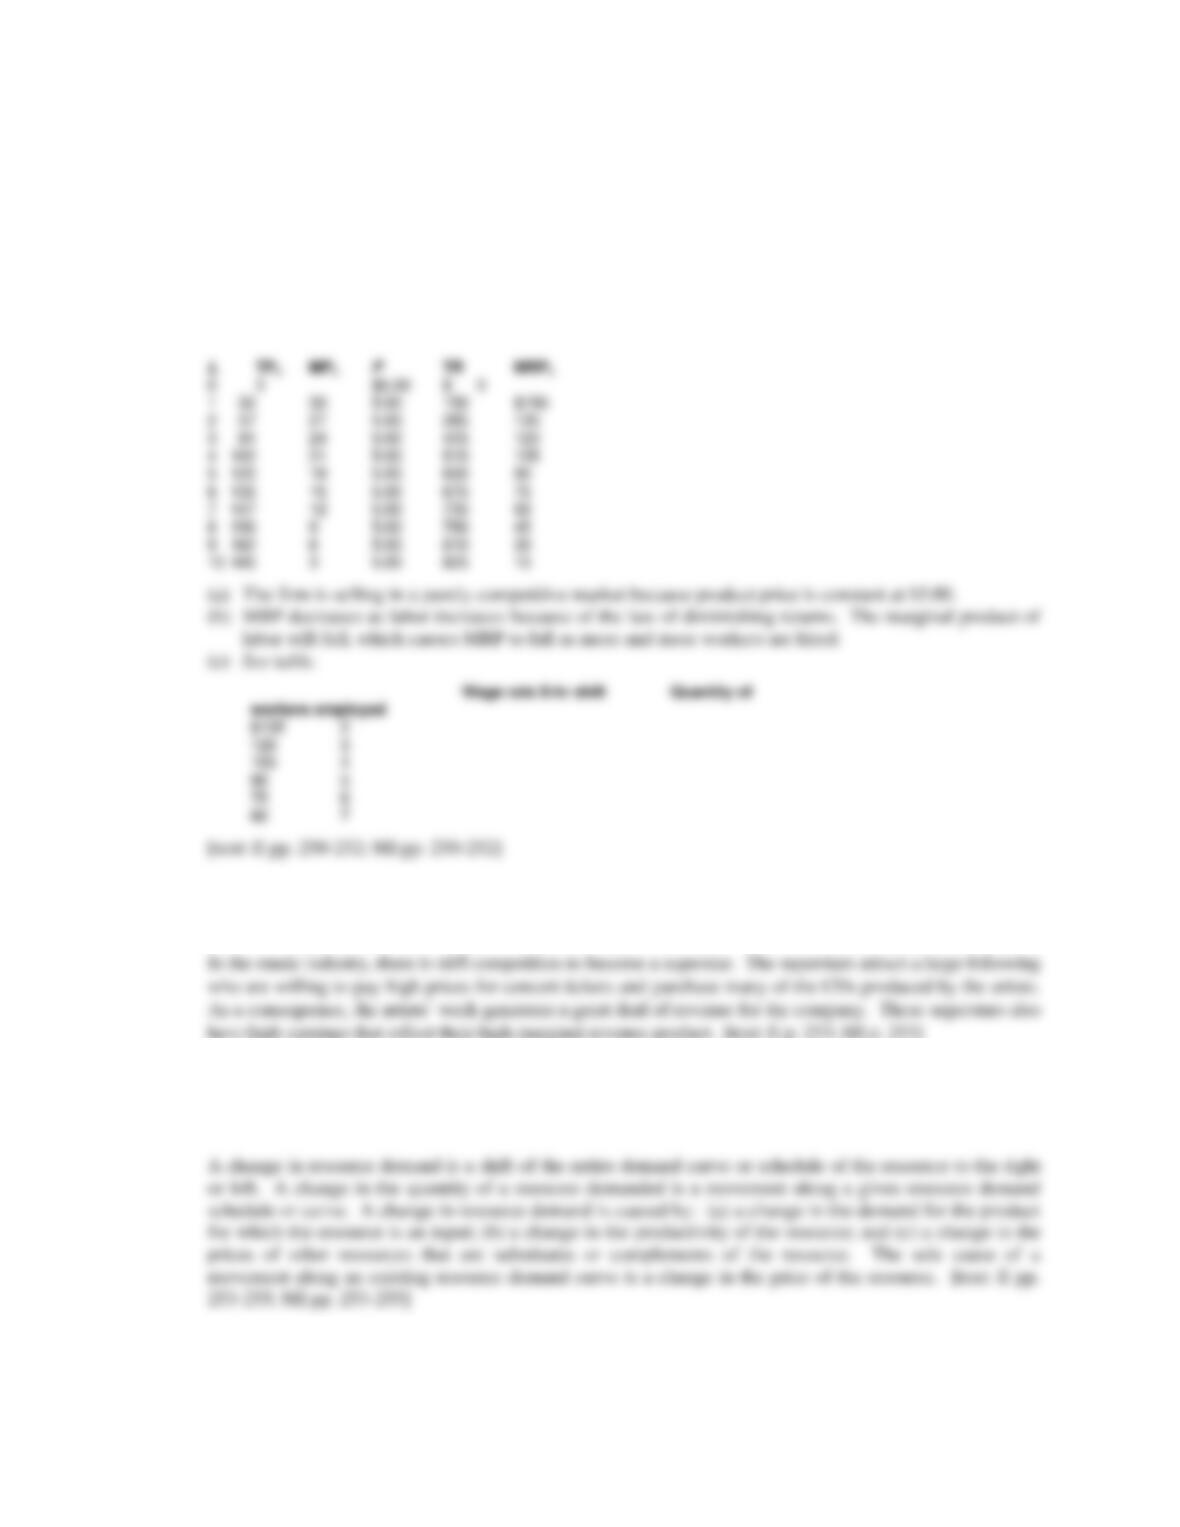
L TPL MPL P TR MRPL
0 0 $5.00 $_____
1 30 _____ 5.00 _____ $_____
2 57 _____ 5.00 _____ _____
3 81 _____ 5.00 _____ _____
4 102 _____ 5.00 _____ _____
5 120 _____ 5.00 _____ _____
6 135 _____ 5.00 _____ _____
7 147 _____ 5.00 _____ _____
8 156 _____ 5.00 _____ _____
9 162 _____ 5.00 _____ _____
10 165 _____ 5.00 _____ _____
(a) In what type of market is the firm selling its product? How do you know?
(b) Why does the MRP schedule decrease as labor increases?
Chapter 12 – The Demand for Resources
12–18
(c) Complete the following table.
Wage rate 8-hr shift Quantity of
workers employed
$135 _____
120 _____
105 _____
90 _____
75 _____
60 _____
17. (Consider This) How is marginal revenue product reflected in “winner–take-all” markets such as in the music
industry?
18. What is the difference between a change in resource demand and a change in the quantity of a resource
demanded? What factors contribute to a change in resource demand or a change in the quantity of a
resource demanded?
19. How will a change in productivity change the demand for a resource? What three factors will affect
productivity?
Chapter 12 – The Demand for Resources
20. Compare the factors that will cause shifts in the downsloping resource demand and product demand curves.
21. Assume that labor and capital are substitutes in production. If there is an increase in the price of capital,
how can this lead to either an increase or decrease in the demand for labor?
22. Why is the effect of a change in price of a substitute good potentially ambiguous?
23. Does it matter whether capital and labor are substitutes or complements when figuring out what will
happen to the demand for labor if the price of capital increases? Explain.
Chapter 12 – The Demand for Resources
12–20
24. Compare and explain the significance of the substitution and output effects as they apply to resource
pricing. What relationship, if any, do they bear to the income and substitution effects discussed in
connection with product demand?
25. Indicate how the following events will shift the firm’s demand curve for labor: increase it (I); decrease it
(D); keep it the same (S).
___ Technological advances increase labor’s productivity.
___ The wage rate increases.
___ The demand for the product that labor produces decreases.
___ The wage rate decreases.
___ Absenteeism reduces labor’s productivity.
___ The price of labor-saving machinery is reduced and the substitution effect is greater than the output
effect.
26. What are examples of the fastest growing occupations in percentage terms expected to be from 2008–2018?
What economic principle of resource pricing best explains these trends?
27. What are three examples of occupations that are expected to experience a rapid decline in employment
from 2008–2018? Why are these occupations likely to experience this decline?
Chapter 12 – The Demand for Resources
12–21
28. What will be the elasticity of resource demand in the following cases?
(a) unit wages rise by 10% and the number of employed workers falls by 5%
(b) unit wages rise by 4% and the number of employed workers falls by 6%
(c) unit wages rise by 3% and the number of employed workers falls by 3%
29. Compare the factors that explain the elasticity of resource and product demand.
30. What effect, if any, will each of the following have upon the elasticity or the location of the demand curve
for resource J that is being used in the production of commodity X? If there is uncertainty as to the precise
effect, explain the sources of that uncertainty.
(a) A decline in the demand for product X.
(b) An increase in the price of Y, a substitute product for X.
(c) A decline in the price of substitute resource K.
(d) A decline in the number of available resources that are substitutable for J in the production of X.
(e) An increase in the price of complementary resource L.
(f) An increase in the elasticity of demand for product X due to an increase in the number of sellers in the
market.
31. Explain briefly and concisely the meaning and significance of the following equation:
1
capital of Price
capital of MRP
labor of Price
labor of MRP ==
Chapter 12 – The Demand for Resources
12–22
32. A firm combines two resources, X and Y, to produce an output level Q in a purely competitive market. The
cost of a unit of X is $15 and the cost of a unit of Y is $8. The marginal product of X is 30 units and the
marginal product of Y is currently 24 units at output level Q. What would you recommend that the firm do
given this resource combination?
33. A perfectly competitive firm in the factor and product markets sells its output for $1 and pays factors PL =
$9 and Pc = $12. What is the profit-maximizing combination of labor (L) and capital (C) for the firm?
34. In the table below are the marginal-product and marginal-revenue-product schedules for resource A and
resource B. Both resources are variable and are employed in purely competitive markets. The price of A is
$1 and the price of B is $2.
Quantity of resource A employed Marginal product
of A Marginal revenue product of A Quantity of resource B employed Marginal product
of B Marginal revenue product of B
1 20 $5.00 1 20 $5.00
2 16 4.00 2 18 4.50
3 12 3.00 3 16 4.00
4 10 2.50 4 12 3.00
5 8 2.00 5 8 2.00
6 4 1.00 6 6 1.50
7 2 .50 7 4 1.00
(a) What is the least-cost combination of resources A and B that would enable the firm to product 120
units of output?
(b) What is the profit-maximizing combination of A and B?
(c) What is total output and profit when the firm is employing the profit-maximizing combinations of A
and B?
Chapter 12 – The Demand for Resources
12–23
35. In the table below are the marginal-product and marginal-revenue-product schedules for resource A and
resource B. Both resources are variable and are employed in purely competitive markets. The price of A is
$2 and the price of B is $4.
Quantity of resource A employed Marginal product
of A Marginal revenue product of A Quantity of resource B employed Marginal product
of B Marginal revenue product of B
1 40 $10.00 1 40 $10.00
2 32 8.00 2 36 9.00
3 24 6.00 3 32 8.00
4 20 5.00 4 24 6.00
5 16 4.00 5 16 4.00
6 8 2.00 6 12 3.00
7 4 1.00 7 8 2.00
(a) What is the least-cost combination of resources A and B that would enable the firm to produce 240
units of output?
(b) What is the profit-maximizing combination of A and B?
(c) What is the total output and profit when the firm is employing the profit-maximizing combination of A
and B?
36. The table below summarizes the marginal product and marginal revenue product information for labor and
capital. Assume the other quantities used by the firm remain constant. The price for labor is $6 and the
price for capital is $4. Use the table to answer the following questions.
QL MPL MRPL QK MPK MRPK
1 50 $36 1 40 $30
2 45 30 2 38 29
3 30 24 3 32 25
4 20 18 4 30 20
5 10 12 5 20 18
6 5 6 6 15 15
7 0 0 7 10 10
(a) What would be the least-cost combination of labor and capital that would enable the firm to produce
285 units?
(b) What is the profit-maximizing combination of A and B?
(c) Suppose the price of capital decreases to $3. Now, what is the least–cost combination of labor and
capital? How many units of output would it allow the firm to produce?
(d) Given the price change, now what is the profit-maximizing combination of labor and capital? How has
output changed?
Chapter 12 – The Demand for Resources
37. A firm combines two resources, A and B, to produce an output level Q in a purely competitive market. The
cost of a unit of A is $5 and the cost of a unit of B is $12. The marginal revenue product of A is $5 and the
marginal revenue product of B is currently $12. What would you recommend that the firm do given this
resource combination?
38. What are two criticisms of the marginal productivity theory of income distribution?
39. “Under competition, workers are paid what they are worth.” Explain and evaluate this statement. Does it
follow that the resulting distribution of wage incomes is desirable?
40. (Last Word) Why are banks using more automatic teller machines (ATMs) and employing fewer human
tellers? What economic principle is illustrated about resource markets by this example?

Chapter 12 – The Demand for Resources
12–25