Chapter 11 – Monopolistic Competition and Oligopoly (+ Appendix)
111. If a product such as cement or bricks is costly to ship and, therefore, markets are very
localized, the national concentration ratio for that industry:
112. Concentration ratios may be inaccurate indicators of the degree of monopoly power in an
industry because:
113. If an industry evolves from monopolistic competition to oligopoly, we would expect:
Chapter 11 – Monopolistic Competition and Oligopoly (+ Appendix)
114. Interindustry competition means that:
115. If you sum the squares of the market shares of each firm in an industry (as measured by
percent of industry sales), you are calculating the:
Chapter 11 – Monopolistic Competition and Oligopoly (+ Appendix)
117. If the four-firm concentration ratio in an oligopolistic industry is 100 percent and each
firm has an equal percentage of sales, the Herfindahl Index is:
118. Assume six firms comprising an industry have market shares of 30, 30, 10, 10, 10, and
10 percent. The Herfindahl Index for this industry is:
119. Suppose the Herfindahl Indexes for industries A, B, and C are 1,200, 5,000, and 7,500
respectively. These data imply that:
Chapter 11 – Monopolistic Competition and Oligopoly (+ Appendix)
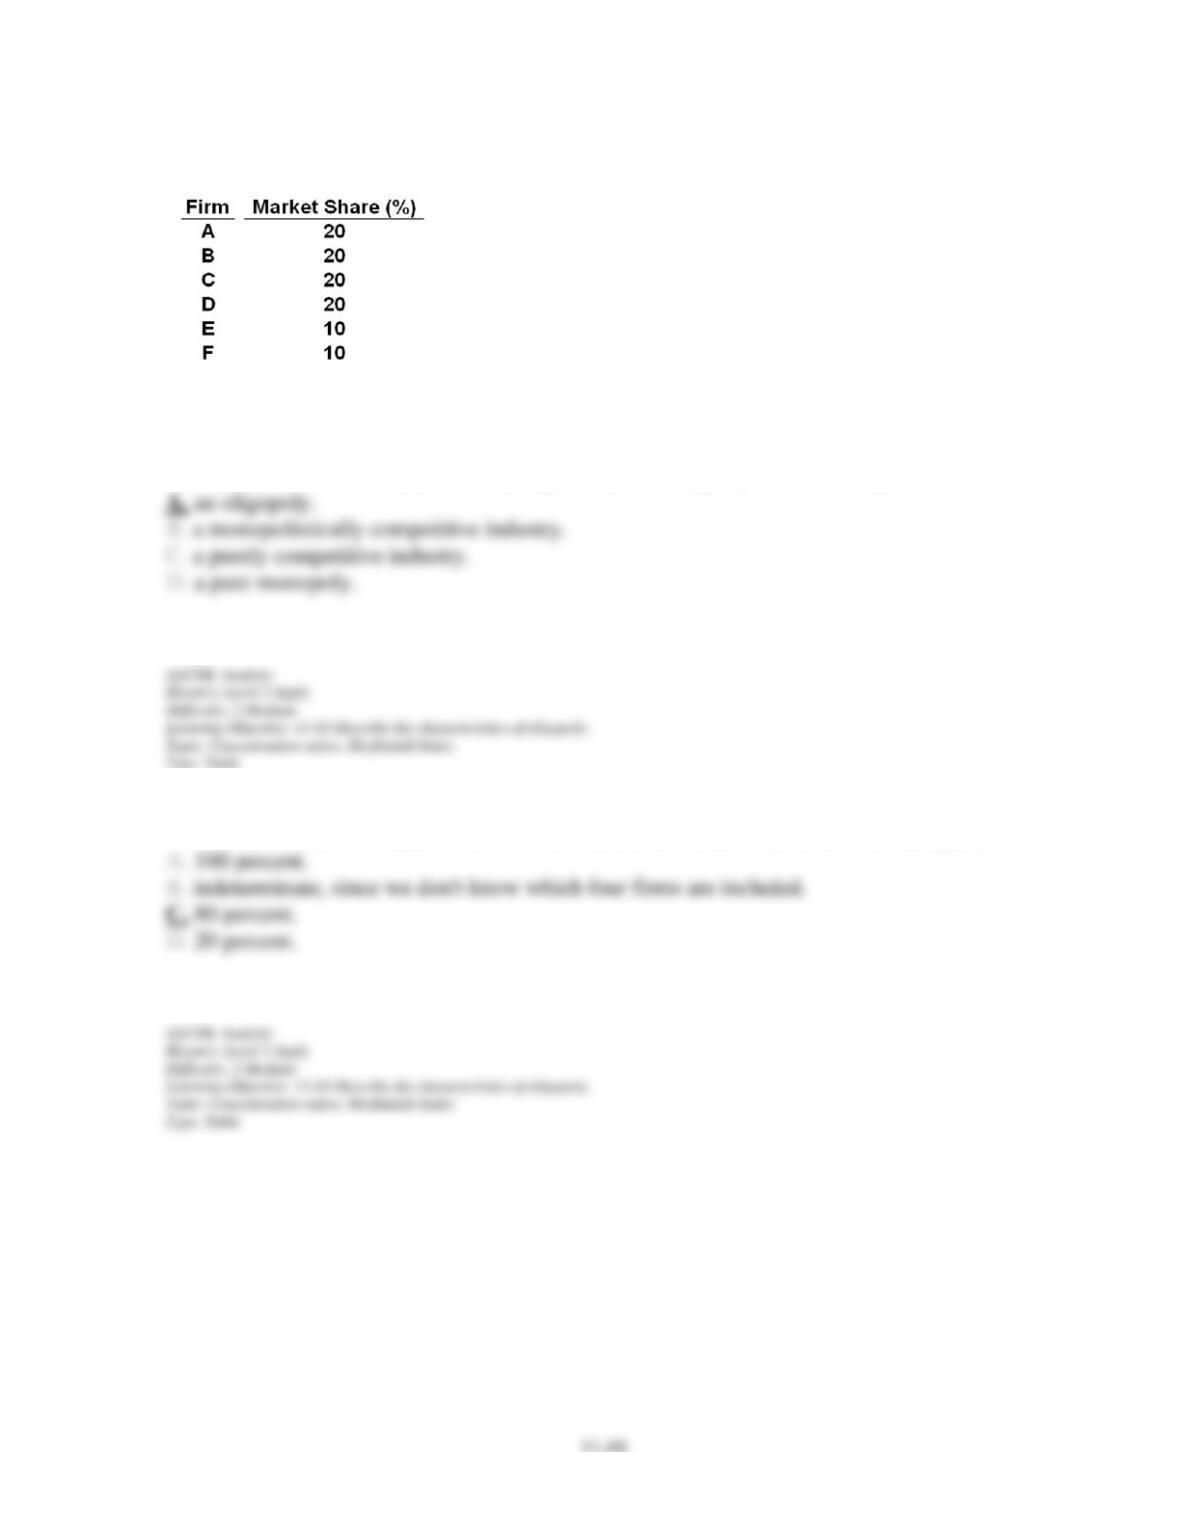
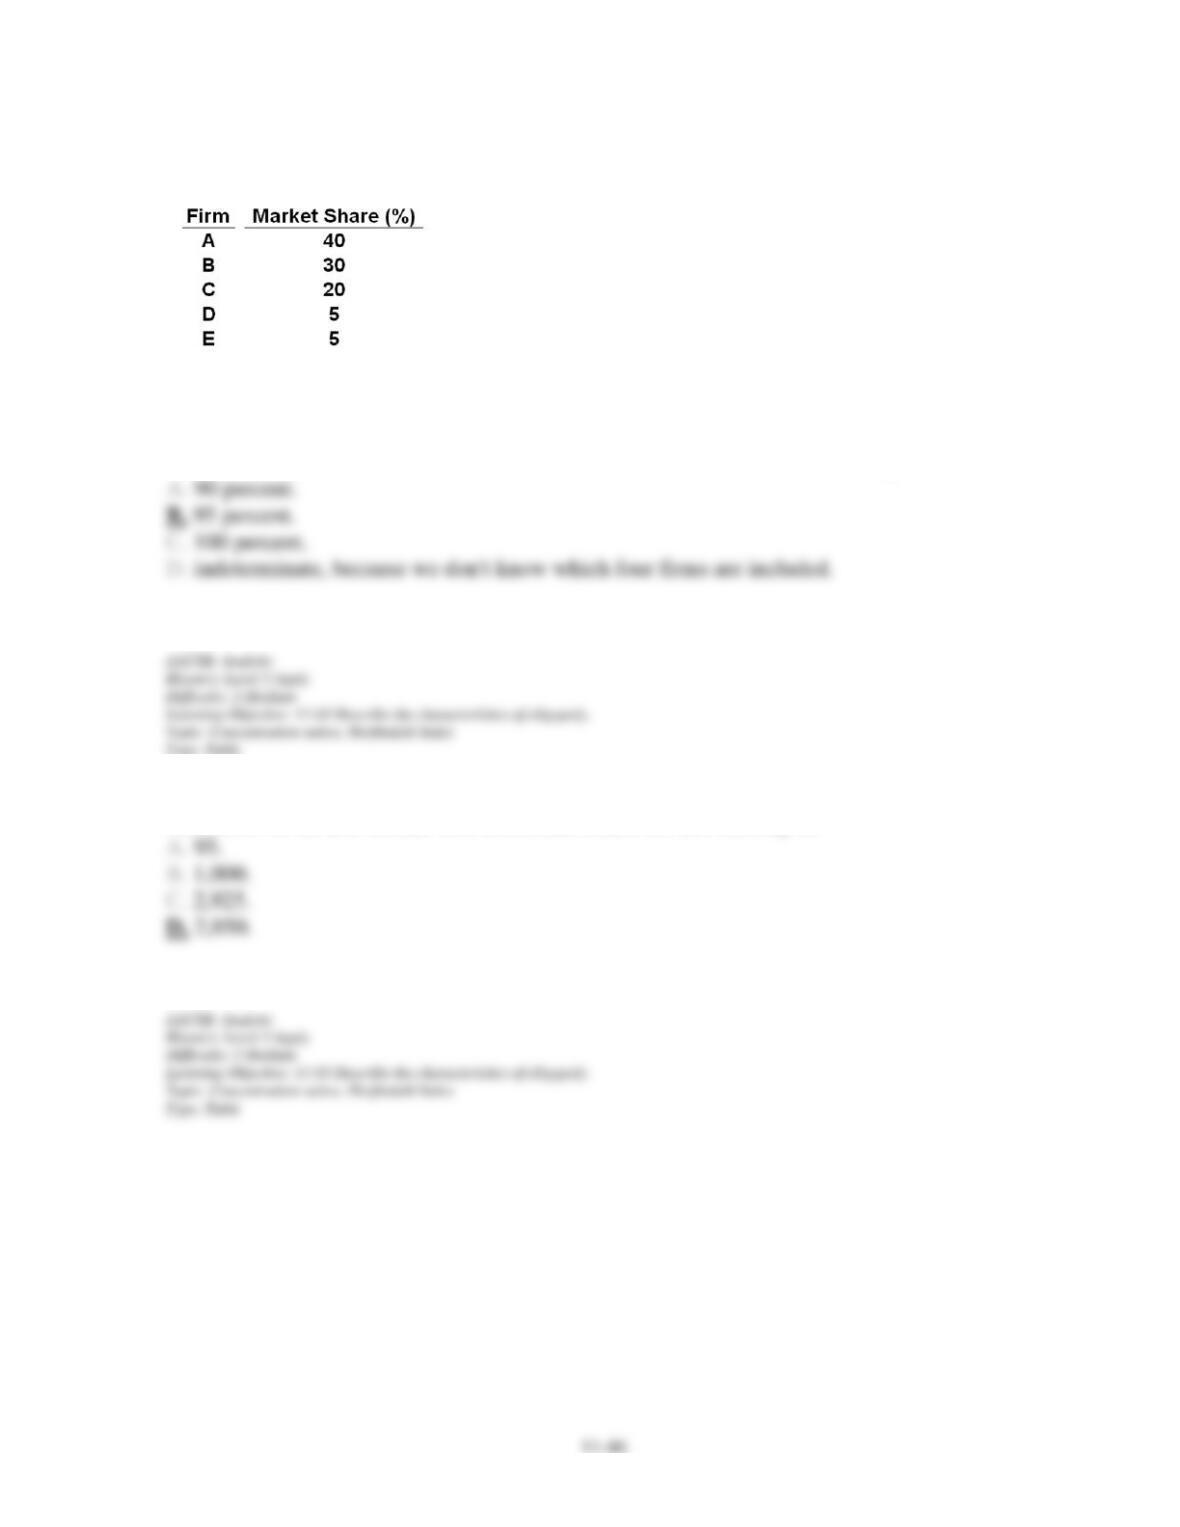
120. Refer to the above data. The industry characterized by the above information is:
121. Refer to the above data. The four-firm concentration ratio for the above industry is:
Chapter 11 – Monopolistic Competition and Oligopoly (+ Appendix)
122. Refer to the above data. The Herfindahl Index for the above industry is:
123. Refer to the above data. If all the firms in the above industry merged into a single firm,
the Herfindahl Index would become:
124. Refer to the above data. Suppose that firms in this industry split up such that there were
100 firms, each with a one percent market share. The four-firm concentration ratio and the
Herfindahl Index respectively would be:
Chapter 11 – Monopolistic Competition and Oligopoly (+ Appendix)
125. Refer to the above data. The four-firm concentration ratio for this industry is:
126. Refer to the above data. The Herfindahl Index for this industry is:
Chapter 11 – Monopolistic Competition and Oligopoly (+ Appendix)
127. Refer to the above data. This industry illustrates:
128. Refer to the data above. If Firm B merged with Firm C, the industry’s four-firm
concentration ratio would ____ and its Herfindahl Index would ___.
129. Game theory:
Chapter 11 – Monopolistic Competition and Oligopoly (+ Appendix)
130. The study of how people (or firms) behave in strategic situations is called:
131. Game theory is best suited to analyze the pricing behavior of:
132. Game theory can be used to demonstrate that oligopolists:
Chapter 11 – Monopolistic Competition and Oligopoly (+ Appendix)
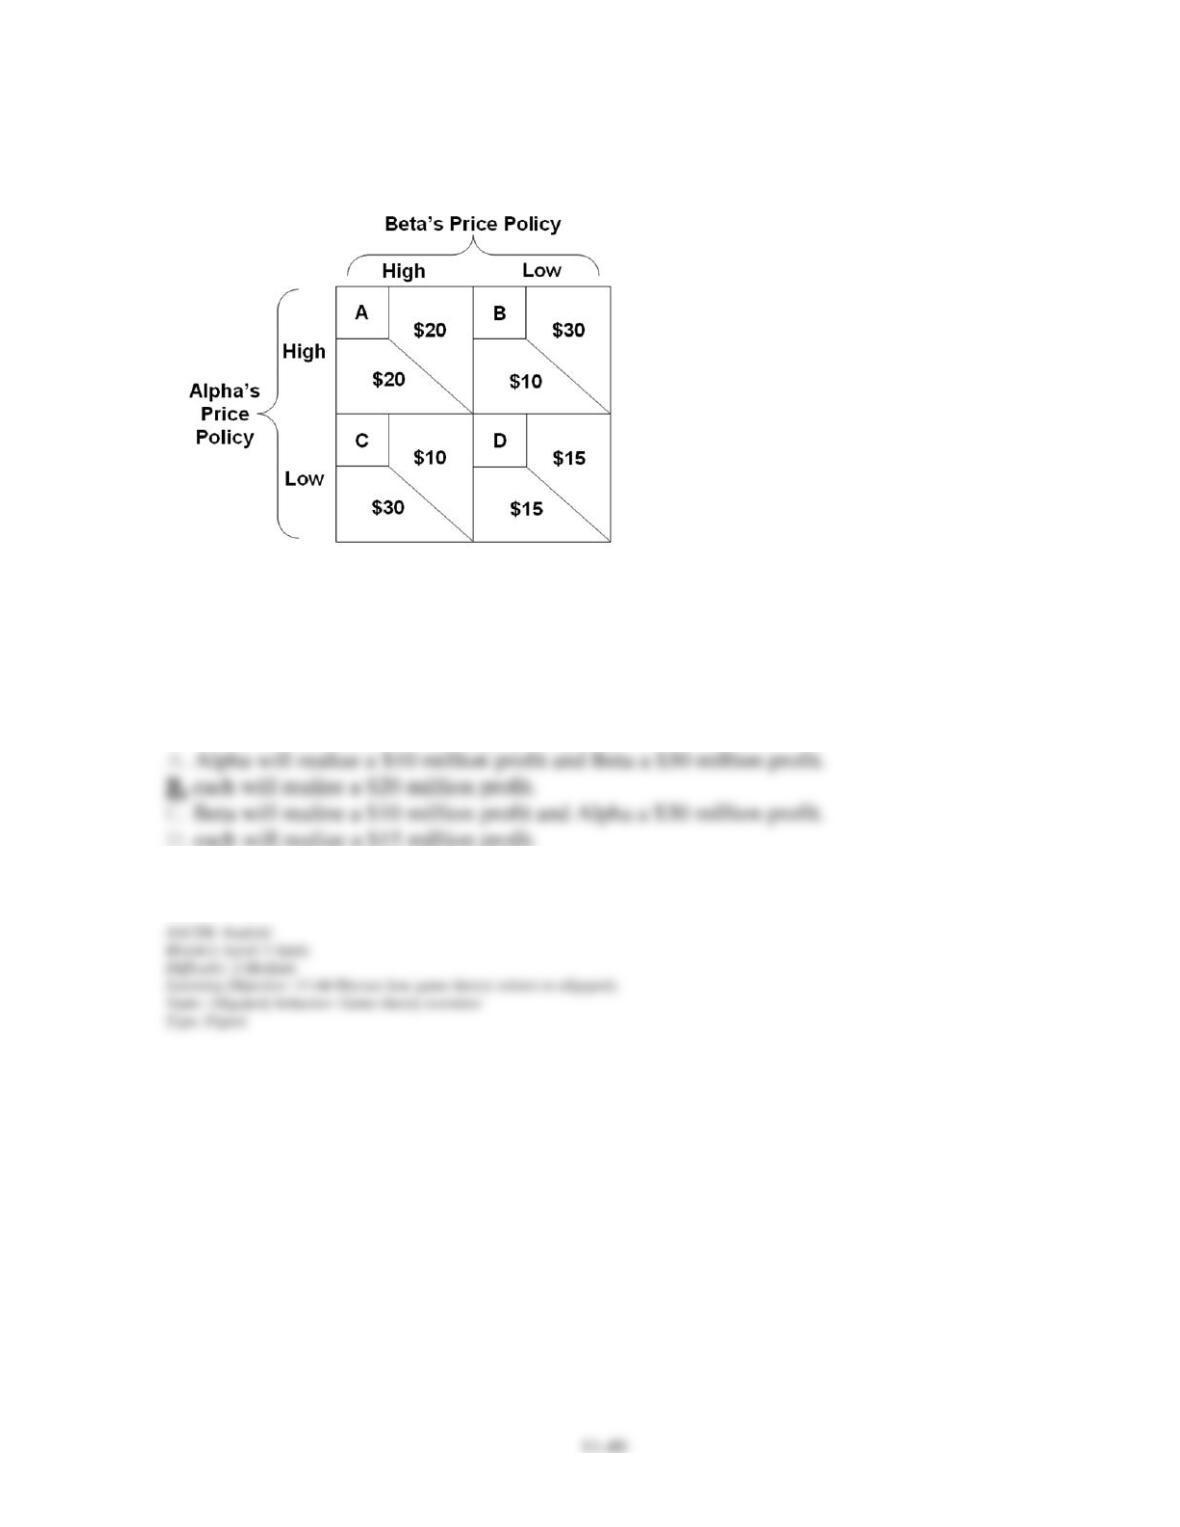
133. Refer to the above diagram where the numerical data show profits in millions of dollars.
Beta’s profits are shown in the northeast corner and Alpha’s profits in the southwest corner of
each cell. If both firms follow a high-price policy:
Chapter 11 – Monopolistic Competition and Oligopoly (+ Appendix)
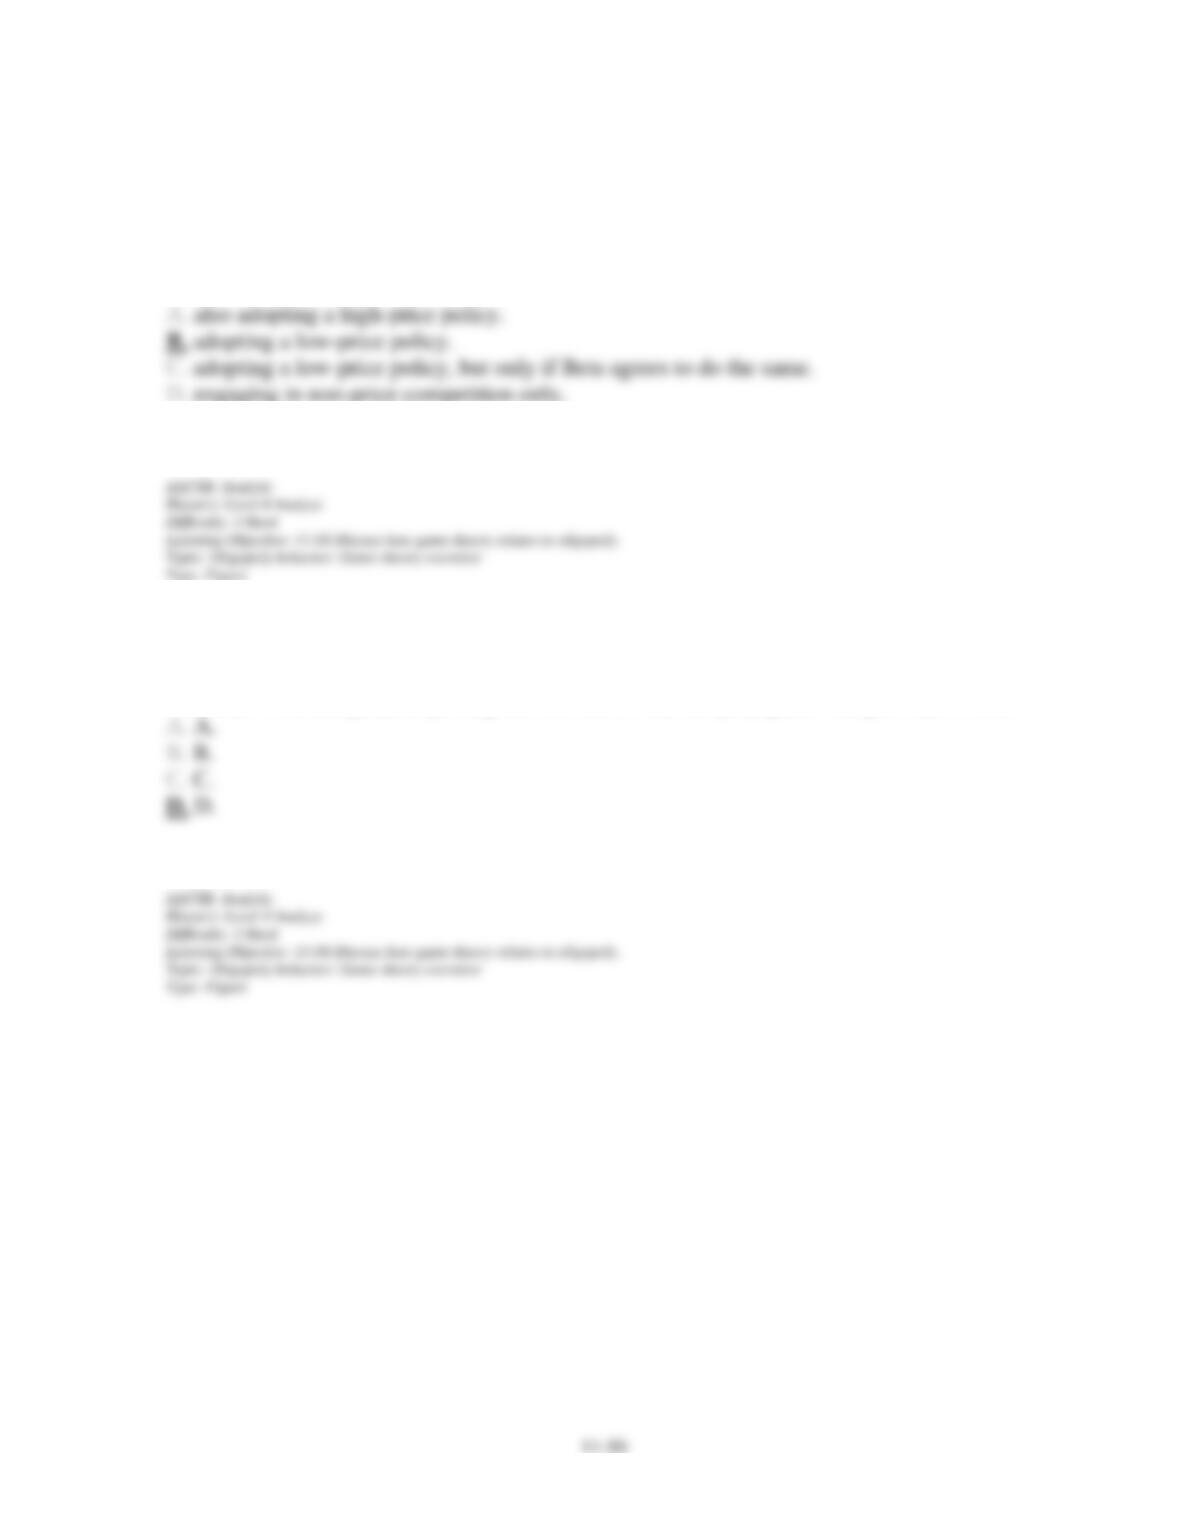
134. Refer to the above diagram wherein the numerical data show profits in millions of
dollars. Beta’s profits are shown in the northeast corner and Alpha’s profits in the southwest
corner of each cell. If Beta commits to a high-price policy, Alpha will gain the largest profit
by:
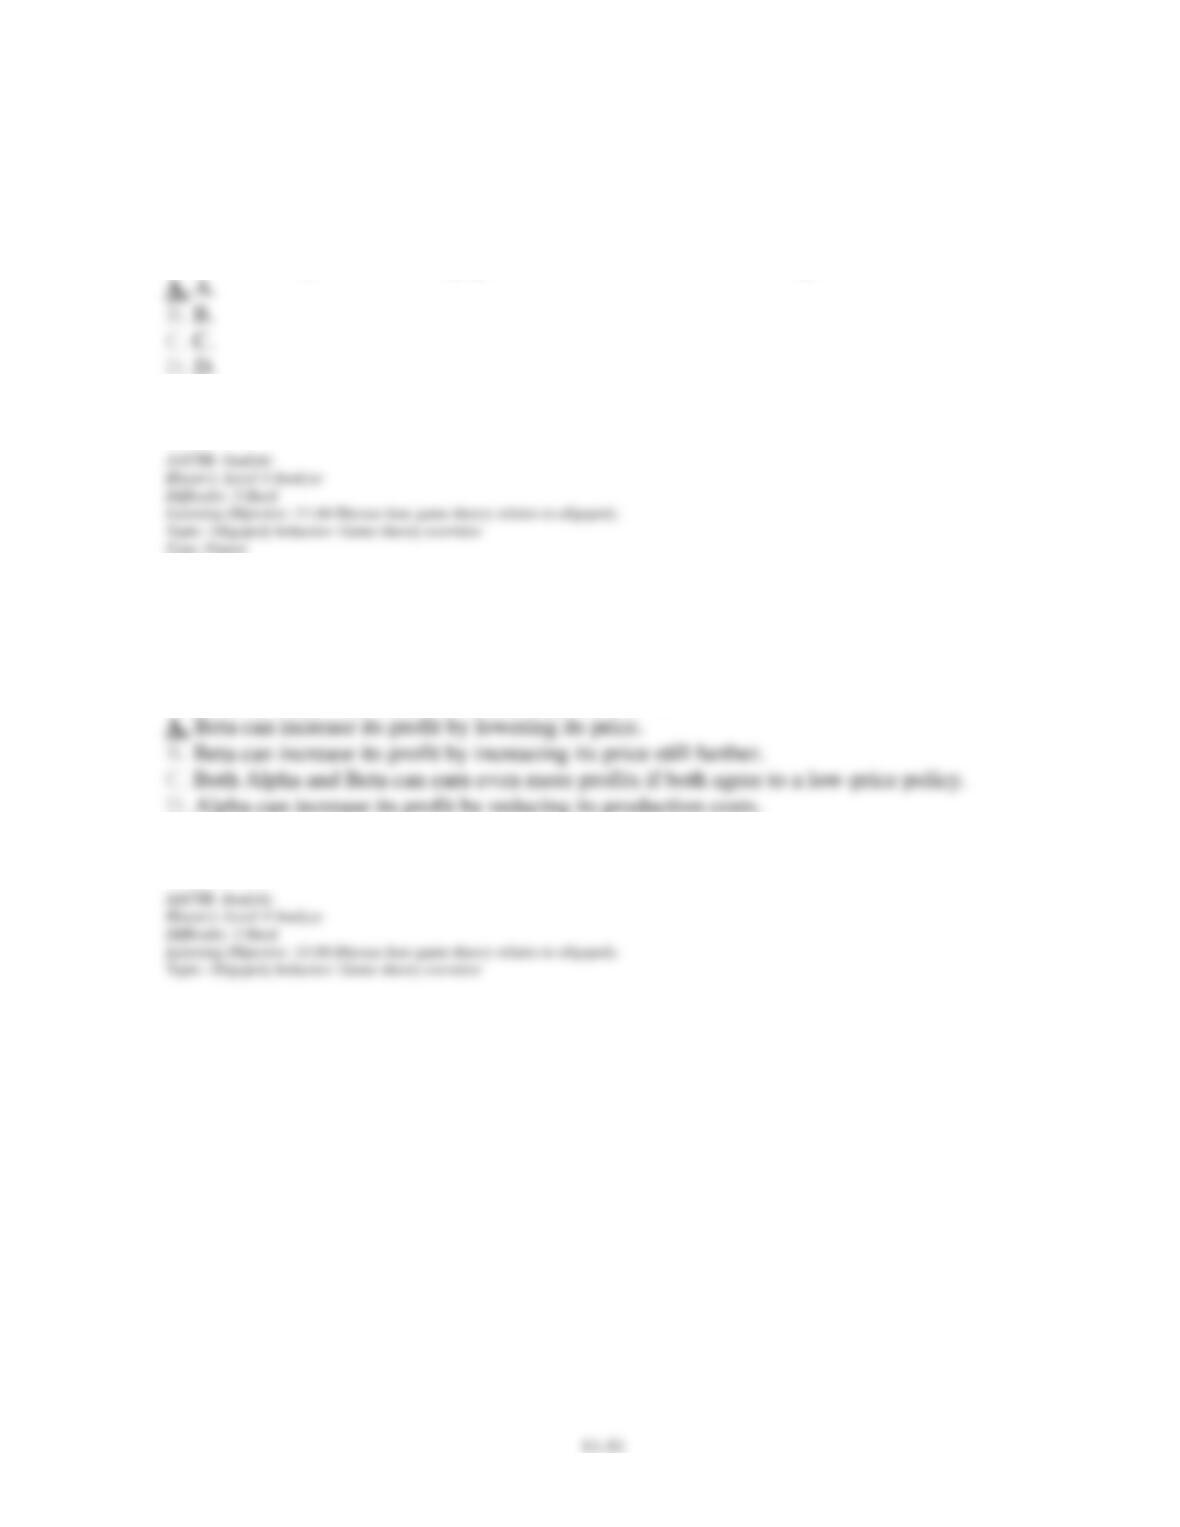
135. Refer to the above diagram where the numerical data show profits in millions of dollars.
Beta’s profits are shown in the northeast corner and Alpha’s profits in the southwest corner of
each cell. With independent pricing the outcome of this duopoly game will gravitate to cell:
Chapter 11 – Monopolistic Competition and Oligopoly (+ Appendix)
136. Refer to the above diagram where the numerical data show profits in millions of dollars.
Beta’s profits are shown in the northeast corner and Alpha’s profits in the southwest corner of
each cell. If Alpha and Beta engage in collusion, the outcome of the game will be at cell:
137. Refer to the above diagram where the numerical data show profits in millions of dollars.
Beta’s profits are shown in the northeast corner and Alpha’s profits in the southwest corner of
each cell. If Alpha and Beta agree to a high-price policy through collusion, the temptation to
cheat on that agreement is demonstrated by the fact that:
Chapter 11 – Monopolistic Competition and Oligopoly (+ Appendix)
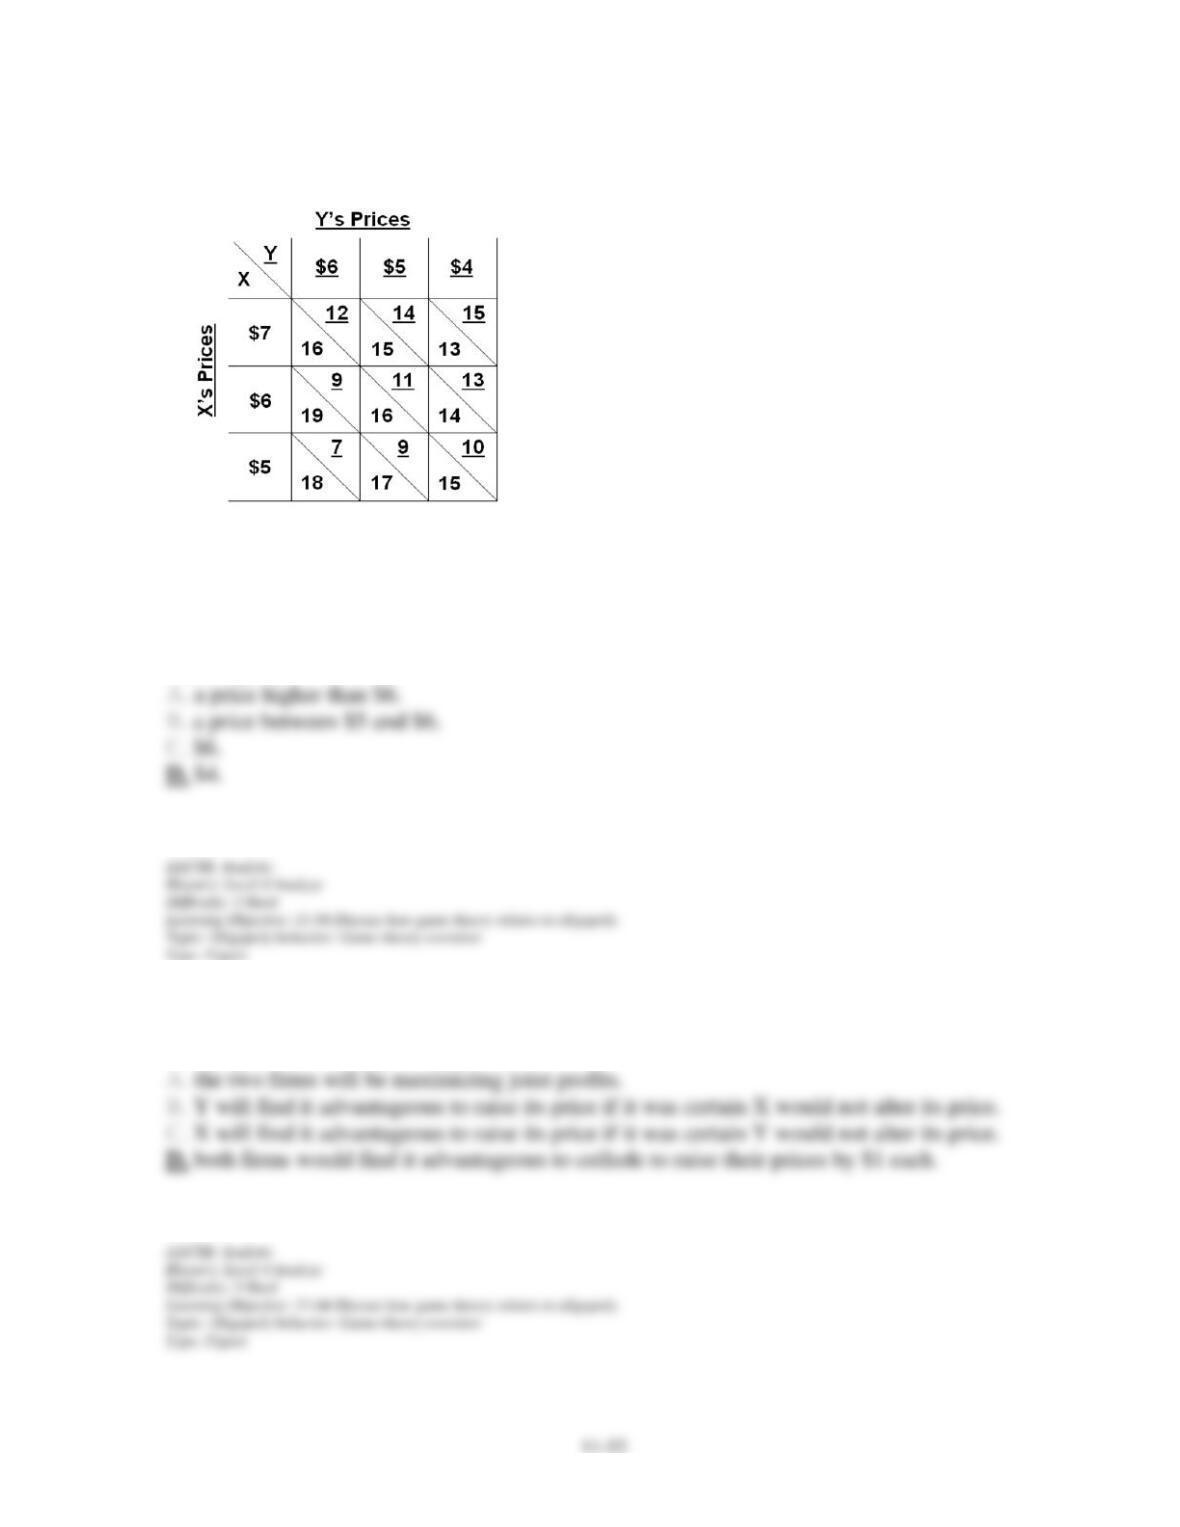
138. Refer to the above profits-payoff table for a duopoly. If the firms are acting
independently and firm X sets its price at $6, firm Y will achieve the largest profit by
selecting:
139. Refer to the above profits-payoff table for a duopoly. If initially firms X and Y are
charging $5 and $4 respectively:
Chapter 11 – Monopolistic Competition and Oligopoly (+ Appendix)
140. Refer to the above profits-payoff table for a duopoly. If initially firm X’s price was $6
and Y’s price was $5:
Chapter 11 – Monopolistic Competition and Oligopoly (+ Appendix)
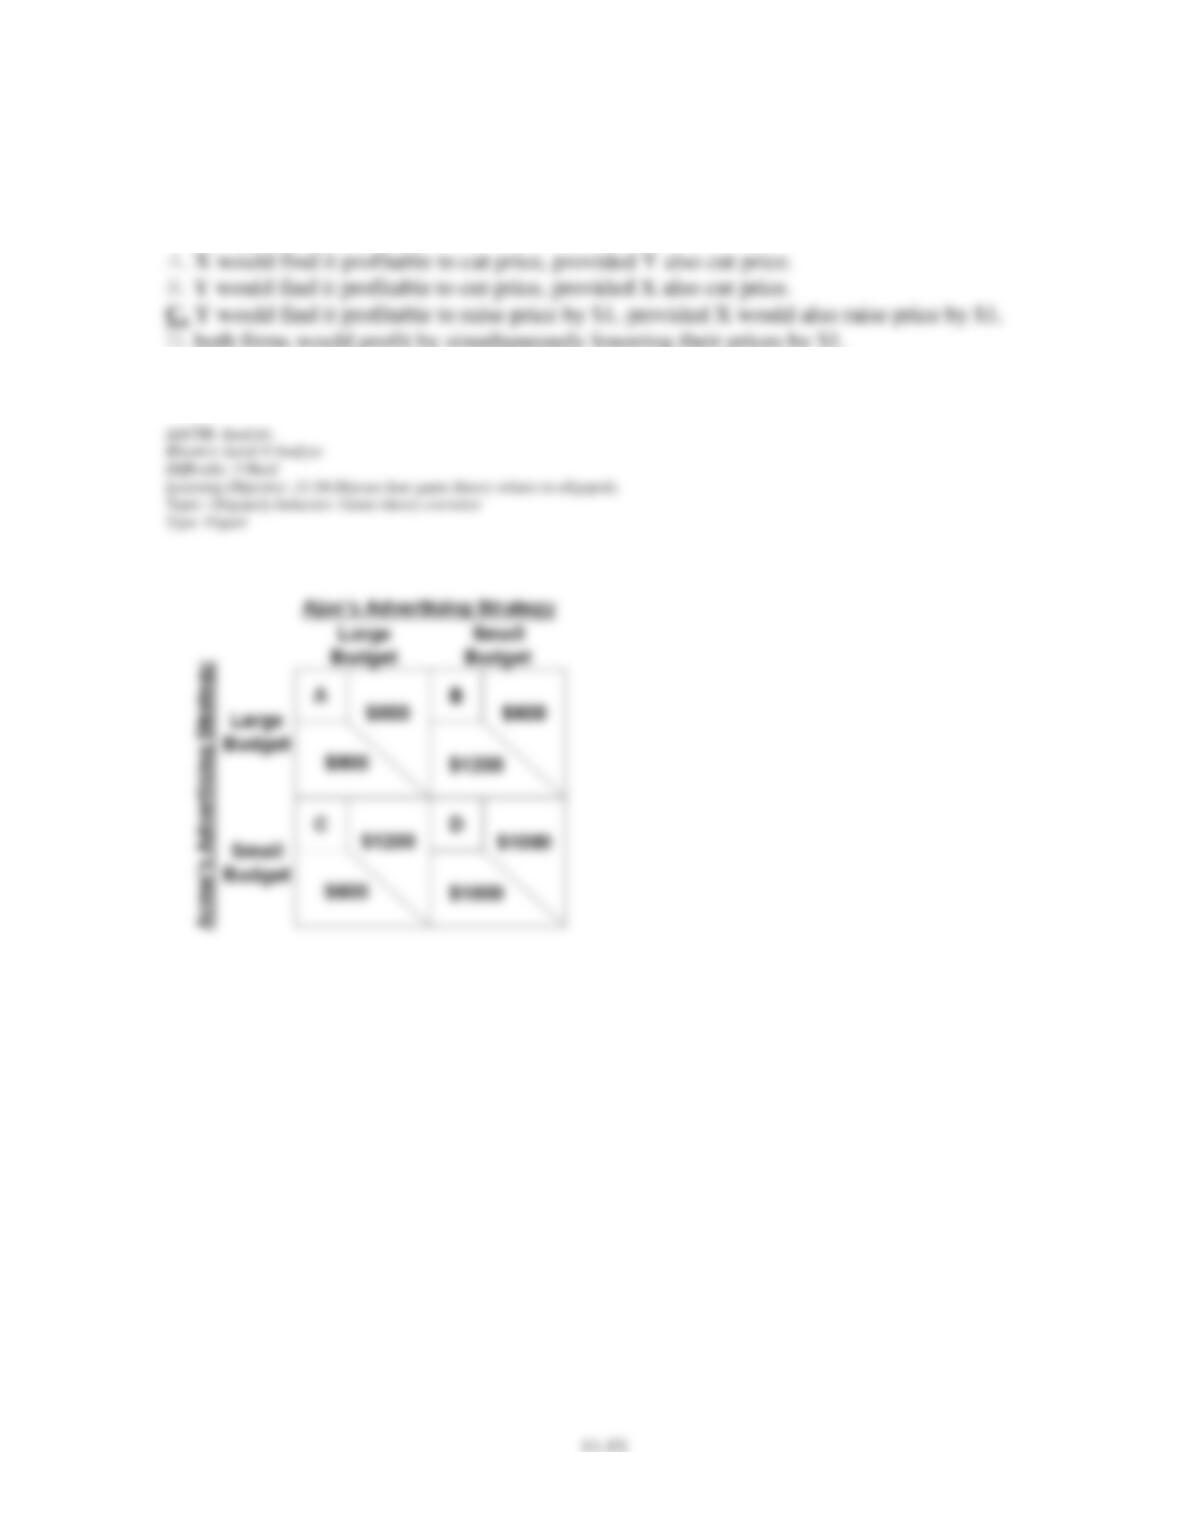
141. Refer to the above game theory matrix where the numerical data show the profits
resulting from alternative combinations of advertising strategies for Ajax and Acme. Ajax’s
profits are shown in the upper right part of each cell; Acme’s profits are shown in the lower
left. Without collusion, the outcome of the game is cell:
142. Refer to the above game theory matrix where the numerical data show the profits
resulting from alternative combinations of advertising strategies for Ajax and Acme. Ajax’s
profits are shown in the upper right part of each cell; Acme’s profits are shown in the lower
left. Without collusion, the outcome of the game:
Chapter 11 – Monopolistic Competition and Oligopoly (+ Appendix)
143. Refer to the above game theory matrix where the numerical data show the profits
resulting from alternative combinations of advertising strategies for Ajax and Acme. Ajax’s
profits are shown in the upper right part of each cell; Acme’s profits are shown in the lower
left. With collusion and no cheating, the outcome of the game is cell:
144. Suppose an oligopolistic producer assumes its rivals will ignore a price increase but
match a price cut. In this case the firm perceives its:
145. The kinked-demand curve of an oligopolist is based on the assumption that:
Chapter 11 – Monopolistic Competition and Oligopoly (+ Appendix)
146. If an oligopoly is faced with a kinked-demand curve that is relatively elastic above, and
relatively inelastic below, the going price, then it will:
147. The kinked-demand curve model of oligopoly is useful in explaining:
148. The kinked-demand curve model helps to explain price rigidity because:
Chapter 11 – Monopolistic Competition and Oligopoly (+ Appendix)
149. If competing oligopolists completely ignore oligopolist X’s price changes, then X’s:
150. If an oligopolist is faced with a marginal revenue curve that has a gap in it, we may
assume that:
151. The kinked-demand curve model of oligopoly:
Chapter 11 – Monopolistic Competition and Oligopoly (+ Appendix)
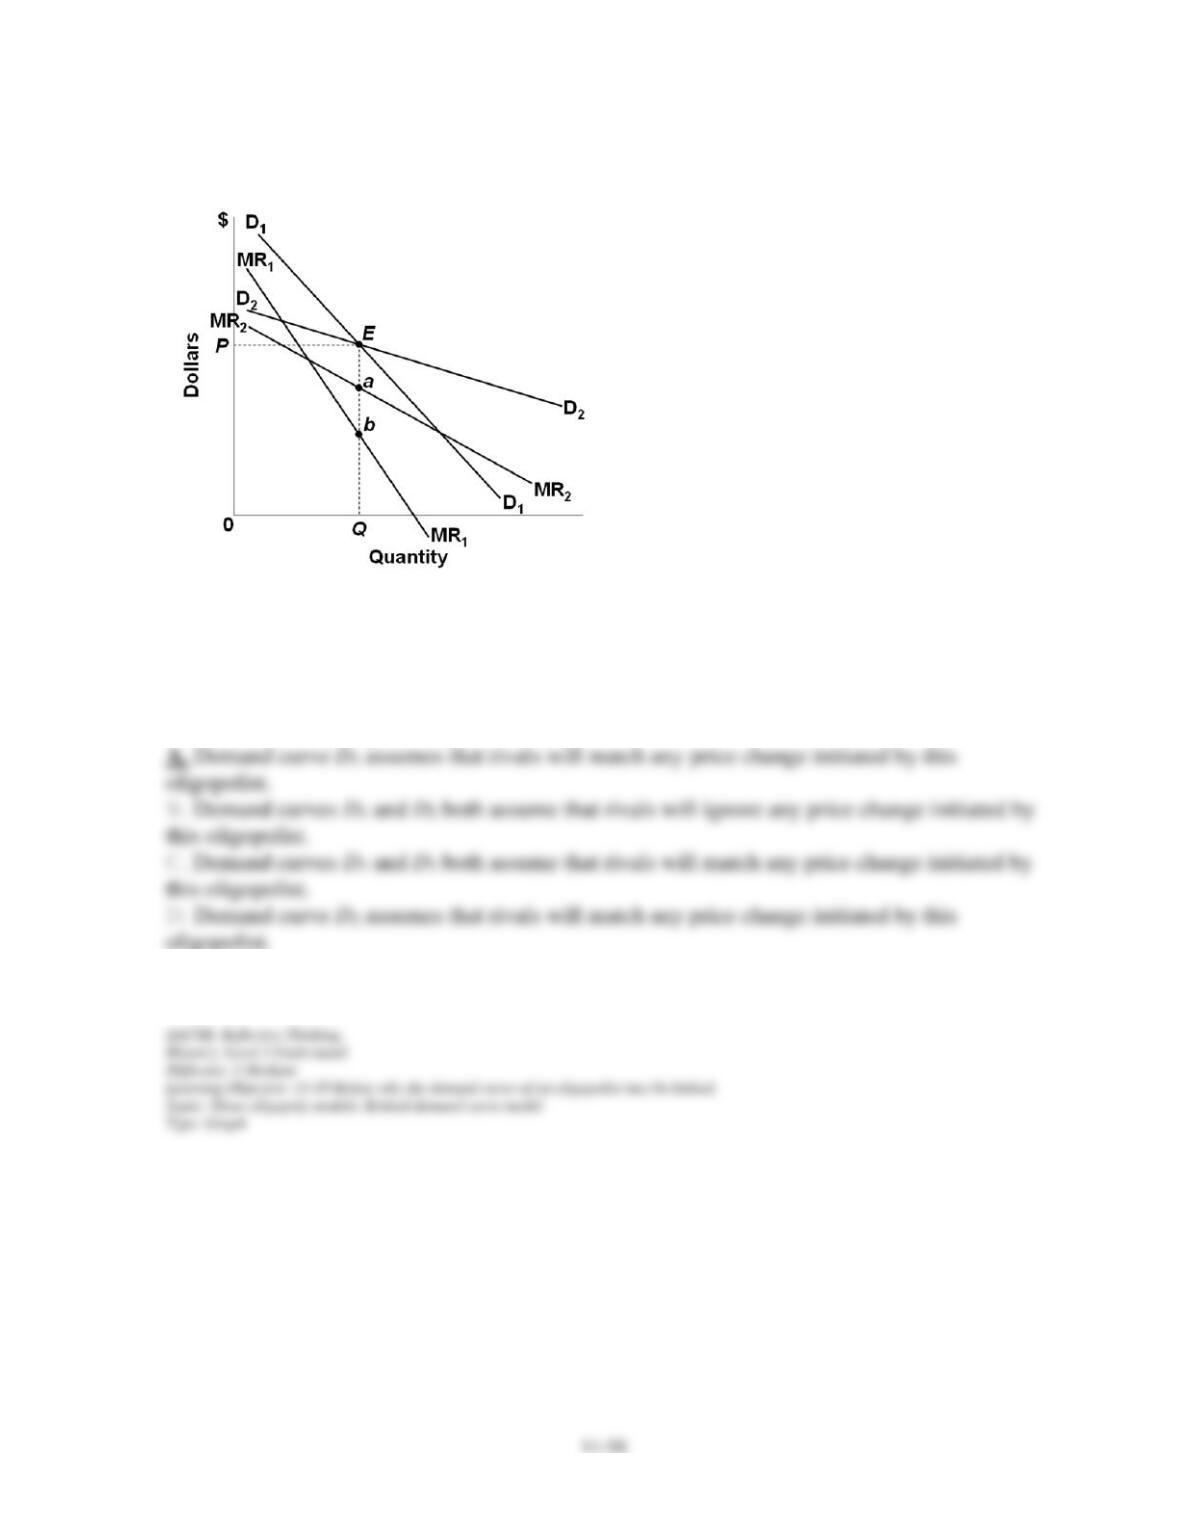
152. Refer to the above diagram for a noncollusive oligopolist. Suppose that the firm is
initially in equilibrium at point E where the equilibrium price and quantity are P and Q.
Which of the following statements is correct?
Chapter 11 – Monopolistic Competition and Oligopoly (+ Appendix)
153. Refer to the above diagram for a noncollusive oligopolist. Suppose that the firm is
initially in equilibrium at point E where the equilibrium price and quantity are P and Q. If the
firm’s rivals will ignore any price increase but match any price reduction, then the firm’s
demand curve will be (moving from left to right):
154. Refer to the above diagram for a noncollusive oligopolist. We assume that the firm is
initially in equilibrium at point E where the equilibrium price and quantity are P and Q. If the
firm’s rivals will ignore any price increase but match any price reduction, the firm’s marginal
revenue curve will be (moving from left to right):
Chapter 11 – Monopolistic Competition and Oligopoly (+ Appendix)
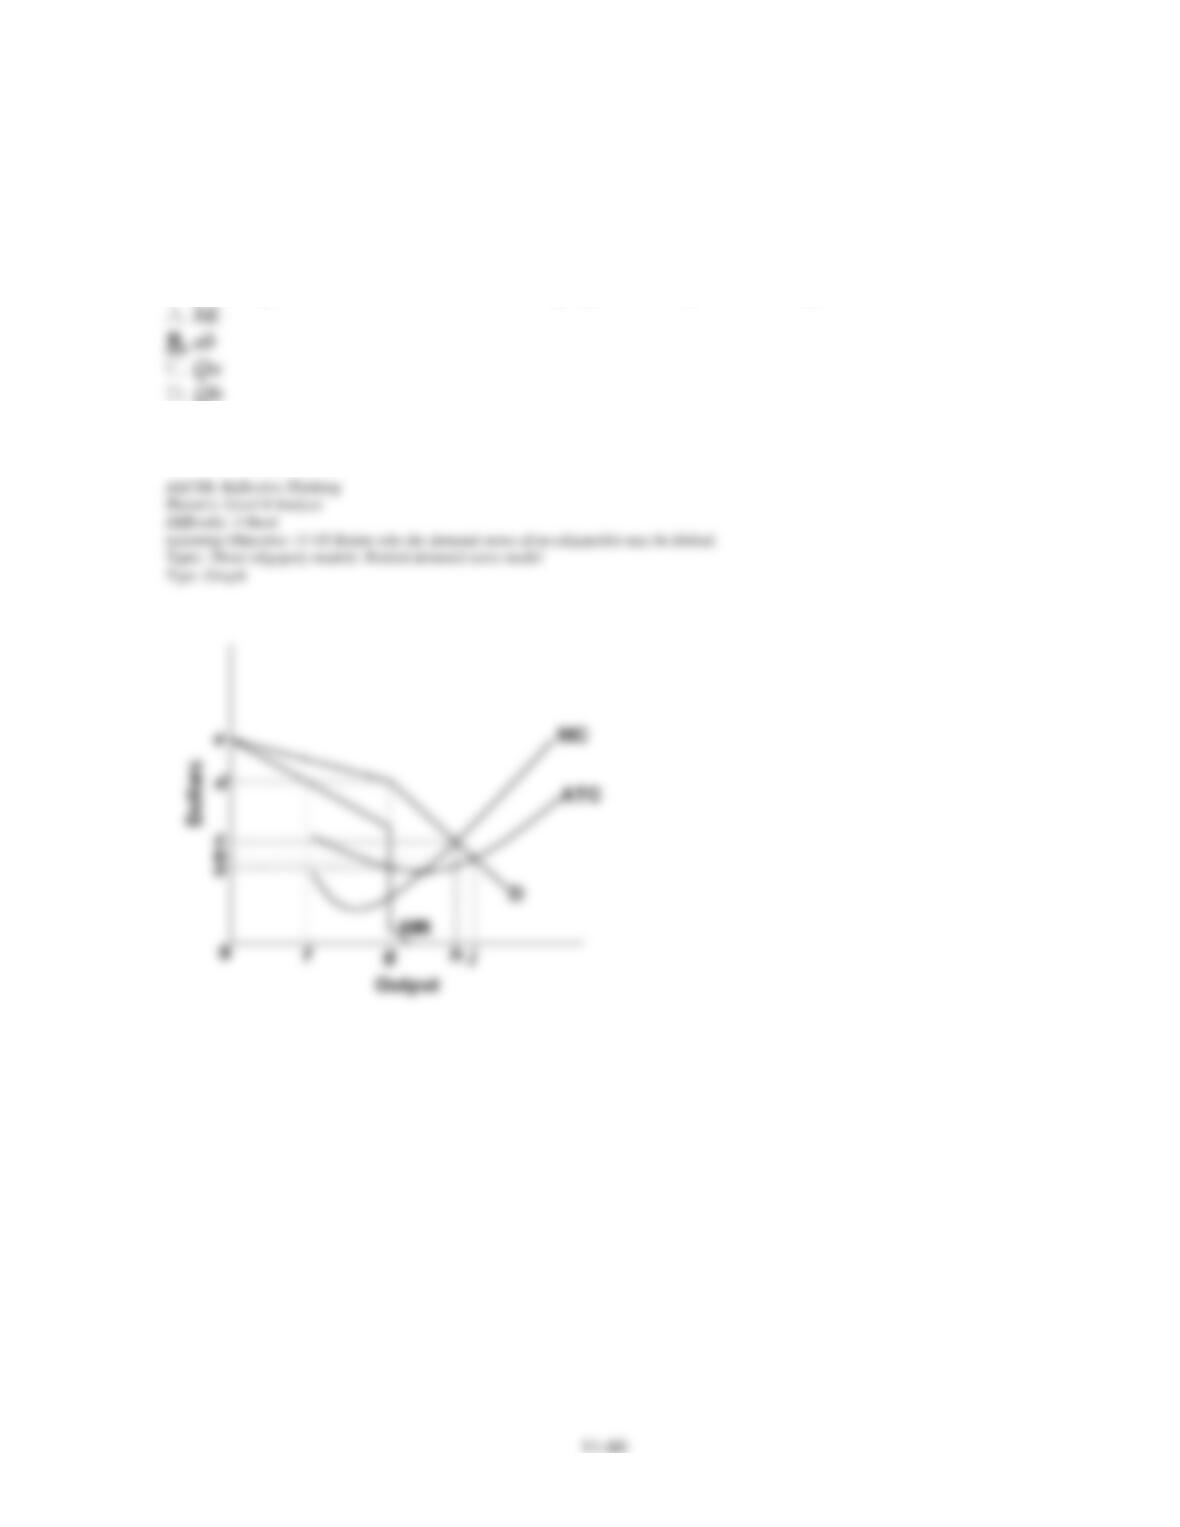
155. Refer to the above diagram for a noncollusive oligopolist. We assume that the firm is
initially in equilibrium at point E where the equilibrium price and quantity are P and Q. If the
firm’s rivals will ignore any price increase but match any price reduction, over what range
might marginal cost rise without disturbing equilibrium price and output?