89) Describe the process of “creative destruction” using a specific example.
90) The owner of a firm wants some advice on how to increase productivity. Suggest three ways the
entrepreneur could increase labor productivity through improving technology.
91) Your friend owns a snow cone stand that he works by himself. He produces about 25 snow cones
per hour. He wants to be able to produce twice as many snow cones per hour so he buys a second
machine. He notices that he can only produce 10 more snow cones an hour. He jokes that he could have
doubled his output with the second machine if he only had four hands. Using your knowledge of the
production process, explain to your friend what you think has happened when he added more capital
to his production process.
92) One of the results of Paul Romer’s new growth theory is that investment in research and
development will be too low in an economy. Explain how he comes to this conclusion.
93) Suggest two policies the government could pursue to help increase the accumulation of knowledge.
43
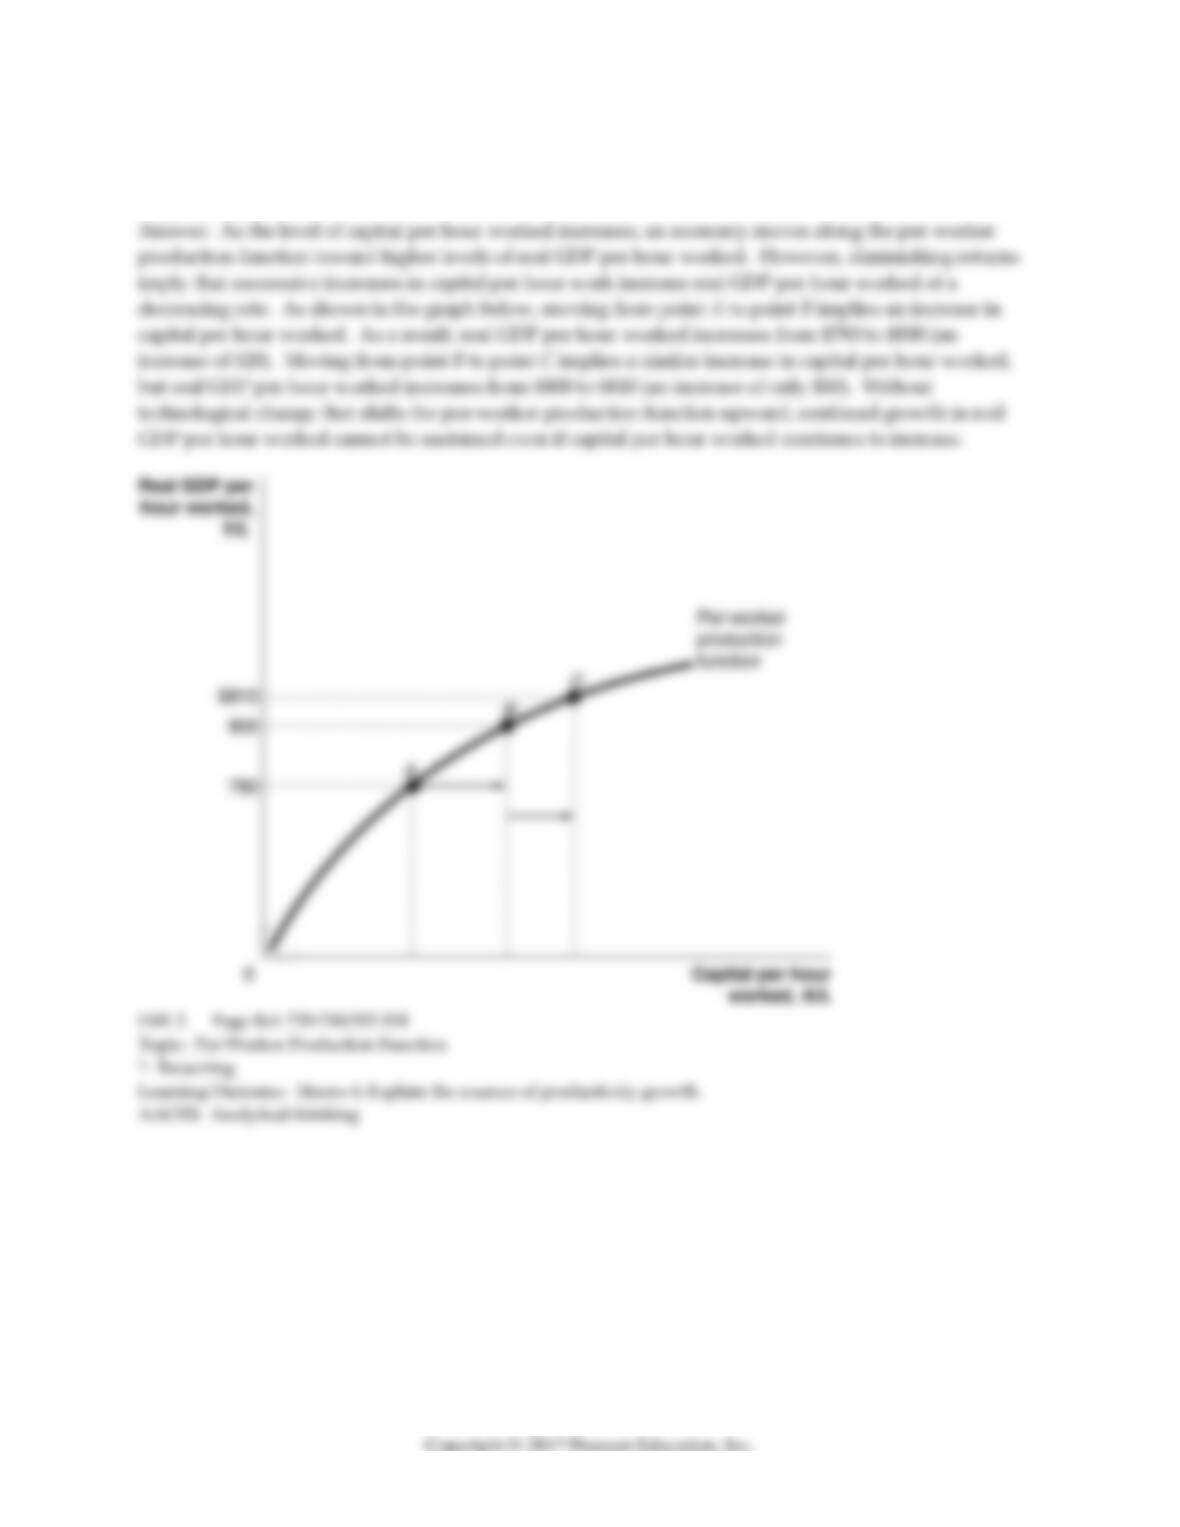
94) Explain how advances in technology are critical to sustaining economic growth, even if capital per
hour worked is consistently increasing. Provide a graph of a per-worker production function to
support your answer.
44
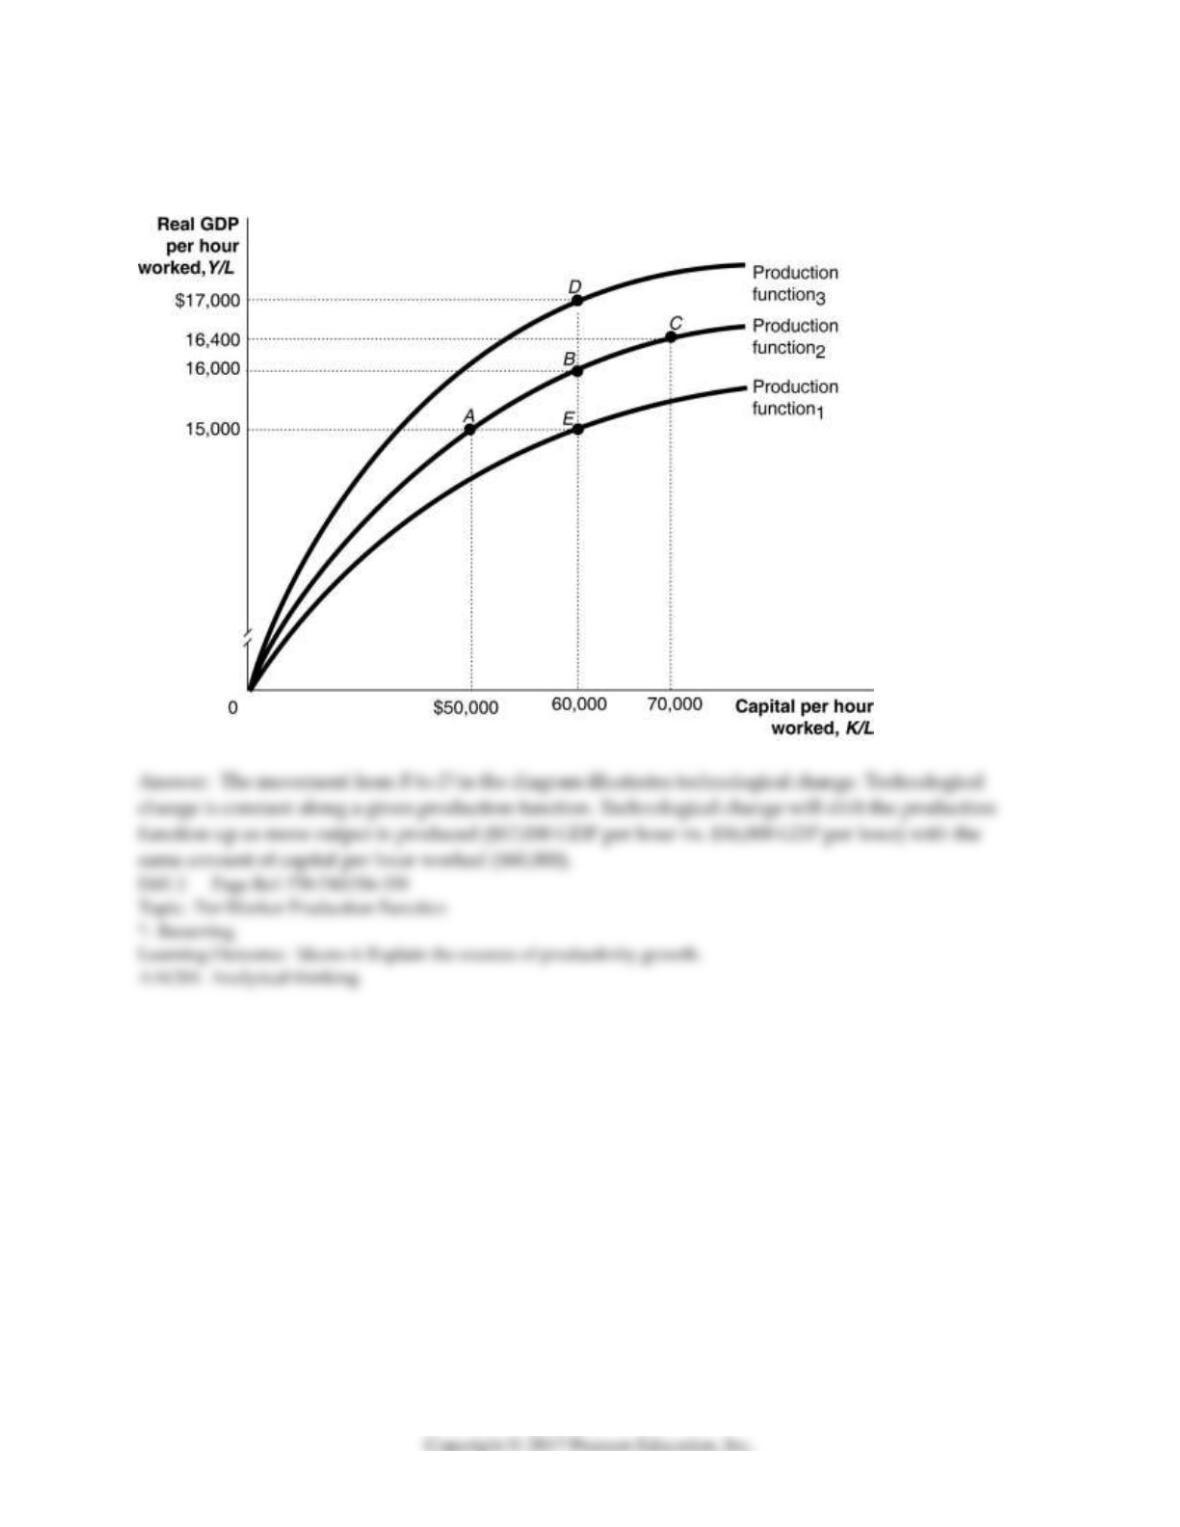
95) Starting at point B in the diagram below, identify which combinations of points illustrate
technological change. Give a brief explanation to support your answer.

45
Table 11-3
Year
Real GDP per Capita
(2009 prices)
Growth Rate in Real
GDP per Capita
2013
$28,000
2014
29,000
2015
30,000
2016
31,000
96) Refer to Table 11-3. Use the table above to calculate the annual growth rate in GDP. Also calculate
the total percentage change in the growth from 2013 through 2016. Explain the difference between the
average annual growth rate in real per capita GDP from 2013 through 2016 and the total percentage
change in growth from 2013 and 2016.
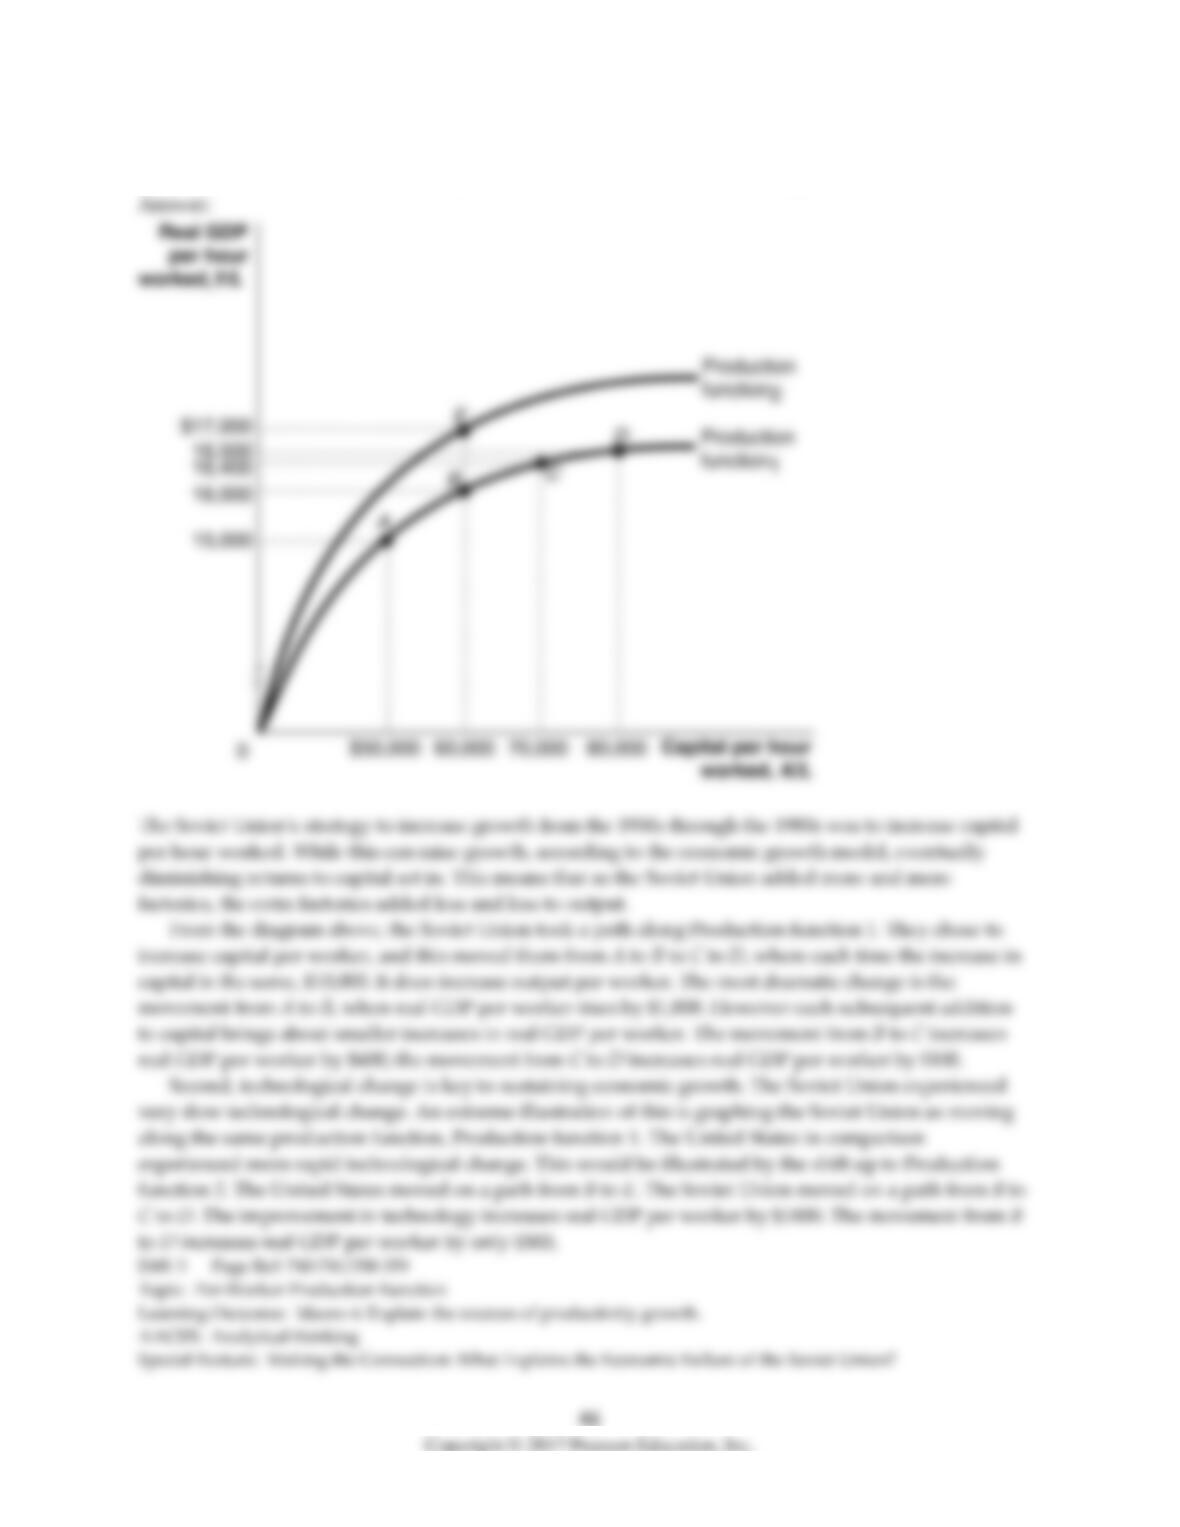
97) Use production functions from the economic growth model to explain why the United States grew
at a much faster rate than the Soviet Union in the latter half of the 20th century.
47
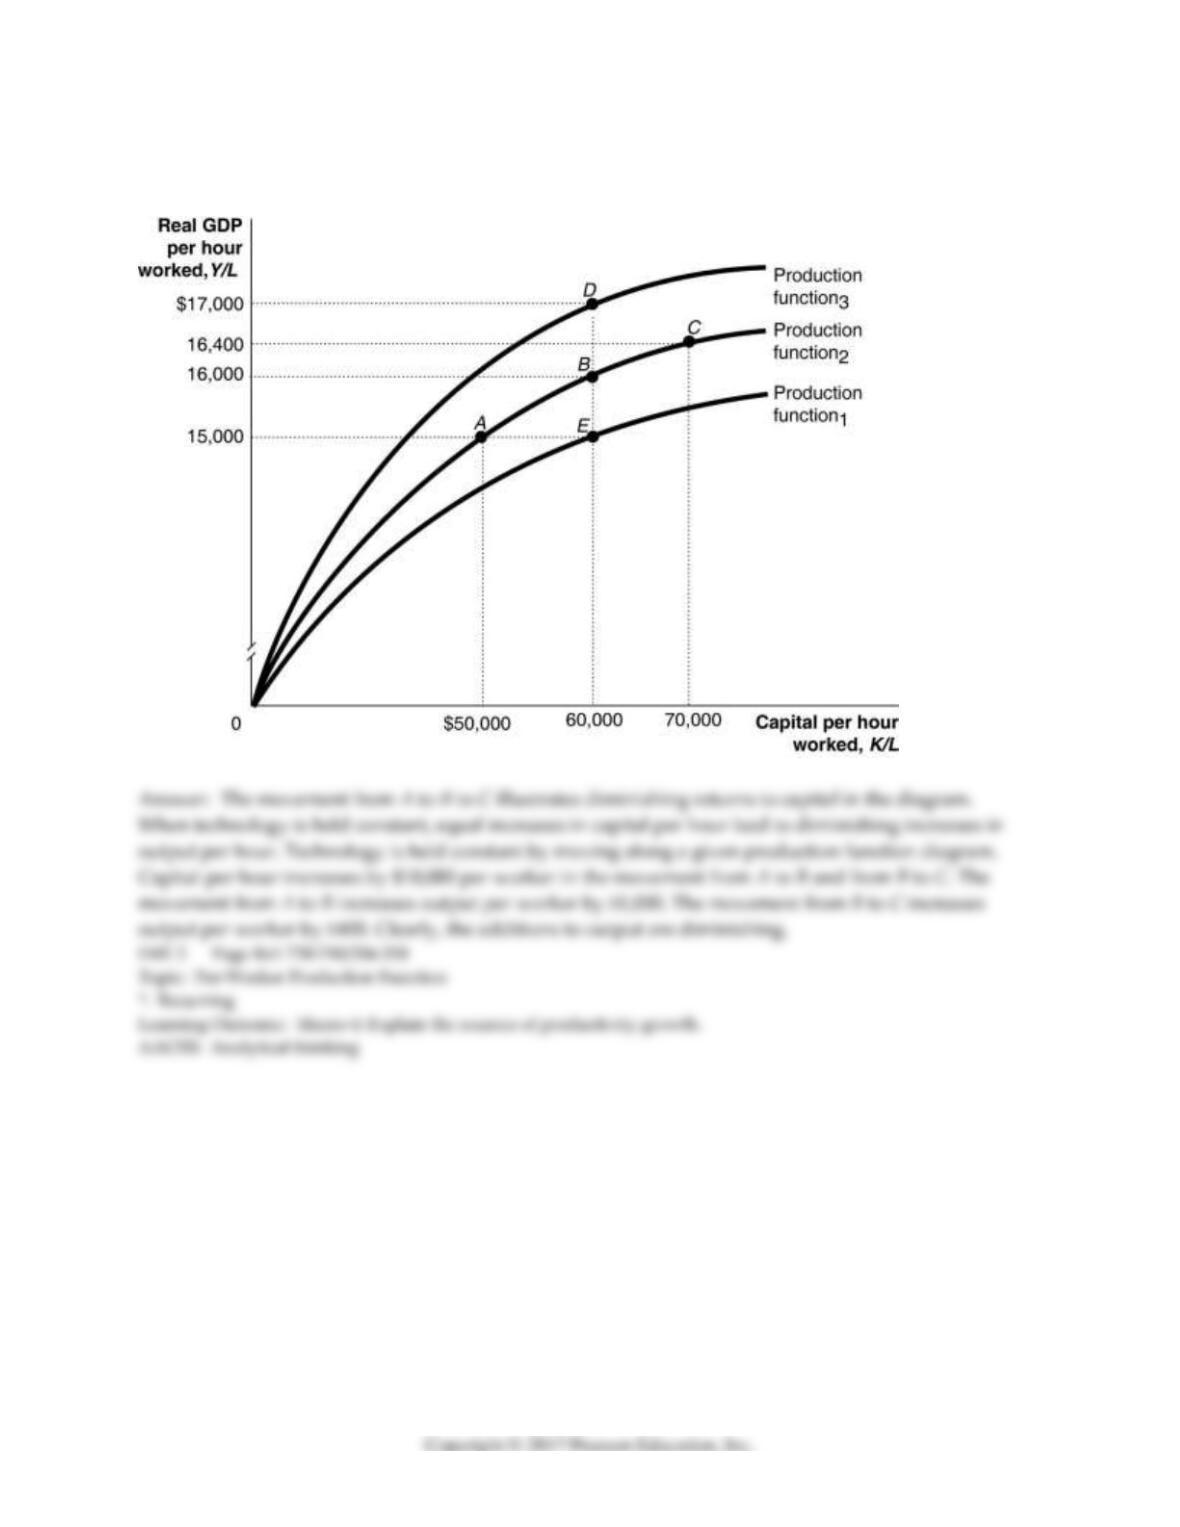
98) Using the points on the diagram below, identify which combinations of these points illustrate
diminishing returns to capital. Give a brief explanation to support your answer.

11.3 Economic Growth in the United States
1) Growth in the United States from 1800 to 1900 can be characterized as
A) positive and increasing.
B) positive and flat.
C) positive and decreasing.
D) negative.
2) Which of the following explains the ability of the U.S. economy to avoid diminishing marginal
returns and experience accelerating growth in the early to mid-20th century?
A) continuing technological change
B) immigration
C) additions of a greater amount of capital of the same quality
D) a decrease in the quality of labor
3) In the United States, the annual growth rate of real GDP per hour worked between 2006 and 2014
averaged
A) -0.3%.
B) 1.2%.
C) 6.9%.
D) 10.2%.
4) Growth in real GDP per hour worked in the United States was slowest during what period of time?
A) 1900-1949
B) 1950-1973
C) 1974-1995
D) 2006-2014

5) The “new economy” that emerged in the mid-1990s is based on
A) manufacturing.
B) financial services.
C) information technology.
D) retail sales.
6) Which of the following advances contributed to the “new economy” of the mid-1990s?
A) the increased use of the Internet in selling products and services
B) expanded cell phone use
C) the lower cost and increased availability of laptop computers
D) all of the above
7) Which of the following accurately describes growth rates in the United States from 1900 to the
present?
A) Growth rates rose until the 1970s and then fell until the present.
B) Growth rates have risen continuously from 1900 to the present.
C) Growth rates rose until the 1970s, slowed until the 1990s, rose again until 2005, and then slowed
again to the present.
D) Growth rates have fallen continuously from 1900 to the present.
8) Because of the productivity slowdown in the United States from the mid-1970s through the mid-
1990s,
A) real GDP per capita grew more rapidly.
B) real GDP per capita grew more slowly.
C) the standard of living did not change.
D) the standard of living increased in the United States.

9) An explanation for the productivity slowdown from 1974 through 1995 is
A) measurement problems.
B) creative destruction.
C) a decline in oil prices.
D) an increase in labor quality.
10) Some economists argue that the productivity slowdown from mid-1970s to mid-1990s actually didn’t
happen, but just “appeared” to happen because
A) exports were becoming a less important part of the economy, and it was hard to measure decreases
in output from exports.
B) new environmental laws had passed and forced firms to spend to reduce pollution, and this
spending did not raise output.
C) increased spending on health and safety raised worker productivity.
D) of the high inflation levels of the 1970s.
11) Economists who believe that real GDP may grow slowly because of insufficient demand for
investment spending cite three main reasons for the low demand for loanable funds. Which of the
following is not one of those reasons?
A) a smaller capital requirement for modern information technology firms
B) the falling price of capital relative to other goods
C) a reduced demand for housing due to slowing population growth
D) the continued decrease in the value of the dollar relative to the currencies of major U.S. trading
partners

12) Which of the following is not an explanation for the revival in the growth of productivity starting in
the mid-1990s?
A) Information and communication innovations are increasingly geared toward improving business
processes and not consumer products.
B) Faster computers have sped up data processing.
C) Internet use has increased the efficiency of how firms buy and sell to each other and to consumers.
D) Cell phones and wireless Internet access have increased worker flexibility.
13) The rate of growth of productivity in the United States was positive during the 20th century.
14) Despite the improvements in information technology, productivity growth since 2006 has fallen to
an even lower rate than during the period of slow growth from the mid-1970s to the mid-1990s.
15) Compared to the previous 20 years, productivity growth in the United States increased between
1996 and 2014.
16) The productivity slowdown experience in the United States from the mid-1970s to the mid-1990s
occurred in all high-income countries.

52
17) Over the last three decades in the United States, services have become a smaller fraction of GDP
relative to goods.
18) Describe the pattern of growth rates in real GDP per hour worked in the United States since the
early nineteenth century. Has output per hour worked consistently increased at the same rate?
Explain.
19) In the United States, the number of hours worked per person has decreased since 1800. How would
growth rates since 1800 be different if they were calculated for real GDP per capita instead of GDP per
hour worked?
11.4 Why Isn’t the Whole World Rich?
1) One of the primary reasons that Mexico has had trouble attracting foreign investment and has
therefore experienced relatively low rates of economic growth is
A) the failure to enforce the rule of law.
B) persistent wars between Mexico and its neighboring countries.
C) poor public education and health.
D) low rates of saving and investment.
2) The economic growth model predicts that
A) the level of real GDP per capita in poor countries will grow faster than in rich countries.
B) the per-worker production function of poor countries will be flatter than the per-worker production
function of rich countries.
C) lower-income industrial countries will forever be unable to catch up to higher-income industrial
countries.
D) economic growth in rich countries can only be accomplished at the expense of slow or even negative
growth in poor countries.
3) Which of the following is a true statement regarding the economic growth model’s predictions and
how it actually affects the real world?
A) The growth model predicts that poor countries should catch up with rich countries, but developing
countries are not catching up to lower-income industrialized countries as a group.
B) The growth model predicts that poor countries will never catch up with rich countries, but lower-
income industrialized countries are catching up to higher-income industrialized countries as a group.
C) The growth model predicts that poor countries will catch up with rich countries, but lower-income
industrialized countries are not catching up to higher-income industrialized countries as a group.
D) The growth model predicts that poor countries will catch up with rich countries, and this is what we
observe across all developmental categories of countries.
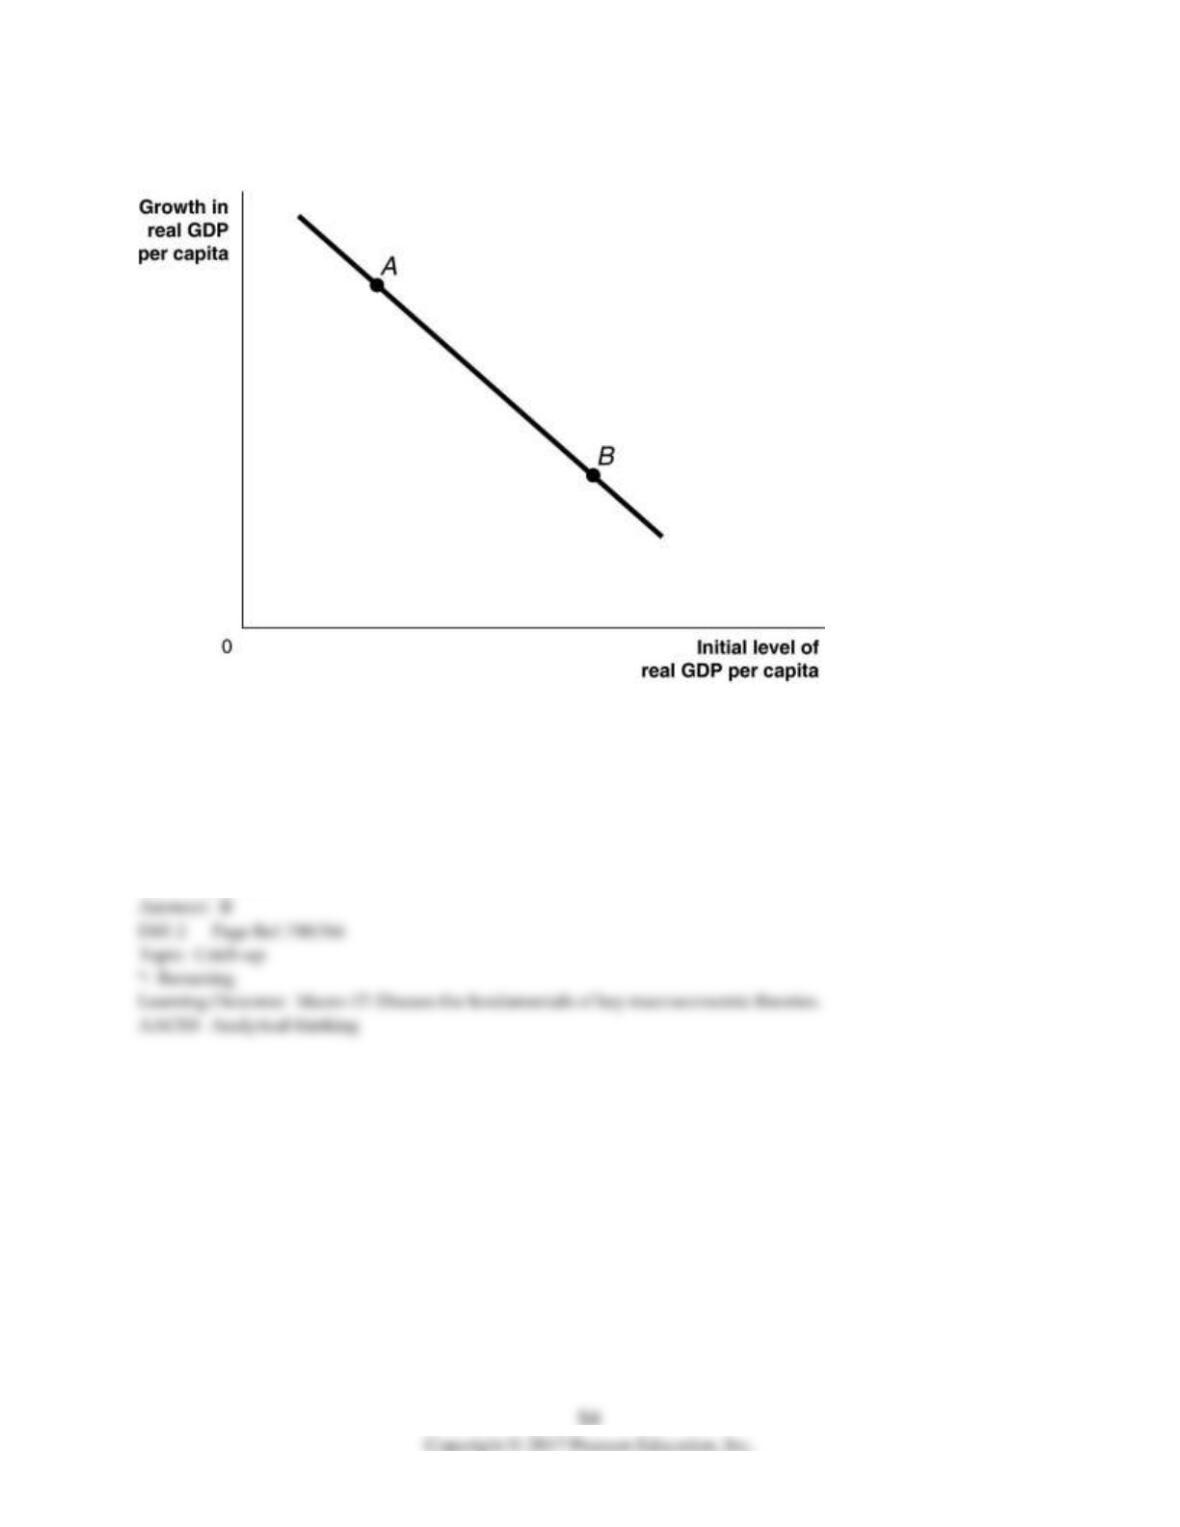
Figure 11-5
4) Refer to Figure 11-5. Based on the “catch-up line” drawn above, poorer countries are more likely to be
at a point like ________, where growth in GDP is relatively ________, while richer countries are more
likely to be at a point like ________, where growth in GDP is relatively ________.
A) A; low; B; high
B) A; high; B; low
C) B; low; A; high
D) B; high; A; low

5) Consider two countries, Alpha and Beta. In Alpha, real GDP per capita is $6,000. In Beta, real GDP
per capita is $9,000. Based on the economic growth model, what would you predict about the growth
rates in real GDP per capita across these two countries?
A) The growth rate of real GDP per capita will be lower in Alpha than it is in Beta.
B) The growth rate of real GDP per capita will be higher in Alpha than it is in Beta.
C) The growth rate of real GDP per capita in Alpha and Beta will be the same.
D) The economic growth model makes no predictions regarding differences in growth rates of real GDP
per capita across the two countries.
6) The industrialized group of countries has growth rates that are consistent with the findings of the
economic growth model. That is, Taiwan, Korea, and Singapore had ________ incomes in 1960 than the
United States and Switzerland, and Taiwan, Korea, and Singapore grew ________ than the United States
and Switzerland between 1960 and 2010.
A) lower; more rapidly
B) greater; less rapidly
C) lower; less rapidly
D) greater; more rapidly
Table 11-4
Country
Real GDP per Capita
(in 1996 dollars)
Growth in Real GDP per
Capita, 1960-2000
Botswana
$958
5.29%
Thailand
1,091
4.70%
Japan
4,544
4.32%
Guatemala
2,344
1.29%
7) Refer to Table 11-4. In the table above, which countries are consistent with the predictions of the
economic growth model?
A) Botswana and Thailand
B) Japan and Guatemala
C) only Japan
D) all four countries

56
8) Which of the following can explain why some countries have not experienced relatively high growth
rates in real GDP per capita despite relatively low initial levels of real GDP per capita?
A) Many of these developing countries do not have a functioning court system that can enforce laws.
B) Countries that are relatively poor are more likely to experience wars and revolutions.
C) Countries that are relatively poor are likely to have a lower quality of health care.
D) all of the above
9) According to the World Bank, Albania does one of the worst jobs as a country enforcing the rule of
law. The consequence of a weak rule of law is
A) difficulty in attracting investment and low economic growth.
B) a decrease in cash transactions and increased efficiency.
C) more risk taking on the part of entrepreneurs and greater economic investment.
D) strong property rights enforcement leading to greater investment.
10) The purchase or building by a corporation of a facility in a foreign country is called
A) foreign direct investment.
B) foreign portfolio investment.
C) foreign capital depreciation.
D) globally-directed investment.

11) The purchase by an individual or firm of stock or bonds issued in another country is called
A) foreign exchange arbitrage.
B) foreign direct investment.
C) foreign portfolio investment.
D) global stock exchange.
12) Developing countries with low saving rates and poor levels of health and education are likely to
experience
A) high levels of foreign direct investment.
B) easy access to financial backing from banks.
C) rapid growth in household incomes.
D) low rates of growth in real GDP per capita.
13) High-income countries have ________ and ________ as compared to developing countries.
A) low rates of savings; high rates of growth
B) low rates of savings; low rates of growth
C) high rates of savings; high rates of growth
D) high rates of savings; low rates of growth

58
14) Globalization refers to
A) the process of establishing a common world currency.
B) the willingness of individuals within a given country to share knowledge with one another.
C) the process of countries becoming more open to foreign trade and investment.
D) the reduction in growth rates of real GDP per capita as a result of trade with foreign countries.
15) Countries that are more globalized tend to have
A) lower levels of real GDP per capita.
B) a higher likelihood of war or revolution.
C) higher growth rates in real GDP per capita.
D) lower levels of foreign direct investment.
16) The growth rate of real GDP per capita in Mexico was negative in which of the following time
periods?
A) 1980-1989
B) 1990-1999
C) 2000-2014
D) all of the above
17) From 1980 to 2014, the average annual growth rate for the Mexican economy has been 0.8 percent.
Based on that growth rate and using the rule of 70, the number of years it will take real GDP per capita
to double in Mexico is approximately
A) 9 years.
B) 11 years.
C) 56 years.
D) 88 years.
18) Foreign direct investment declined worldwide during the recession of 2007-2009. The decline in
foreign direct investment in developing countries can make it more difficult for these countries to break
out of the vicious cycle of low economic growth and
A) overpopulation.
B) low saving and investment.
C) a low import/export ratio.
D) low government spending.
19) Foreign direct investment in the United States declined 42 percent in the first quarter of 2009. This
means that
A) people or firms in other countries reduced their purchases of stocks and bonds in the United States
by 42 percent in the first quarter of 2009.
B) people or firms in the United States reduced their purchases of stocks and bonds in foreign countries
by 42 percent in the first quarter of 2009.
C) people or firms in other countries reduced their building of facilities or purchases of facilities in the
United States by 42 percent in the first quarter of 2009.
D) people or firms in the United States reduced their building of facilities or purchases of facilities in
foreign countries by 42 percent in the first quarter of 2009.

20) Relative to productivity growth in the United States, which of the following countries experienced
the largest decline in productivity growth from 1990 to 2014?
A) Canada
B) Japan
C) Germany
D) the United Kingdom
21) From 1990-2014, productivity growth in the United States was ________ the growth rates of other
high-income countries.
A) greater than
B) less than
C) equal to
D) greater than for the first 15 years, then less than
22) The opportunity cost of being unemployed tends to be the highest in which of the following
countries?
A) Canada
B) the United States
C) France
D) the United Kingdom