Unlock document.
This document is partially blurred.
Unlock all pages and 1 million more documents.
Get Access

Name:
Class:
Date:
Chapter 11: Resource Markets
True / False
1. An increase in the demand for shoemakers will increase the demand for shoes.
a.
True
b.
False
2. An increase in the price of a resource will cause a movement along the demand curve for that resource.
a.
True
b.
False
3. The demand for a resource is derived from the demand for the final product it helps to produce.
a.
True
b.
False
4. An increase in the price of a resource will cause a rightward shift of its supply curve.
a.
True
b.
False
5. The difference in the land prices between Washington, D.C., and Tulsa, Oklahoma, is an example of a permanent
resource price differential.
a.
True
b.
False
6. A resource's earnings are all economic rent when the resource has no alternative uses.
a.
True
b.
False
7. For a firm operating in a perfectly competitive product market, marginal revenue product is measured in dollars per unit
of output.
a.
True
b.
False
8. The marginal revenue product curve slopes downward only if the firm is a price taker in the product market.
a.
True
b.
False
9. The marginal revenue product of labor equals the marginal product of labor times the wage only when the firm is a
price taker in the product market.
Name:
Class:
Date:
Chapter 11: Resource Markets
a.
True
b.
False
10. The marginal revenue product curve represents a firm's demand curve for a resource.
a.
True
b.
False
11. The marginal revenue product for a firm selling in a perfectly competitive product market is obtained by multiplying
the price of the product by the marginal resource cost.
a.
True
b.
False
12. For a resource in a perfectly competitive resource market, marginal revenue product is equal to the price of the
resource.
a.
True
b.
False
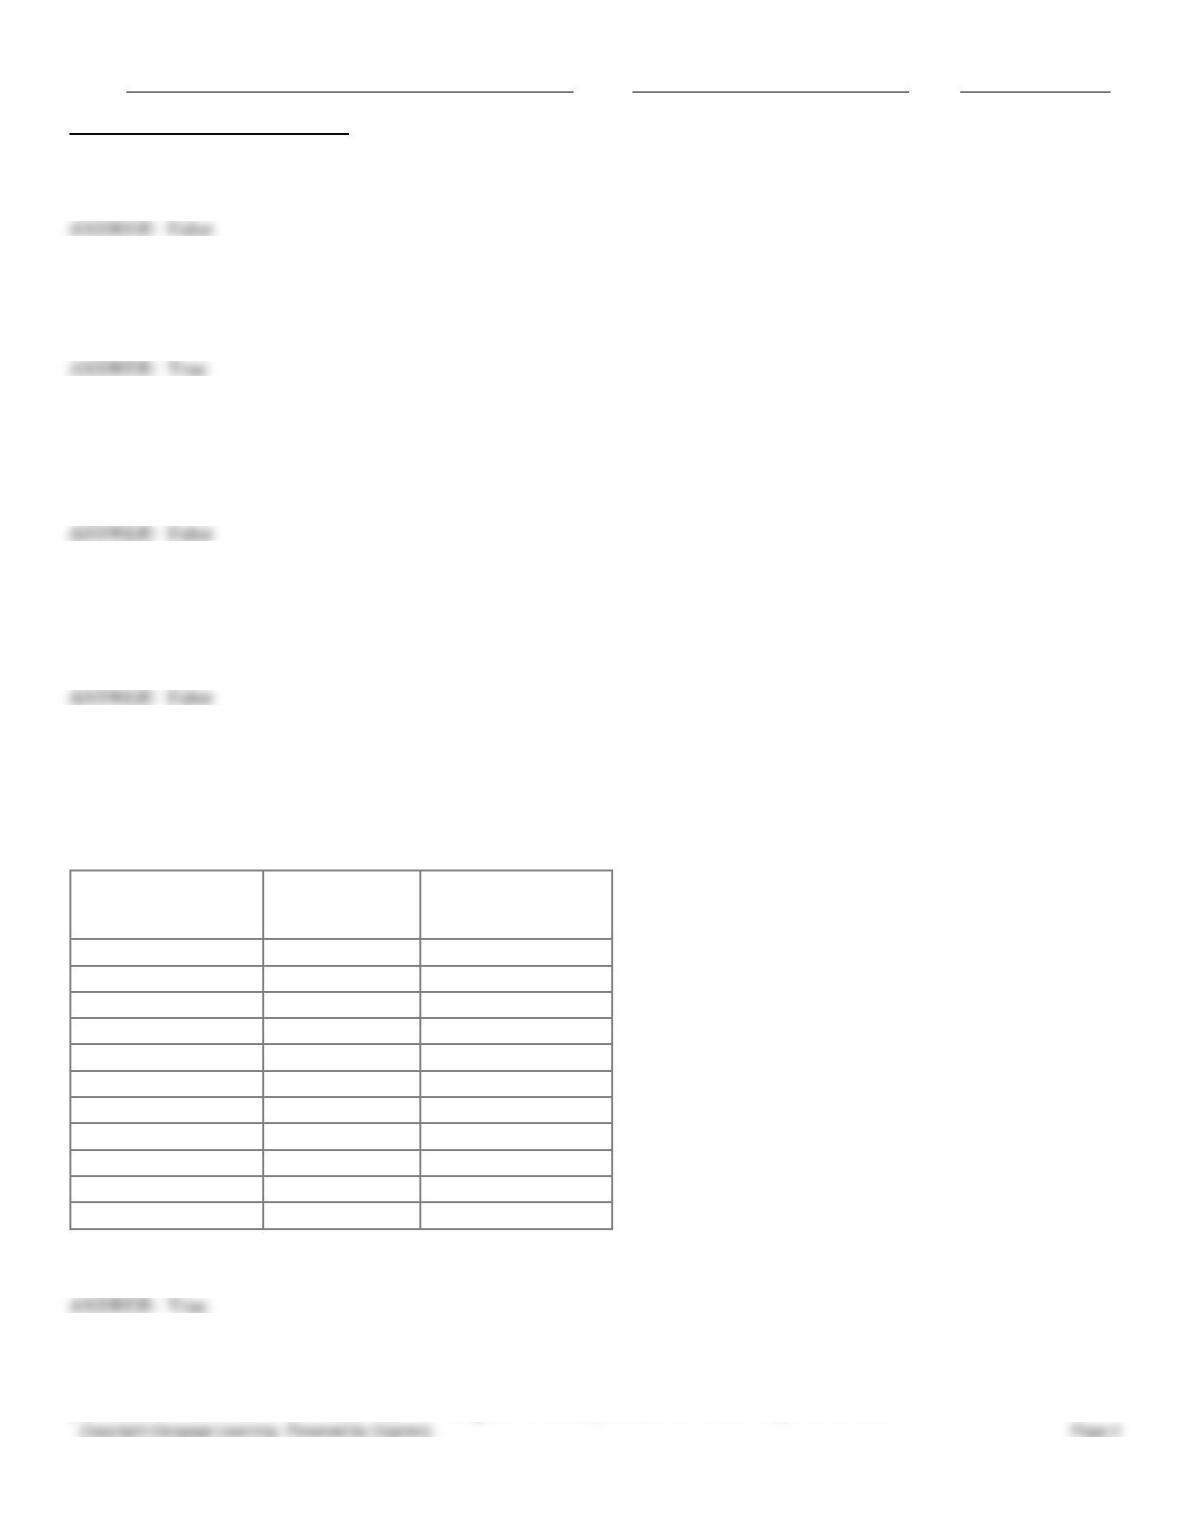
13. The following table shows data for a perfectly competitive firm. The first column shows the number of workers
employed in production, the second column shows the total product of the firm, and the third column shows its product
price. From the table, it can be said that the marginal revenue product begins to decline with the second worker hired.
Table 11.3
Number of Workers
Total
Product
Product
Price ($)
0
0
4.00
1
15
4.00
2
29
4.00
3
42
4.00
4
54
4.00
5
65
4.00
6
75
4.00
7
84
4.00
8
92
4.00
9
99
4.00
10
105
4.00
a.
True
b.
False
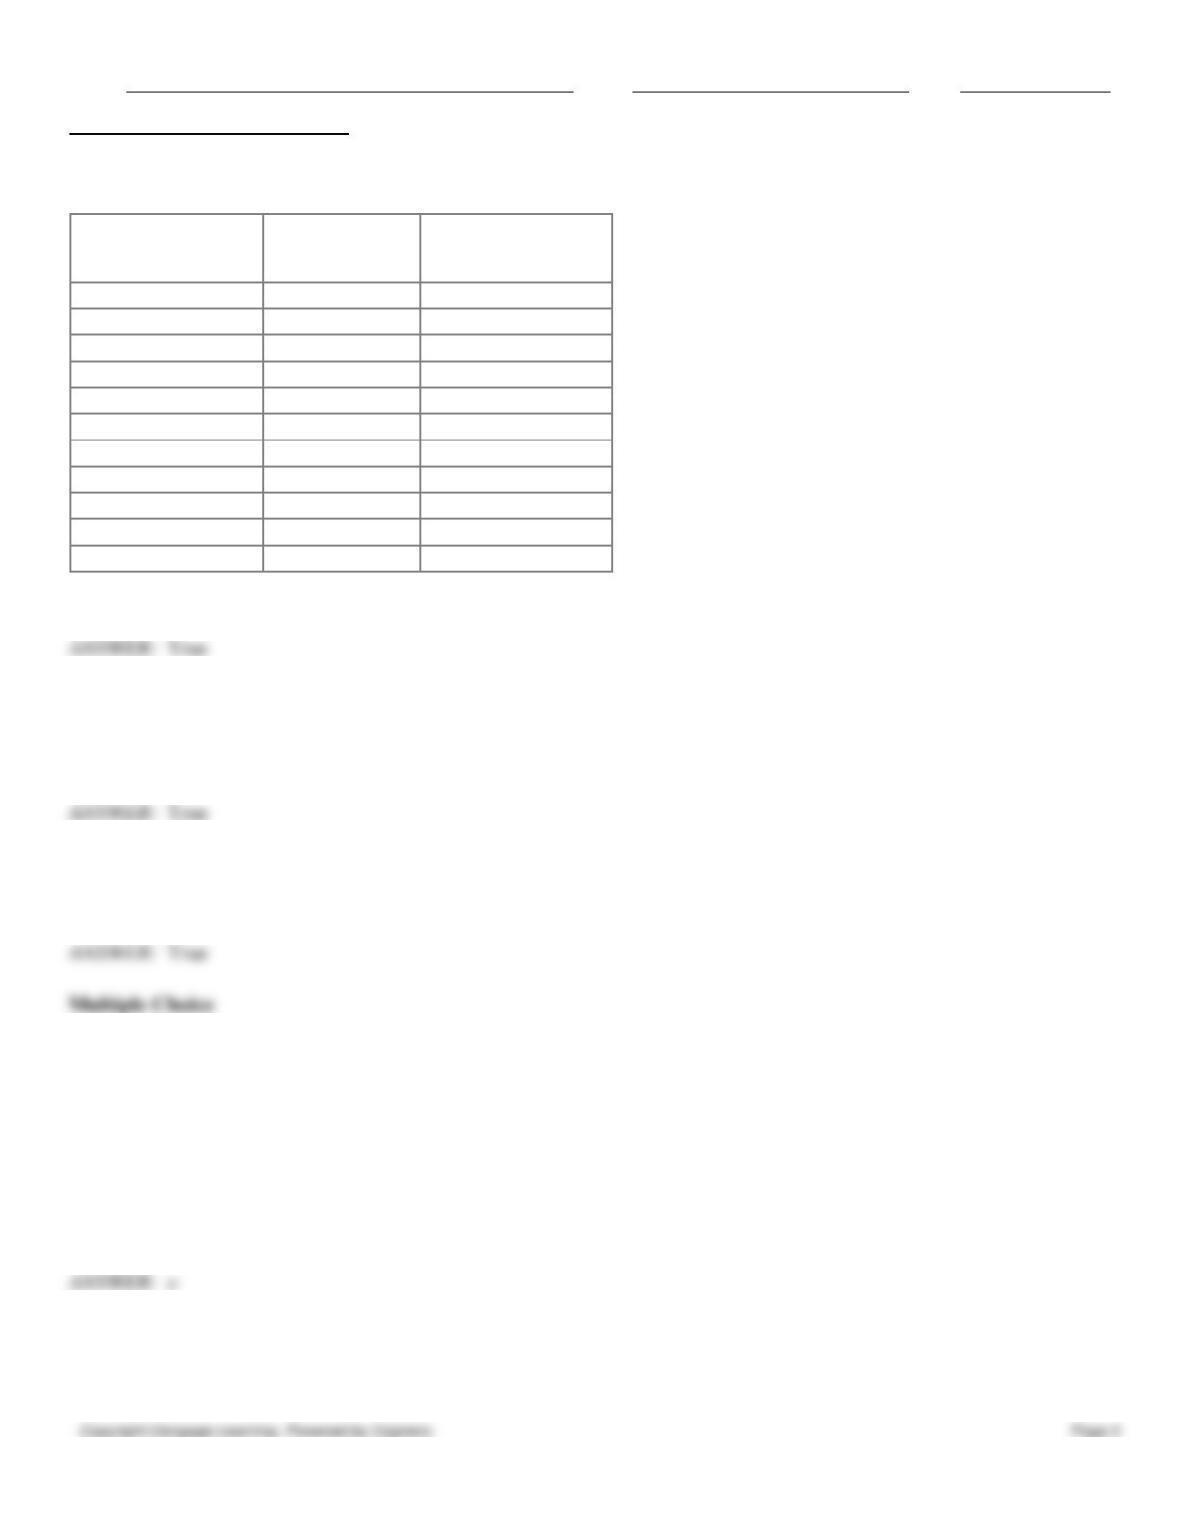
14. The following table shows data for a perfectly competitive firm. The first column shows the number of workers
employed in production, the second column shows the total product of the firm, and the third column shows its product
price. From the table, it can be said that the marginal revenue product curve will slope downward.
Name:
Class:
Date:
Chapter 11: Resource Markets
Table 11.3
Number of Workers
Total
Product
Product
Price ($)
0
0
4.00
1
15
4.00
2
29
4.00
3
42
4.00
4
54
4.00
5
65
4.00
6
75
4.00
7
84
4.00
8
92
4.00
9
99
4.00
10
105
4.00
a.
True
b.
False
15. For a firm in a perfectly competitive product market, the marginal resource cost curve is likely to be horizontal if the
resource market is also competitive.
a.
True
b.
False
16. The marginal resource cost is the additional cost of employing one additional unit of the resource.
a.
True
b.
False
17. An author who writes newspaper columns for $75 each is deciding whether to purchase a personal computer with a
laser printer. She determines that with a computer she would be able to write two more columns per month than she could
on her typewriter. She should:
a.
buy the computer if the monthly payment is less than $300.
b.
buy the computer regardless of its price.
c.
not buy the computer if the monthly payment is greater than $75.
d.
not buy the computer regardless of the price.
e.
buy the computer if the monthly payment is less than $150.
18. Resource owners will supply additional units of a resource as long as:
a.
the marginal utility of the additional units of the resource exceeds their price.
b.
doing so decreases their income taxes.

Name:
Class:
Date:
Chapter 11: Resource Markets
c.
all resource earnings are economic rent.
d.
resource users demand the resource.
e.
doing so increases their utility.
19. The resource market is different from the product market because:
a.
firms don't maximize profit in the resource market.
b.
households don't maximize utility in the resource market.
c.
firms are demanders and households are suppliers in the resource market.
d.
supply and demand do not apply in the resource market.
e.
supply and demand do not apply in the product market.
20. As the price of a resource decreases, _____.
a.
the demand for the final product produced by the resource increases
b.
the quantity demanded of that resource decreases
c.
the supply of that resource increases
d.
producers are more willing and able to hire that resource
e.
producers are less willing and able to hire that resource
21. Along the demand curve for a resource, _____.
a.
the prices of other resources are assumed constant
b.
the marginal product of that resource remains constant
c.
the total cost of production is assumed constant
d.
the price of that particular resource is assumed constant
e.
the quantity of that particular resource is assumed constant
22. As the price of land falls, the relative price of land:
a.
increases because the prices of other land that could produce the same output have also decreased.
b.
decreases because the prices of other land that could produce the same output have also decreased.
c.
increases because the prices of other land that could produce the same output have increased.
d.
decreases because the prices of other land that could produce the same output are held constant.
e.
remains constant because the prices of other land that could produce the same output also increase.
23. Derived demand refers to:
a.
demand curve derived from utility functions.
b.
an individual demand curve derived from a market demand curve.
c.
a market demand curve derived from individual demand curves.
d.
the demand for a resource derived from the demand for the product produced by that resource.
e.
the demand for a product derived from the demand for the resource used to make that product.

Name:
Class:
Date:
Chapter 11: Resource Markets
24. If the price of a resource falls, other things constant, the _____.
a.
demand for the final product produced by the resource will increase
b.
demand for a substitute product will increase
c.
demand for a substitute resource will fall
d.
supply of that resource will rise
e.
supply of a substitute resource will also rise
25. Which of the following is not an example of derived demand?
a.
Increased interest in gardening during the spring leading to an increase in the demand for hoes and shovels
b.
Strong ticket sales for a concert causing the producers to schedule an extra show and demand more ushers
c.
Increased use of robots leading to a decrease in the demand for labor
d.
The development of alternative fuels made from corn leading to an increase in the demand for corn
e.
Increasing demand for music leading to the construction of more recording studios
26. In the resource market, the demand for labor is a(n) _____.
a.
substitution demand
b.
complementary demand
c.
income demand
d.
derived demand
e.
marginal demand
27. The market demand curve for a resource is the:
a.
horizontal sum of the demand curves for that resource in all its various uses.
b.
demand curve for the goods produced by that resource.
c.
demand for that resource in its best use.
d.
sum of the demand curves for that resource in its best two uses.
e.
vertical sum of the demand curve for that resource in all its various uses.
28. the demand for corn decreasesCorn is a major ingredient in tacos. If the demand for tacos increases, _____.
a.
the supply of corn increases
b.
the supply of corn decreases
c.
the demand for corn increases
d.
the demand for corn decreases
e.
the price of corn falls
29. Both sugar and fructose can be used in the production of candy. If the price of sugar increases, _____.
a.
the demand for sugar increases as the relative price of sugar decreases

Name:
Class:
Date:
Chapter 11: Resource Markets
b.
sugar becomes relatively more expensive than fructose only if the price of fructose falls
c.
sugar becomes relatively more expensive than fructose, other things constant
d.
the price of fructose immediately increases
e.
the price of fructose immediately decreases
30. Which of the following is not an example of derived demand?
a.
As more high school graduates go on to college, more professors are hired.
b.
As consumers buy more computers, they demand more powerful computers.
c.
As people let their hair grow longer, fewer people become barbers.
d.
As people buy more tennis shoes instead of sandals, they buy more shoe laces.
e.
Increased demand for overnight delivery speeds up orders for new delivery trucks.
31. Which of the following is an example of derived demand?
a.
As income rises, the demand for TVs rises.
b.
As the price of digital cameras decreases, the demand for camera lenses increases.
c.
If the demand for tires decreases, the demand for rubber also decreases.
d.
When the price of gasoline rises, the demand for automobile repair falls.
e.
If consumers expect the price of coffee to rise, the demand for coffee rises.
32. A firm's demand for a resource is a(n):
a.
final demand.
b.
derived demand.
c.
secondary demand.
d.
induced demand.
e.
marginal demand.
33. As the price of a resource increases, _____.
a.
the supply of that resource increases in the resource market
b.
the supply of that resource decreases in the resource market
c.
resources shift from lower-paid uses to higher-paid uses
d.
resources shift from higher-paid uses to lower-paid uses
e.
the demand for the final product decreases
34. Along the downward-sloping demand curve of lifeguards at local public pools, _____.
a.
the wage paid to lifeguards is held constant
b.
the number of lifeguards is held constant
c.
the wage paid to lifeguards at private clubs is held constant
d.
the admission price to these public pools decreases as the wage rate for lifeguards increases

Name:
Class:
Date:
Chapter 11: Resource Markets
e.
the admission price to these public pools rises as the wage rate for lifeguards increases
35. The market supply curve of a resource is:
a.
downward sloping.
b.
upward sloping.
c.
horizontal at the market price.
d.
vertical.
e.
determined by firms.
36. The market supply curve of labor is:
a.
upward sloping.
b.
perfectly inelastic.
c.
U-shaped.
d.
downward sloping.
e.
perfectly elastic.
37. The market supply curve of capital is:
a.
upward sloping.
b.
perfectly inelastic.
c.
U-shaped.
d.
downward sloping.
e.
perfectly elastic.
38. Other things constant, similar resources in alternative uses will be paid:
a.
different amounts based on their different uses.
b.
different amounts based on the alternative uses.
c.
different amounts if resources are mobile.
d.
similar amounts if resources are not mobile.
e.
similar amounts if resources are mobile.
39. Suppose the wage for drive through clerks is $7 an hour at Jason Burger and $6.50 at Martha’s. The jobs are alike in
all other aspects. We would expect:
a.
an increase in the supply of and demand for drive through clerks at Jason Burger.
b.
an increase in the supply and a decrease in the demand for drive through clerks at Jason Burger.
c.
a decrease in the supply of drive through clerks at Jason Burger but no change in demand.
d.
an increase in the supply of drive through clerks at Jason Burger but no change in demand.
e.
a decrease in the supply of and demand for drive through clerks at Jason Burger.

Name:
Class:
Date:
Chapter 11: Resource Markets
40. A temporary resource price differential is a price difference:
a.
caused by the inherent quality of that resource.
b.
caused by the lack of resource mobility.
c.
caused by differences in the time and money involved in developing the necessary job skills.
d.
that causes more workers to move to higher-paid areas.
e.
caused by minimum wage legislation.
41. Resource price differentials that trigger the reallocation of resources to equalize payments for similar resources are
known as:
a.
permanent resource price differentials.
b.
reallocation differentials.
c.
compensatory resource price differentials.
d.
sustainable resource price differentials.
e.
temporary resource price differentials.
42. When resource markets are free to adjust, temporary resource price differentials will cause:
a.
the equalization of payments for similar resources in different uses.
b.
the allocation of fewer resources to higher-paid uses.
c.
a change in the supply of resources.
d.
no change in the allocation of resources.
e.
price differentials of the final product using the resource.
43. Which of the following is an example of a permanent resource price differential?
a.
When the price of oil increases, oil exploration increases.
b.
When the price of CDs falls, CD production decreases.
c.
When the demand for land in a growing city increases, its price increases more than the prices of land in
declining cities.
d.
When demand for computer programmers increased, more people went into that field.
e.
When the price of oil rose, demand for solar panels increased.
44. Resource price differentials that do not trigger the reallocation of resources are known as:
a.
temporary resource price differentials.
b.
market resource price differentials.
c.
conditional resource price differentials.
d.
permanent resource price differentials.
e.
selective resource price differentials.
45. Permanent differentials in resource prices will cause:
a.
a change in the supply of resources.

Name:
Class:
Date:
Chapter 11: Resource Markets
b.
the allocation of fewer resources to lower-paid uses.
c.
the equalization of payments for the same resource in different uses.
d.
no change in the allocation of resources.
e.
the allocation of more resources to higher-paid uses.
46. Which of the following can lead to temporary differentials in resource prices?
a.
An increase in demand for a product produced by the resource
b.
Differences in the inherent qualities of resources
c.
Differences in the time and money involved in developing necessary skills
d.
Differences in the nonmonetary rewards of a job
e.
Differences in the prices of similar resources
47. The difference between the average earnings of eye surgeons and those of janitors is:
a.
an example of a temporary differential caused by a lack of resource mobility.
b.
an example of a permanent differential caused by differences in the time and money involved in developing
the necessary skills.
c.
an example of a permanent differential caused by differences in nonmonetary aspects of the job.
d.
a temporary difference that will be eliminated through the reallocation of resources to different uses.
e.
an example of a permanent differential caused by a difference in the inherent quality of the resource.
48. The price differences of fertile land and scrubland can be explained by the differences in:
a.
the demand for land.
b.
the uses of the land.
c.
their inherent qualities.
d.
the efficiency of the real estate brokers engaged with buying and selling of the land.
e.
the income of the citizens.
49. A relaxation of U.S. immigration laws and regulations would:
a.
reduce the wages of workers in poor countries.
b.
turn some permanent resource differentials into temporary ones.
c.
increase the demand for labor in the United States.
d.
reduce the wages of U.S. workers.
e.
increase the supply of labor in poor countries.
50. A guarded barbed wire fence separates East and West Bovinia. Soccer players are paid twice as much in West Bovinia
than in East Bovinia. This is an example of _____.
a.
an inelastic supply of labor
b.
a temporary resource price differential
c.
a permanent resource price differential

Name:
Class:
Date:
Chapter 11: Resource Markets
d.
diminishing marginal revenue product
e.
increasing marginal revenue product
51. A temporary price differential in resource markets is:
a.
caused by inherent differences in nonmonetary aspects of a job.
b.
caused by a failure of firms to maximize profits.
c.
eliminated by resources moving from lower-valued to higher-valued uses.
d.
caused by governments increasing the minimum wages of workers.
e.
eliminated when resources earn an excess of their opportunity costs.
52. The greater the economic rent as a proportion of total earnings, _____.
a.
the less elastic the resource supply
b.
the more elastic the resource demand
c.
the more elastic the resource supply
d.
the less elastic the resource demand
e.
the more elastic the firm’s supply of its final product
53. If the supply of beach houses is fixed and perfectly inelastic, _____.
a.
the demand for the beach houses determines their price and the level of economic rent
b.
the supply of the beach houses determines their price and the level of economic rent
c.
the supply of the beach houses determines their price and the demand for the beach houses determines the
level of economic rent
d.
the demand for the beach houses determines their price and the supply of the beach houses determines the
level of economic rent
e.
the supply curve for beach houses is horizontal
54. Which of the following is an example of a temporary price differential in a resource market?
a.
Land downtown being more expensive than land in the suburbs
b.
A famous professional basketball player being paid more than the average professional basketball player
c.
Cable television installers having a higher wage than telephone installers
d.
An airline pilot being paid more than a flight attendant
e.
A worker in a toxic waste plant earning more than a teacher
55. If all returns to a resource are in the form of economic rent, _____.
a.
the demand curve for that resource is horizontal
b.
the demand curve for that resource is vertical
c.
the supply curve of that resource is horizontal
d.
the supply curve of that resource is vertical
e.
the demand curve for that resource is upward sloping

Name:
Class:
Date:
Chapter 11: Resource Markets
56. If all returns to a resource are in the form of economic rent, _____.
a.
the price of that resource is determined exclusively by supply
b.
the price of that resource is determined exclusively by demand
c.
the equilibrium quantity of that resource is zero
d.
the equilibrium price of that resource is determined by government
e.
the equilibrium price of that resource is zero
57. If all of a resource’s earnings reflect the opportunity costs of the resource, _____.
a.
the equilibrium price and quantity of that resource are determined by the intersection of the demand and
supply curves in the product market
b.
the equilibrium price of that resource is zero
c.
the quantity of that resource is determined exclusively by supply
d.
the price of that resource is determined exclusively by demand
e.
the quantity of that resource is determined exclusively by demand
58. Gooey Flakes is the only ready-to-eat cereal that has chocolate syrup in each flake. The machine that injects the syrup
into the flakes has no alternative uses. Which of the following is true?
a.
All of the machine's earnings are economic rent.
b.
All of the machine's earnings are opportunity cost.
c.
The supply curve for this machine is horizontal.
d.
The demand curve for this machine is horizontal.
e.
The demand curve for this machine is vertical.
59. Consider two resource markets, A and B, where the demand curves for the resources slope downward. The supply
curve of resource A is horizontal, and the supply curve of resource B is vertical. In market A, the equilibrium price is $6
and the equilibrium quantity is 100 units. In market B, the equilibrium price is $20 and the equilibrium quantity is 30
units. Which of the following is true?
a.
Total resource earnings are the same in both markets.
b.
Total resource earnings are greater in market A.
c.
Total resource earnings are greater in market B.
d.
All earnings from resource A are economic rent.
e.
All earnings from resource B are its opportunity costs.
60. Consider two resource markets, A and B, where the demand curves for the resources slope downward. The supply
curve of resource A is horizontal, and the supply curve of resource B is vertical. In market A, the equilibrium price is $6,
and the equilibrium quantity is 100 units. In market B, the equilibrium price is $20, and the equilibrium quantity is 30
units. Which of the following is true?
a.
All of the resource earnings in market A are opportunity costs.
b.
All of the resource earnings in both markets are opportunity costs.
Name:
Class:
Date:
Chapter 11: Resource Markets
c.
All of the resource earnings in market B are opportunity costs.
d.
None of the resource earnings in either market are an opportunity cost.
e.
None of the resource earnings in either market are economic rent.
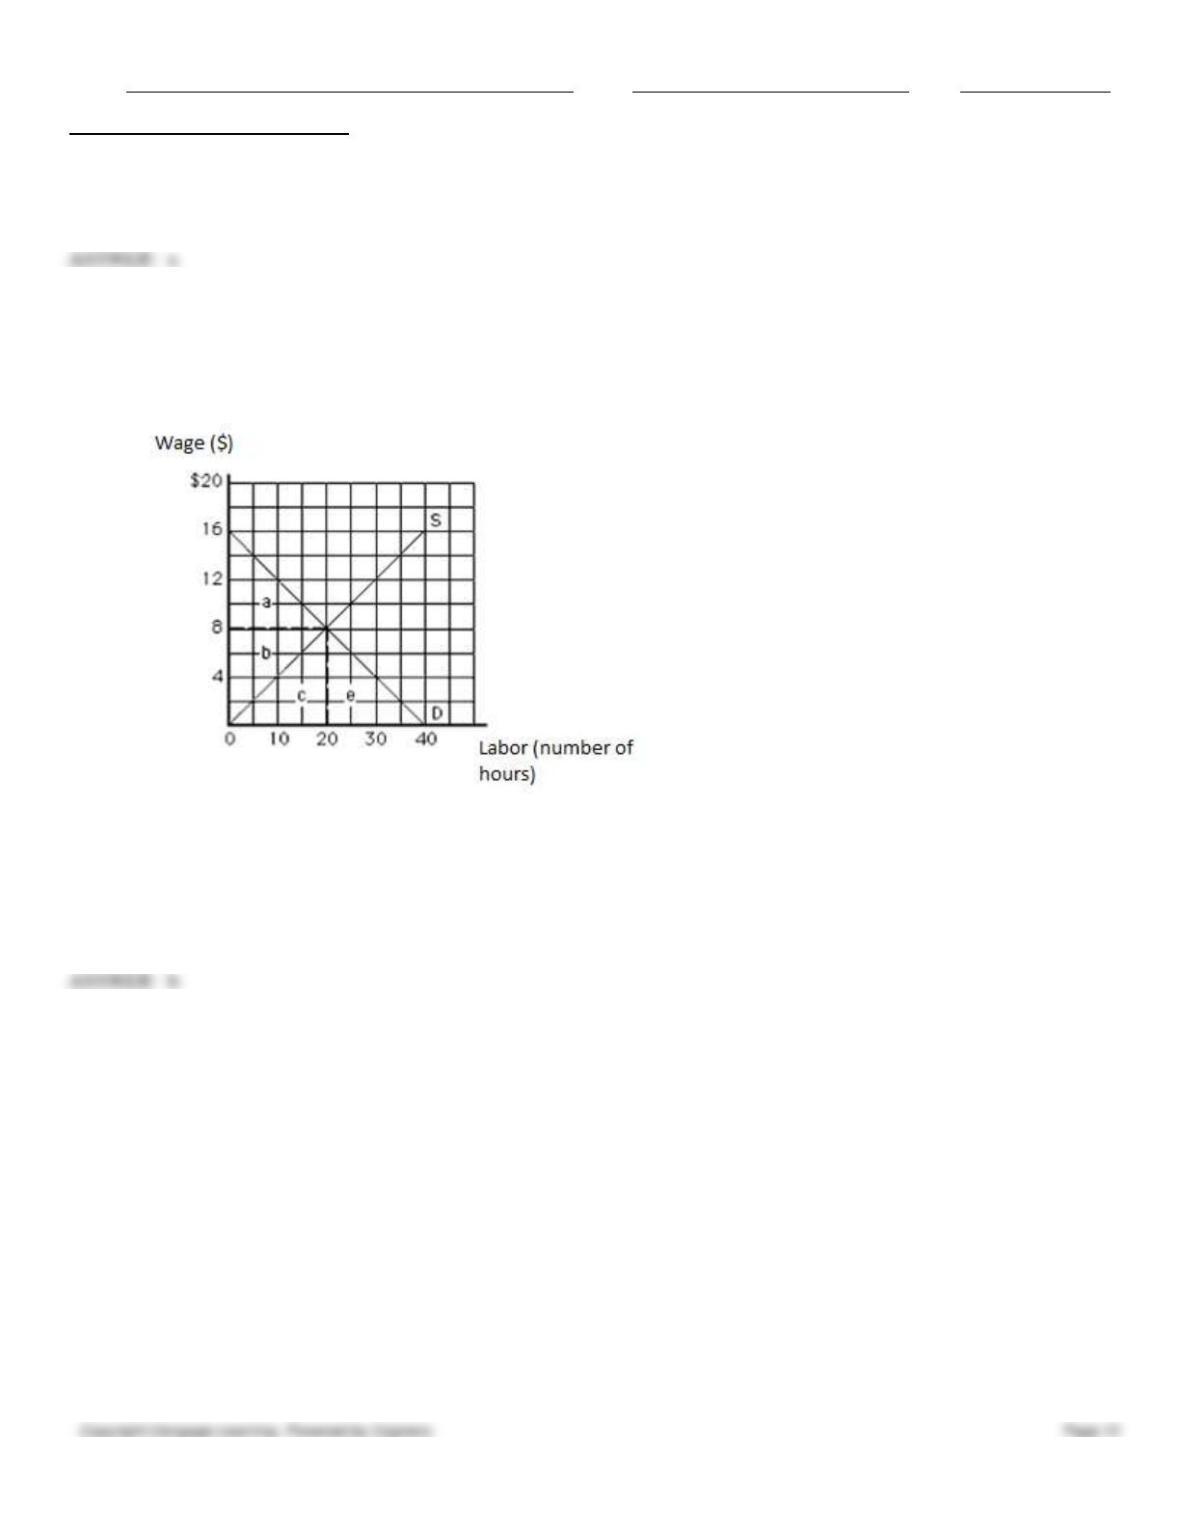
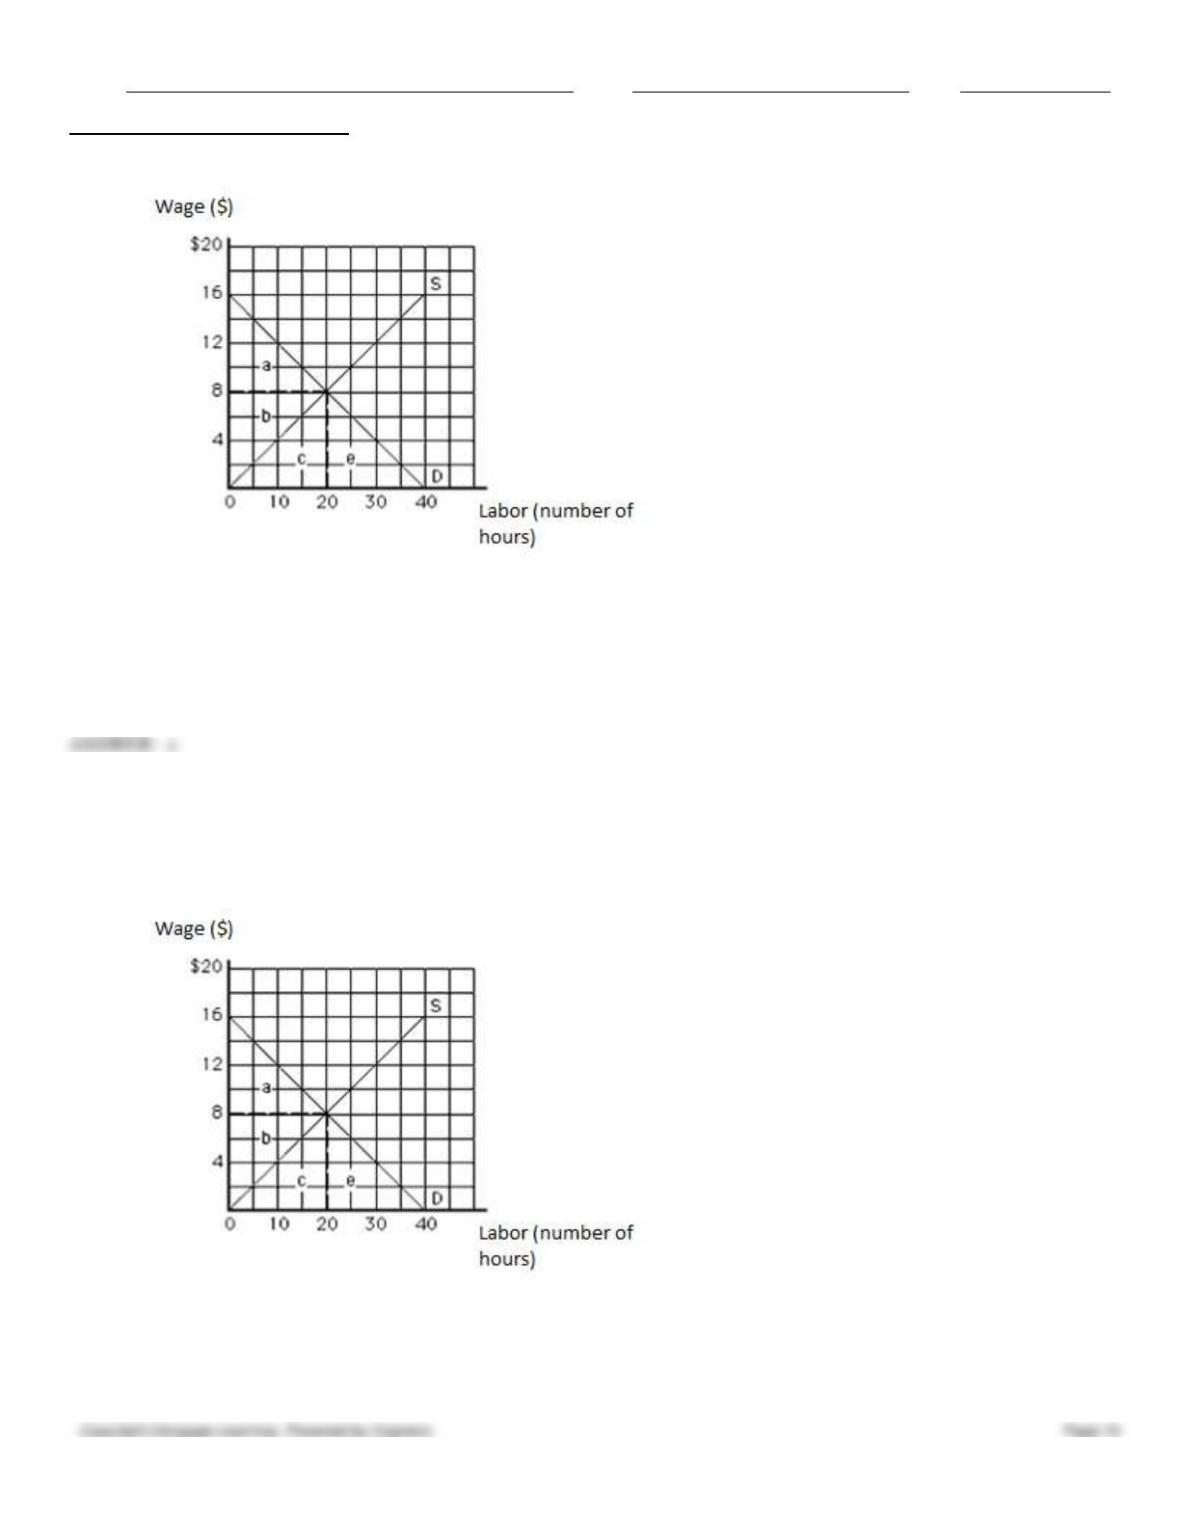
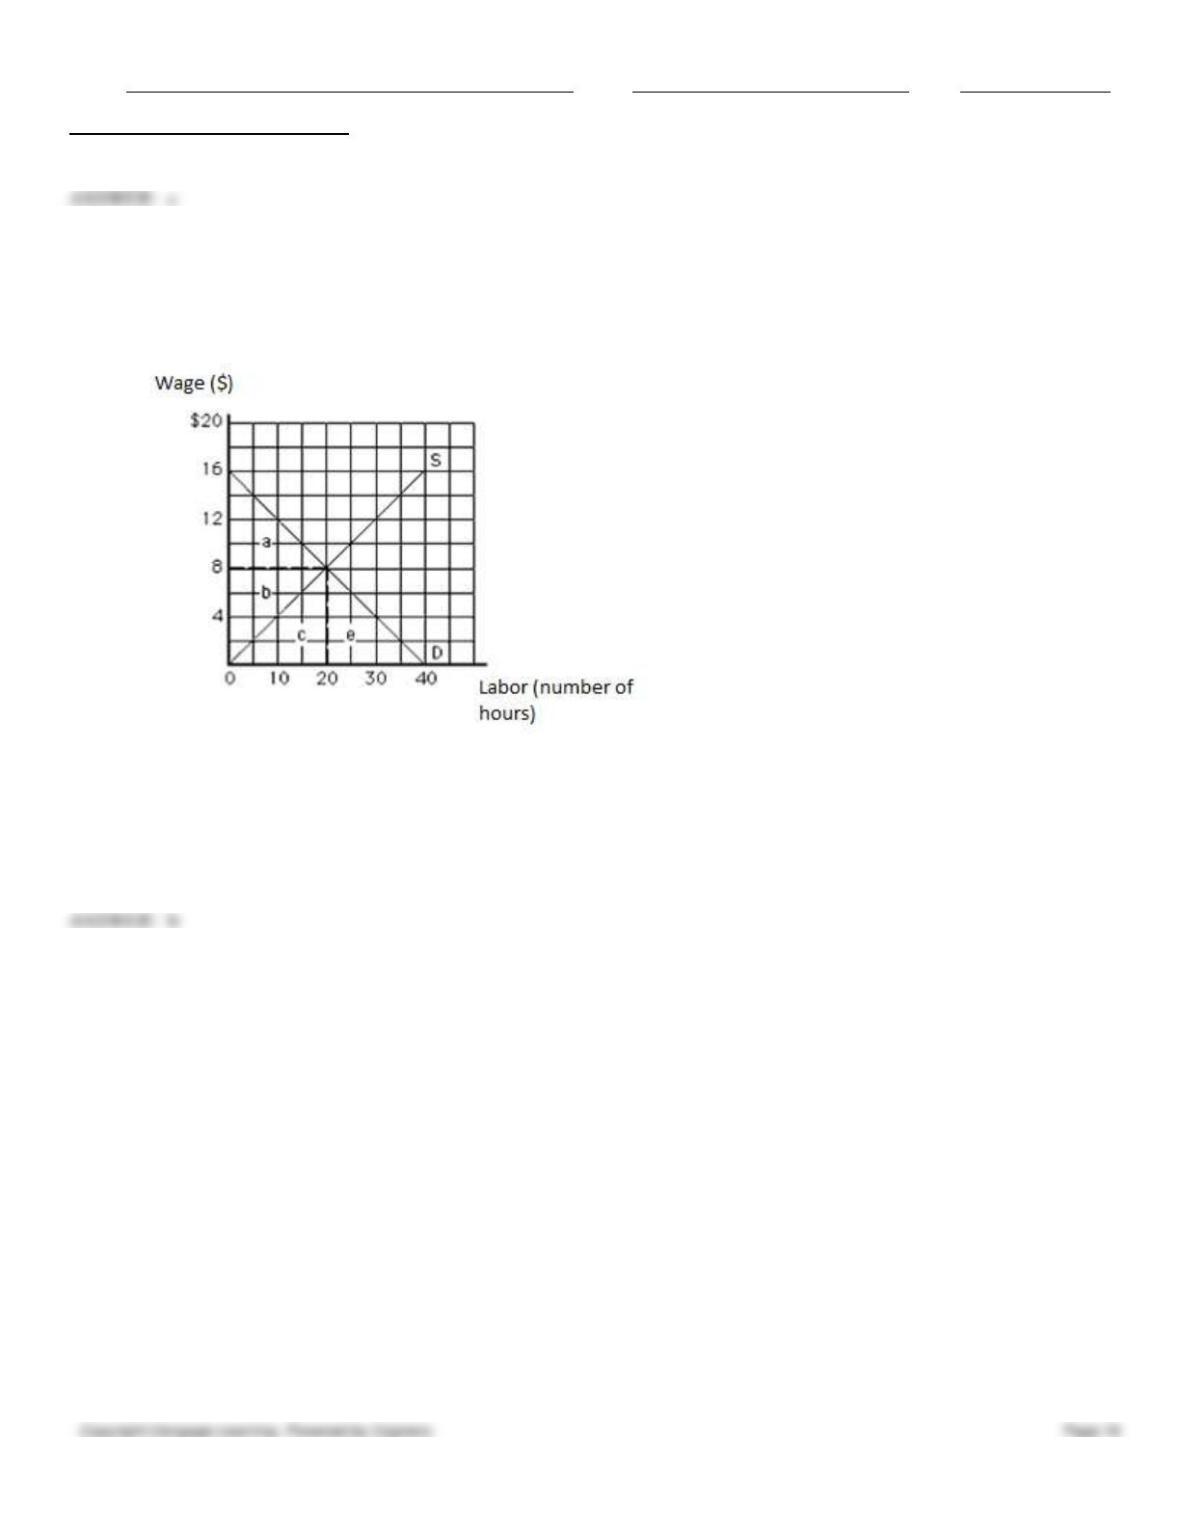
61. The following graph shows the labor market. The vertical axis measures wage in dollars, and the horizontal axis
measures labor in hours. The opportunity cost of labor in equilibrium equals _____.
Figure 11.1
a.
$40
b.
$80
c.
$160
d.
$16
e.
$8
62. The following graph shows the labor market. The vertical axis measures wage in dollars, and the horizontal axis
measures labor in hours. Which unit of the resource is earning the highest economic rent?
Figure 11.1

Name:
Class:
Date:
Chapter 11: Resource Markets
a.
The fifth unit
b.
The tenth unit
c.
The fifteenth unit
d.
The twentieth unit
e.
The thirtieth unit
63. The following graph shows the labor market. The vertical axis measures wage in dollars, and the horizontal axis
measures labor in hours. Which unit of the resource is earning the least economic rent?
Figure 11.1
a.
The fifth unit
b.
The tenth unit
c.
The fifteenth unit
d.
The twentieth unit

Name:
Class:
Date:
Chapter 11: Resource Markets
e.
The thirtieth unit
64. The following graph shows the labor market. The vertical axis measures wage in dollars, and the horizontal axis
measures labor in hours. The economic rent in equilibrium is represented by the area _____.
Figure 11.1
a.
a
b.
b
c.
c
d.
a + b
e.
b + c
65. The following graph shows the labor market. The vertical axis measures wage in dollars, and the horizontal axis
measures labor in hours. The opportunity cost in equilibrium is represented by the area _____.
Figure 11.1
Name:
Class:
Date:
Chapter 11: Resource Markets
a.
a
b.
b
c.
c
d.
a + b
e.
b + c
66. The following graph shows the labor market. The vertical axis measures wage in dollars, and the horizontal axis
measures labor in hours. The total labor earnings in equilibrium are represented by the area _____.
Figure 11.1
a.
a
b.
b
c.
c
d.
a + b

Name:
Class:
Date:
Chapter 11: Resource Markets
e.
b + c
67. The following graph shows the labor market. The vertical axis measures wage in dollars, and the horizontal axis
measures labor in hours. The twentieth unit of labor is earning a wage of:
Figure 11.1
a.
$4, all of which is economic rent.
b.
$4, none of which is economic rent.
c.
$8, all of which is economic rent.
d.
$8, none of which is economic rent.
e.
$8, half of which is economic rent.
68. The following graph shows the labor market. The vertical axis measures wage in dollars, and the horizontal axis
measures labor in hours. The tenth unit of labor is earning a wage of:
Figure 11.1

Name:
Class:
Date:
Chapter 11: Resource Markets
a.
$4, all of which is economic rent.
b.
$4, none of which is economic rent.
c.
$8, all of which is economic rent.
d.
$8, none of which is economic rent.
e.
$8, half of which is economic rent.
69. The following graph shows the labor market. The vertical axis measures wage in dollars, and the horizontal axis
measures labor in hours. The total earnings of labor in equilibrium equal _____.
Figure 11.1
a.
$40
b.
$80
c.
$160
d.
$16
Name:
Class:
Date:
Chapter 11: Resource Markets
e.
$8
70. The following graph shows the labor market. The vertical axis measures wage in dollars, and the horizontal axis
measures labor in hours. The economic rent in equilibrium equals _____.
Figure 11.1
a.
$40
b.
$80
c.
$160
d.
$16
e.
$8
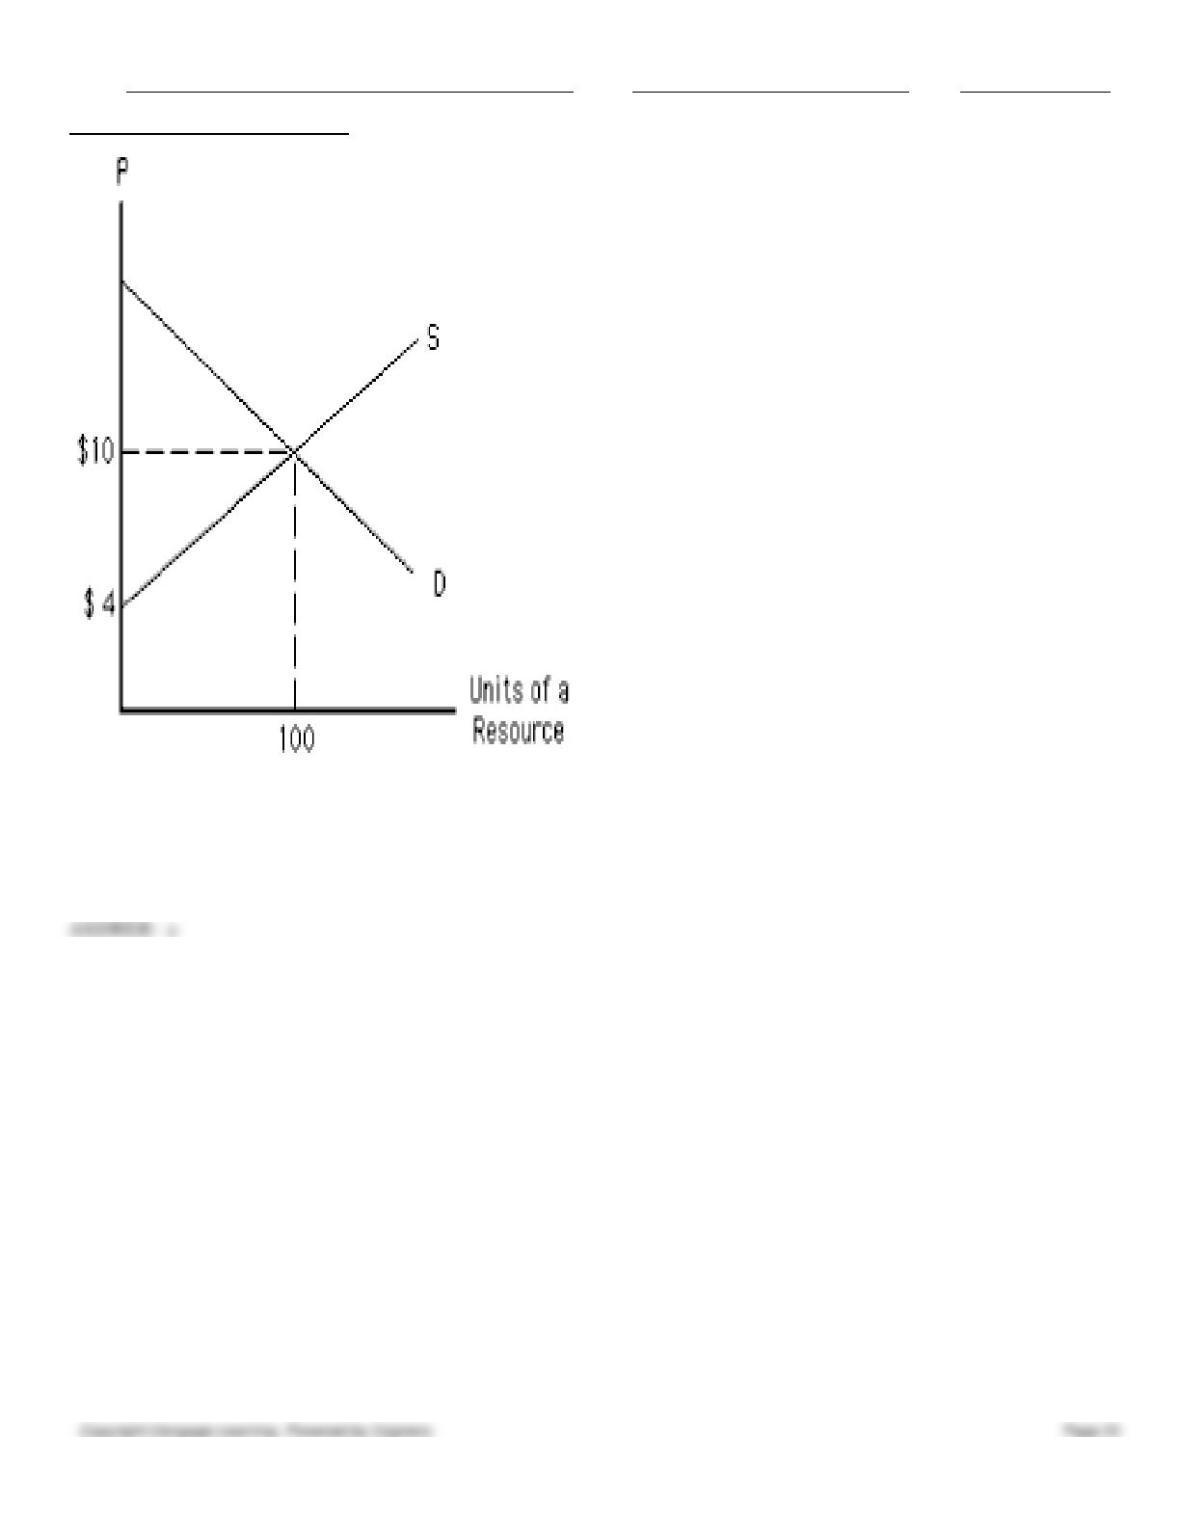
71. The following graph shows the demand and supply curves of a resource. One hundred units of the resource are earning
a resource price of:
Figure 11.2

Name:
Class:
Date:
Chapter 11: Resource Markets
a.
$10, all of which is economic rent.
b.
$10, none of which is economic rent.
c.
$4, all of which is economic rent.
d.
$4, none of which is economic rent.
e.
$10, some of which is economic rent.
72. The following graph shows the demand and supply curves of a resource. The total resource earnings in equilibrium
equal _____.
Figure 11.2
Name:
Class:
Date:
Chapter 11: Resource Markets
a.
$40
b.
$60
c.
$10
d.
$700
e.
$300
73. The following graph shows the demand and supply curves of a resource. The economic rent in equilibrium equals
_____.
Figure 11.2


