78) The MPC is equal to
A)
△
C /
△
S.
B)
△
S /
△
C.
C)
△
C /
△
YD.
D)
△
S /
△
YD.
79) The value of the marginal propensity to consume is
A) between 0 and 1.
B) between 1 and 10.
C) between -1 and +1.
D) between 1 percent and 100 percent.
80) The marginal propensity to consume is
A) the slope of the savings function.
B) never greater than 1.
C) the percentage or fraction of income that is consumed.
D) the percentage change in disposable income.
81) The size of the marginal propensity to consume
A) is negative if dissaving is present.
B) is between 0 and 1.
C) equals 1.
D) exceeds 1.
82) If consumption expenditures for a household increase from $1000 to $1800 when disposable
income rises from $1000 to $2000, the marginal propensity to consume is
A) 0.8.
B) 80.
C) 1.25.
D) 0.2.
83) If the marginal propensity to consume is 0.8, every $10 increase in disposable income
increases
A) consumption expenditure by $0.80.
B) consumption expenditure by $80.00.
C) saving by $0.20.
D) consumption expenditure by $8.00.
84) Suppose disposable income increases from $7 trillion to $8 trillion. At the same time,
consumption expenditure increases from $6.8 trillion to ________. Thus the MPC must equal
________.
A) $7.8 trillion; 0.80
B) $7.6 trillion; 0.80
C) $7.4 trillion; 0.40
D) $8 trillion; 1.00
85) When disposable income increases from $6 trillion to $6.5 trillion, consumption expenditure
increase from $5.5 trillion to $5.9 trillion. The MPC equals
A) 0.75.
B) 0.76.
C) 0.8.
D) 0.2.
86) Between 2015 and 2016 the government reported that disposable income decreased by $400
billion. If the MPC equals 0.8, then consumption expenditure
A) decreases by $400 billion.
B) decreases by $3,200 billion.
C) decreases by $320 billion.
D) decreases by $32 billion.
87) Between 2015 and 2016 the government reported that disposable income decreased by $400
billion and consumption expenditure decreased by $280 billion. Based on these data, the MPC
equals
A) 1.43
B) 0.80.
C) 0.70.
D) $120 billion.
88) Suppose disposable income increases from $5 trillion to $6 trillion. As a result, consumption
expenditure increases from $4 trillion to ________. This result means the MPC equals
________.
A) $4.5 trillion; 4.50
B) $5 trillion; 0.80
C) $4.8 trillion; 0.80
D) $6 trillion; 1.00
89) The marginal propensity to save is
A) total saving divided by total disposable income.
B) total saving divided by the change in disposable income.
C) the change in saving divided by the change in consumption expenditure.
D) the change in saving divided by the change in disposable income.
90) The size of the marginal propensity to save
A) is negative if dissaving is present.
B) is between 0 and 1.
C) equals 1.
D) exceeds 1.
91) The MPS equals the ratio of
A) saving to real GDP.
B) the change in saving to the change in consumption expenditure.
C) saving to consumption expenditure.
D) None of the above answers is correct.
92) The marginal propensity to save equals the
A) change in savings resulting from a one dollar change in disposable income.
B) change in savings from a change in consumption expenditure.
C) average amount of income saved.
D) ability to save the same percentage of income each month.
93) When disposable income increases from $7 trillion to $7.5 trillion, consumption expenditure
increase from $6.5 trillion to $6.9 trillion. The MPS is equal to
A) 0.75.
B) 0.76.
C) 0.8.
D) 0.2.
94) When disposable income equals $800 billion, planned consumption expenditure equals $600
billion, and when disposable income equals $1,000 billion, planned consumption expenditure
equals $760 billion. What is the marginal propensity to save?
A) 0.80
B) 0.64
C) 0.25
D) 0.20
95) Suppose real GDP increases from $13 trillion to $14 trillion. Consequently, consumption
expenditure increases from $13 trillion to $13.75 trillion. This result implies the MPS equals
A) 0.75.
B) 0.25.
C) 0.
D) some amount that cannot be determined without more information.
96) Between 2015 and 2016 the government reported that disposable income decreased by $400
billion and consumption expenditure decreased by $280 billion. Based on these data, the MPS
equals
A) 1.42.
B) 0.70.
C) 0.30.
D) $120 billion.
97) The MPC and MPS measure changes in consumption expenditure and saving that result from
changes in
A) expected inflation.
B) disposable income.
C) expected future income.
D) government expenditures on goods and services.
98) Which of the following is TRUE?
A) MPS = MPC
B) MPS + MPC = 1
C) MPS + MPC = 0
D) MPS – MPC = 1
99) The MPC and MPS
A) sum to 1.
B) can sum to anything greater than 0.
C) sum to 100.
D) each are usually less than .5.
100) If the marginal propensity to save is 0.6, then the marginal propensity to consume is
A) 0.6.
B) 0.4.
C) 1.0.
D) More information is needed in order to calculate the correct answer.
101) For a household, the marginal propensity to save plus the marginal propensity to consume
A) equals 1.
B) equals 0.
C) equals a number that is larger the larger the household’s disposable income.
D) equals a number that is smaller the larger the household’s disposable income.
102) 1 – MPC equals
A) autonomous consumption.
B) the marginal propensity to save.
C) induced consumption.
D) the net national product.
103) If the MPC equals 0.75, then
A) for every $100 increase in consumption expenditure, disposable income increases by $75.
B) consumption expenditure is always more than disposable income.
C) for every $100 increase in disposable income, saving increases by $75.
Disposable
income
(thousands of
dollars)
Consumption
expenditure
(thousands of dollars)
200
225
300
300
400
375
500
450
104) According to the data in the above table, at what level of disposable income is savings
negative?
A) 200
B) 300
C) 400
D) never because saving cannot be negative
105) According to the data in the above table, what is the marginal propensity to consume?
A) 75.
B) 100.
C) 0.75.
D) 1.
106) According to the data in the above table, what is the marginal propensity to save?
A) 25.
B) 0.75.
C) 0.25.
Disposable income
(dollars)
Consumption
expenditure (dollars)
0
100
100
180
300
340
500
500
700
660
900
820
107) In the above table, savings are positive when disposable income is greater than
A) zero.
B) $100.
C) $300.
D) $500.
108) In the above table, savings equal zero when disposable income equals
A) 0.
B) $200.
C) $300.
D) $500.
109) In the above table, the marginal propensity to consume equals
A) 0.90.
B) 0.75.
C) 0.80.
D) 0.85.
Disposable income
(billions of dollars)
Consumption expenditure
(billions of dollars)
400
450
600
600
800
750
1000
900
1200
1050
110) Based upon the above table, if disposable income is $400 billion, saving equals
A) -$50 billion.
B) $0 billion.
C) $50 billion.
D) $100 billion.
111) Based upon the above table, saving equals $100 billion when disposable income equals
A) $800 billion.
B) $1000 billion.
C) $1200 billion.
D) some amount but we need more information to calculate the amount.
112) Based upon the above table, the MPC for the consumption function is
A) increasing as income rises.
B) equal to 1.0 at $600 billion.
C) constant at 0.75.
D) constant at 0.25.
113) Based upon the above table, the MPS is equal to
A) 1
B) 0.75
C) 0.25
D) cannot be determined from the information given
Disposable
income
(dollars)
Consumption
expenditure (dollars)
100
225
200
300
300
375
400
450
500
525
600
600
114) Using the above table, if disposable income is $400, saving is
A) -$50.
B) $0.
C) $50.
D) $100.
115) Using the data in above table, the marginal propensity to consume is
A) increasing as disposable income increases.
B) equal to 1.0 when disposable income equals $600.
C) constant at 0.75.
D) constant at 0.25.
116) Using the data from the above table, the marginal propensity to save is
A) falling as disposable income is rising.
B) 0 when disposable income is equal to $600.
C) constant at 0.25.
D) constant at 0.75.
117) The slope of the consumption function
A) is positive and equals 1 – MPC.
B) is negative.
C) equals the MPC.
D) is undefined below the 45-degree line.
118) The slope of the consumption function is
A) perfectly horizontal at the equilibrium level.
B) equal to 1.
C) equal to the MPC.
D) vertical at the full employment level of income.
119) When the consumption function becomes steeper,
A) less of every dollar is consumed.
B) the saving function also become steeper.
C) the MPC rises.
D) the MPC falls.
120) Which of the following concerning the marginal propensity to consume and the
consumption function is TRUE?
I. The larger the marginal propensity to consume, the greater the amount of autonomous
consumption.
II. The larger the marginal propensity to consume, the steeper the consumption function.
A) I is true.
B) II is true.
C) I and II are true.
D) Neither I nor II is true.
121) If an increase in a household’s disposable income from $10,000 to $12,000 boosts its
consumption expenditure from $8,000 to $9,000, the
A) household is dissaving.
B) slope of the consumption function is 0.2.
C) slope of the consumption function is 0.5.
D) slope of the consumption function is 1000.
122) The marginal propensity to save is ________.
A) always greater than the marginal propensity to consume
B) equal to the slope of the saving function
C) equal to 1 plus the slope of the consumption function
D) equal to the inverse of the marginal propensity to consume
123) The marginal propensity to save (MPS) is equal to the
A) slope of the savings function.
B) slope of the 45 degree.
C) reciprocal value of the MPC.
D) difference between consumption and income.
124) The slope of the saving function is equal to
A) the MPS.
B) the MPC.
C) 1- MPS.
D) None of the above answers is correct.
125) If the slope of the saving function is 0.27, then the marginal propensity to ________.
A) import is less than 0.27
B) save is 0.73
C) consume is 0.73
D) consume is 0.27
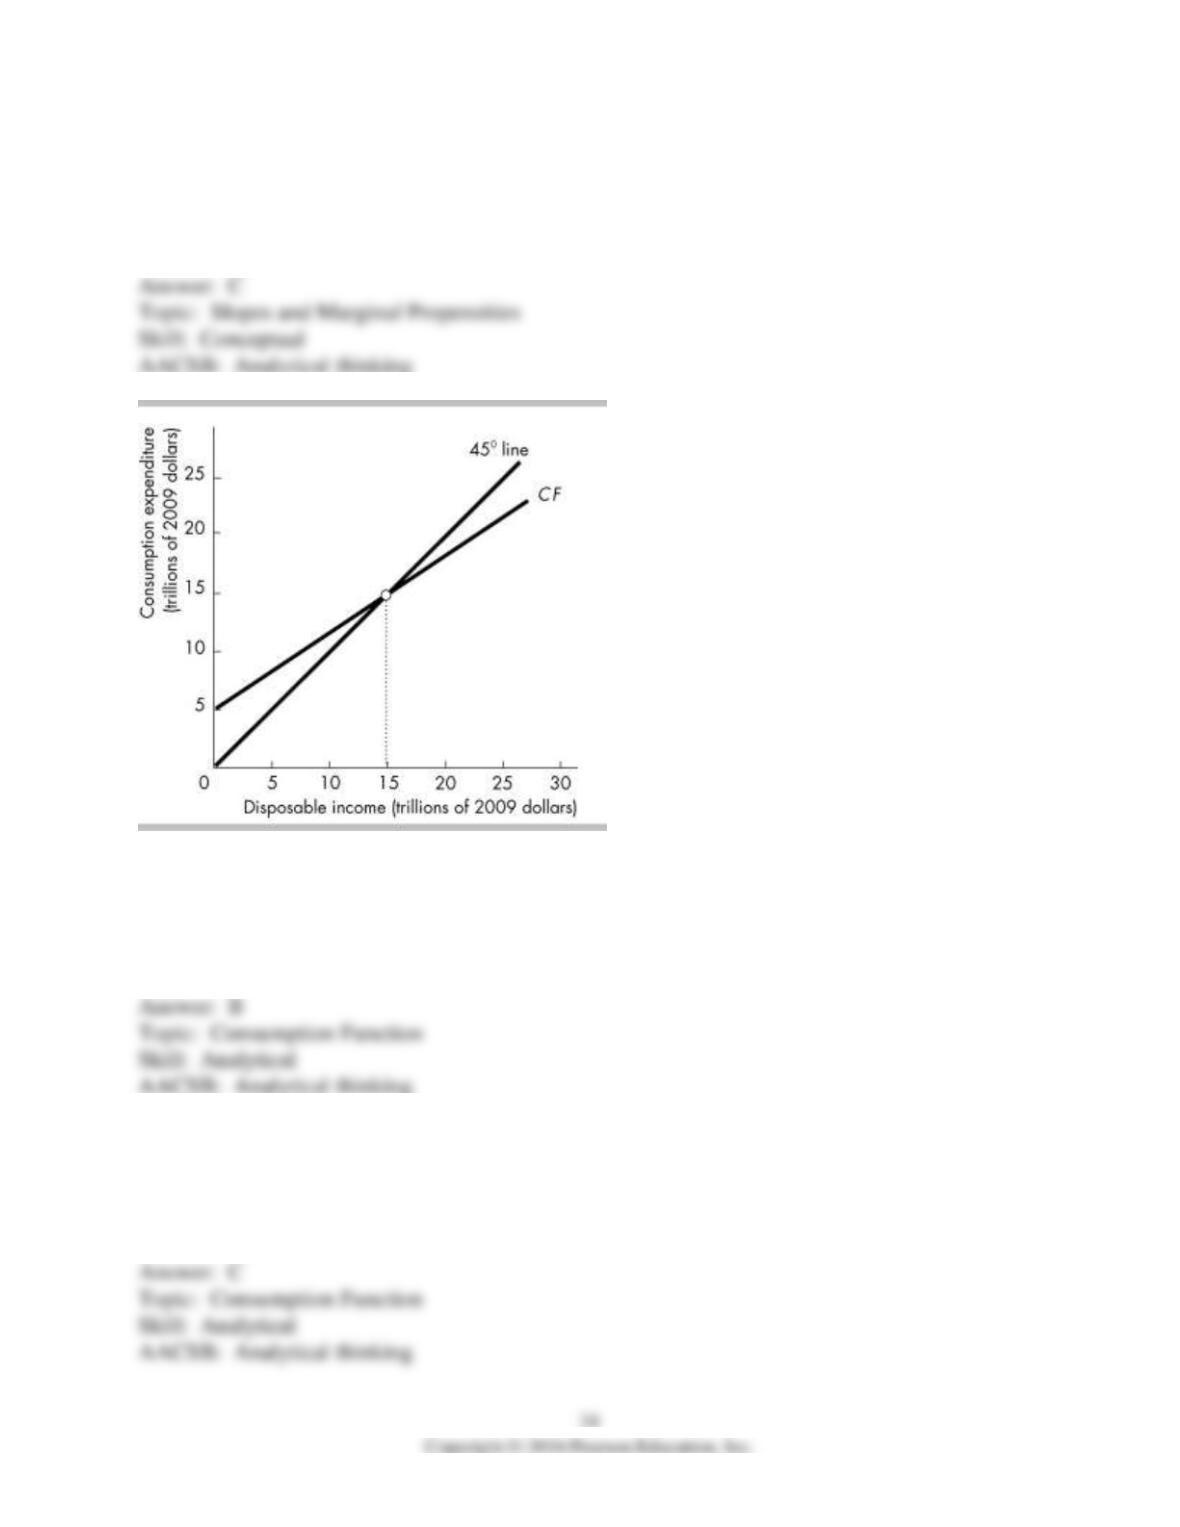
126) In the figure above, autonomous consumption is
A) zero.
B) $5 trillion.
C) $10 trillion.
D) $15 trillion.
127) In the figure above, the induced consumption when real GDP is $15 trillion is
A) zero.
B) $5 trillion.
C) $10 trillion.
D) $15 trillion.
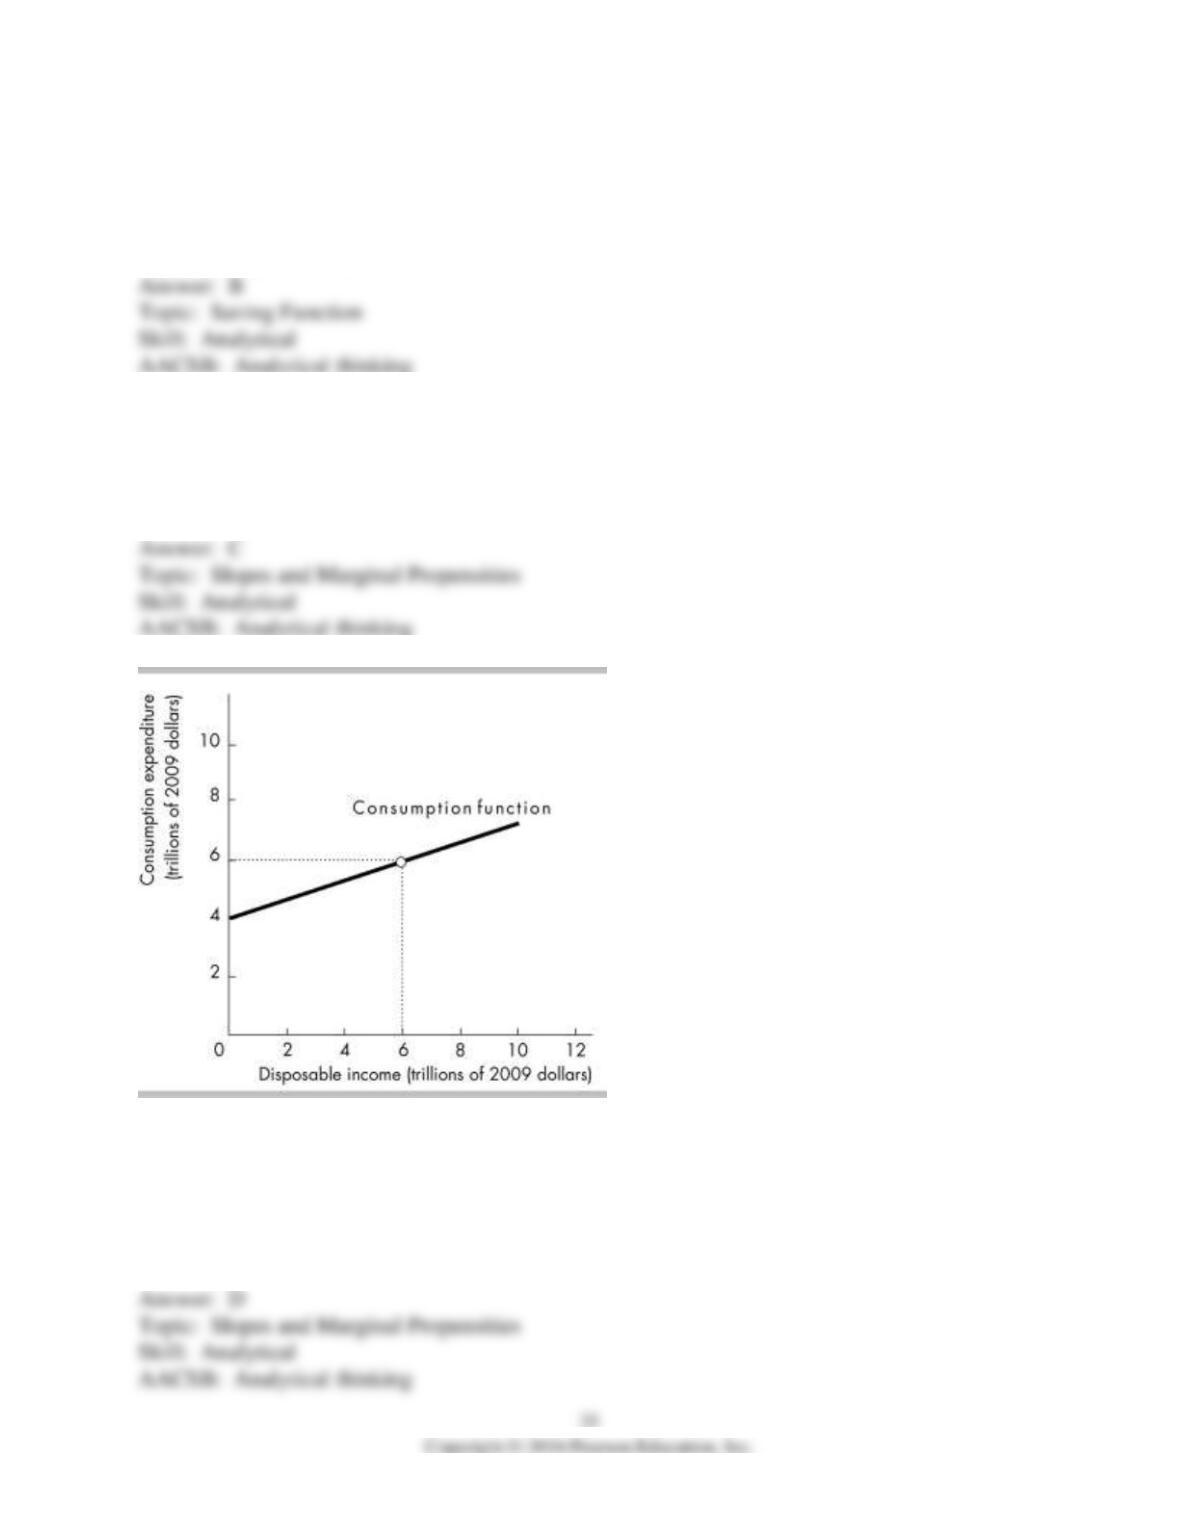
128) In the figure above, negative saving occurs
A) at all levels of disposable income.
B) when disposable income is $10 trillion.
C) when disposable income is $15 trillion.
D) when disposable income is $20 trillion.
129) Based on the figure above, the marginal propensity to consume is
A) 3.00.
B) 1.00.
C) 0.67.
D) 0.25.
130) The figure above illustrates an economy’s consumption function. What is the marginal
propensity to consume in this economy?
A) 0.67
B) 1.00
C) 0.75
D) 0.33
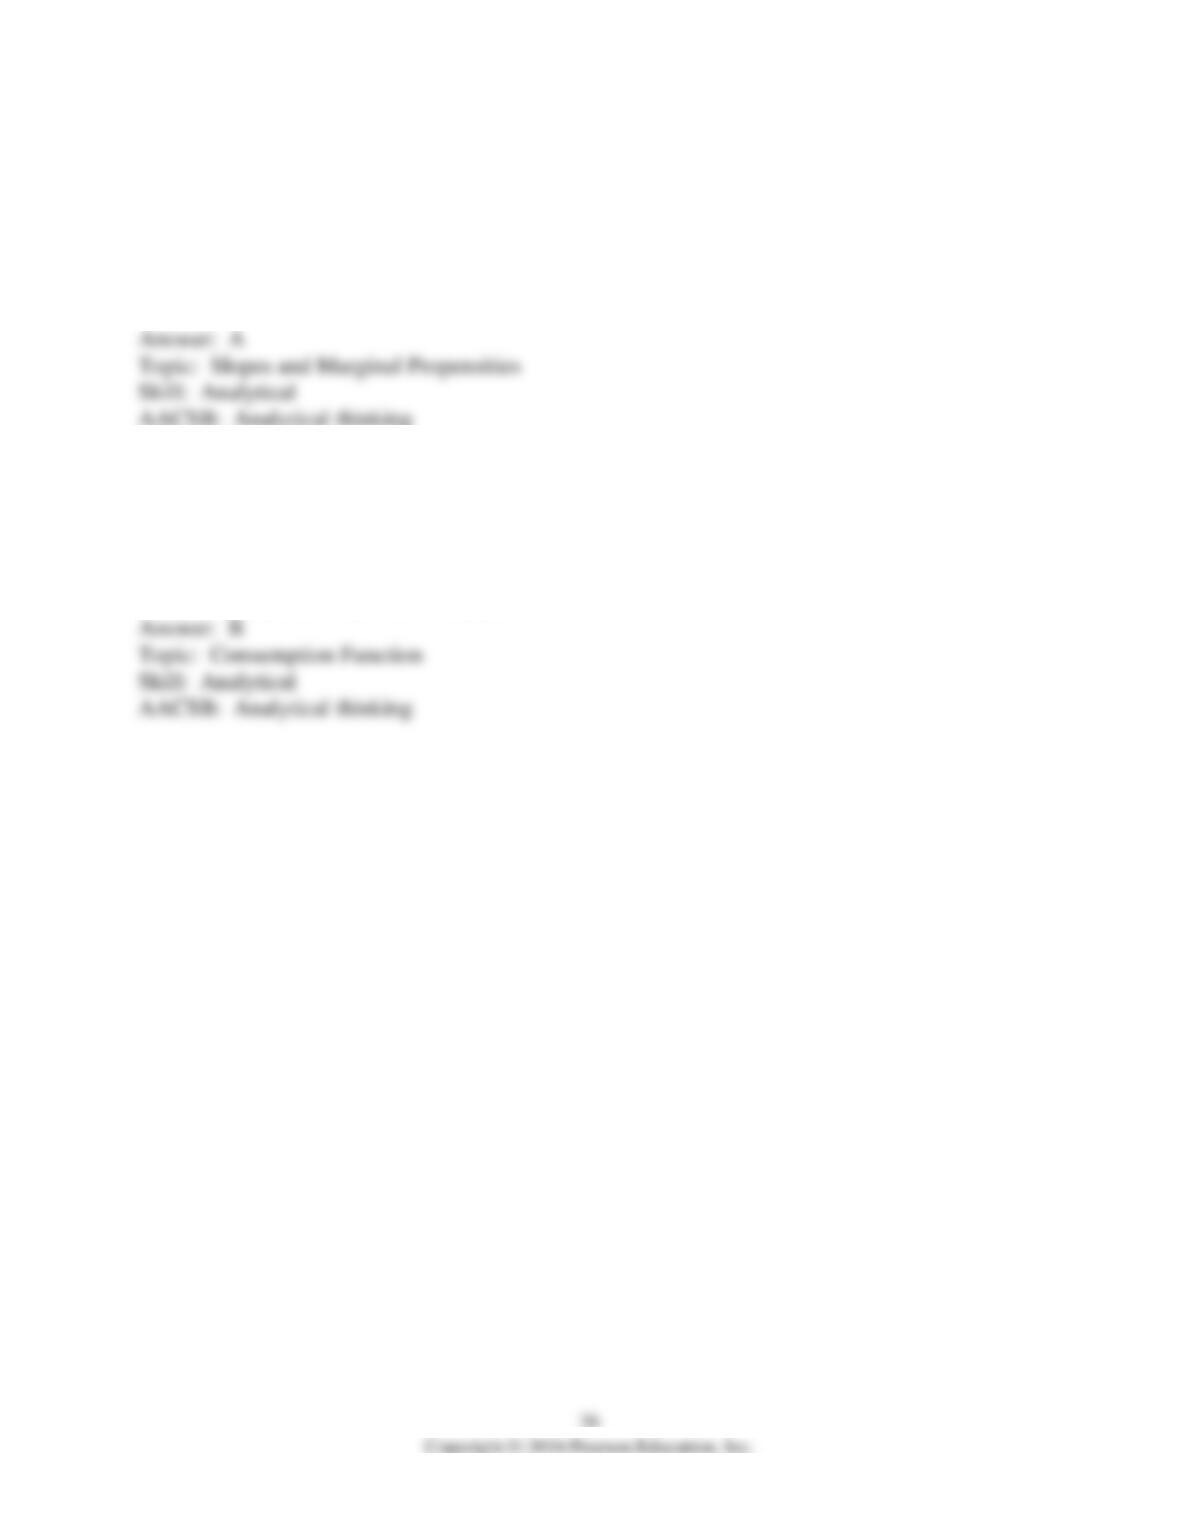
131) The figure above illustrates an economy’s consumption function. What is the marginal
propensity to save in this economy?
A) 0.67
B) 1.00
C) 0.75
D) 0.33
132) The figure above illustrates an economy’s consumption function. What is autonomous
consumption in this economy?
A) $0
B) $4 trillion
C) $6 trillion
D) None of the above answers is correct.
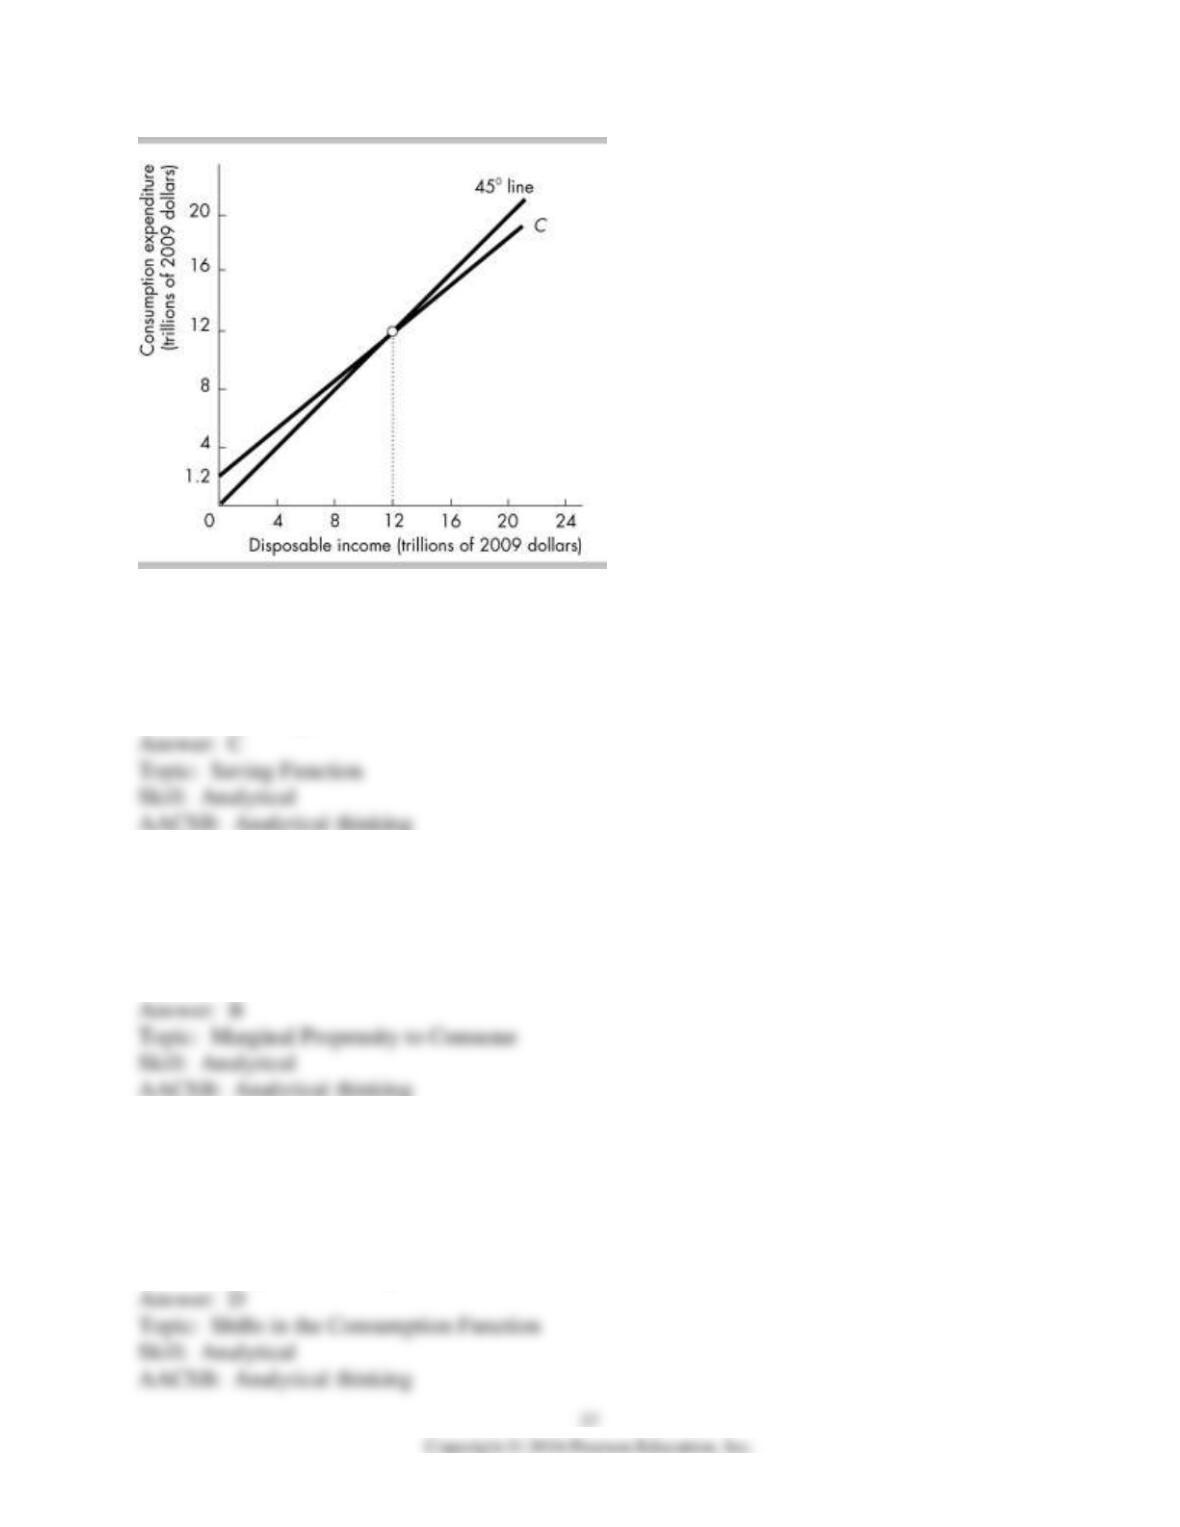
133) In the above figure, when disposable income is greater than $12 trillion, then
A) savings are negative.
B) the MPC is greater than 1.
C) savings are positive.
D) the MPS is negative.
134) In the above figure, the marginal propensity to consume equals
A) 0.80.
B) 0.90.
C) 0.75.
D) 0.85.
135) In the above figure, a change in autonomous consumption to $4 trillion with no change to
the MPC would cause the consumption function to
A) become steeper.
B) become flatter.
C) exhibit a parallel shift downward.
D) exhibit a parallel shift upward.
136) In the above figure, the marginal propensity to save equals
A) 0.
B) 0.10.
C) 0.20.
D) 0.90.
137) In the above figure, when disposable income equals $12 trillion, induced consumption
expenditure equals
A) $1.2 trillion.
B) $10.8 trillion.
C) $12 trillion.
D) cannot be determined from the information given.
138) In the short run, a factor that leads to changes in U.S. imports is
A) the level of income in foreign nations.
B) the real interest rate.
C) the U.S. real GDP.
D) U.S. exports.
139) When U.S. real GDP increases, the quantity of U.S. imports
A) decreases.
B) increases.
C) remains constant.
D) at first decreases and then increases.
140) The marginal propensity to import reflects the relationship between changes in imports and
changes in
A) consumption expenditure.
B) investment spending.
C) exports.
D) real GDP.
141) As globalization has increased, the trend in the U.S. marginal propensity to import has been
for it to
A) decrease to less than 0.8.
B) increase.
C) remain steady.
D) decrease to more than 0.8.
142) The marginal propensity to import is the ________ that is spent on imports.
A) fraction of an increase in real GDP
B) total amount of real GDP
C) total amount of potential GDP
D) fraction of an increase in potential GDP
143) Between 2012 and 2013 real GDP increased by $600 billion and imports increased by $90
billion. Based on these data, the marginal propensity to import equals
A) 0.15.
B) 0.25.
C) 0.90
D) 6.67.
144) The U.S. consumption function
A) has shifted upward over time.
B) has a positive slope.
C) has a slope of about 0.9.
D) All of the above answers are correct.
145) Since 1970, U.S. consumption function has generally shifted ________ because of
________.
A) upward; higher expected future income and rising wealth
B) upward; higher real interest rates
C) downward; higher real interest rates
D) downward; falling wealth
146) Consumption expenditure decreases when ________ decreases.
A) the interest rate
B) the price level
C) disposable income
D) saving
147) The slope of the saving function is equal to the
A) marginal propensity to save.
B) marginal propensity to consume.
C) marginal propensity to consume divided by the marginal propensity to save.
D) marginal propensity to save divided by the marginal propensity to consume.