
Name:
Class:
Date:
Chapter 11: Resource Markets
a.
$40
b.
$60
c.
$400
d.
$1,000
e.
$300
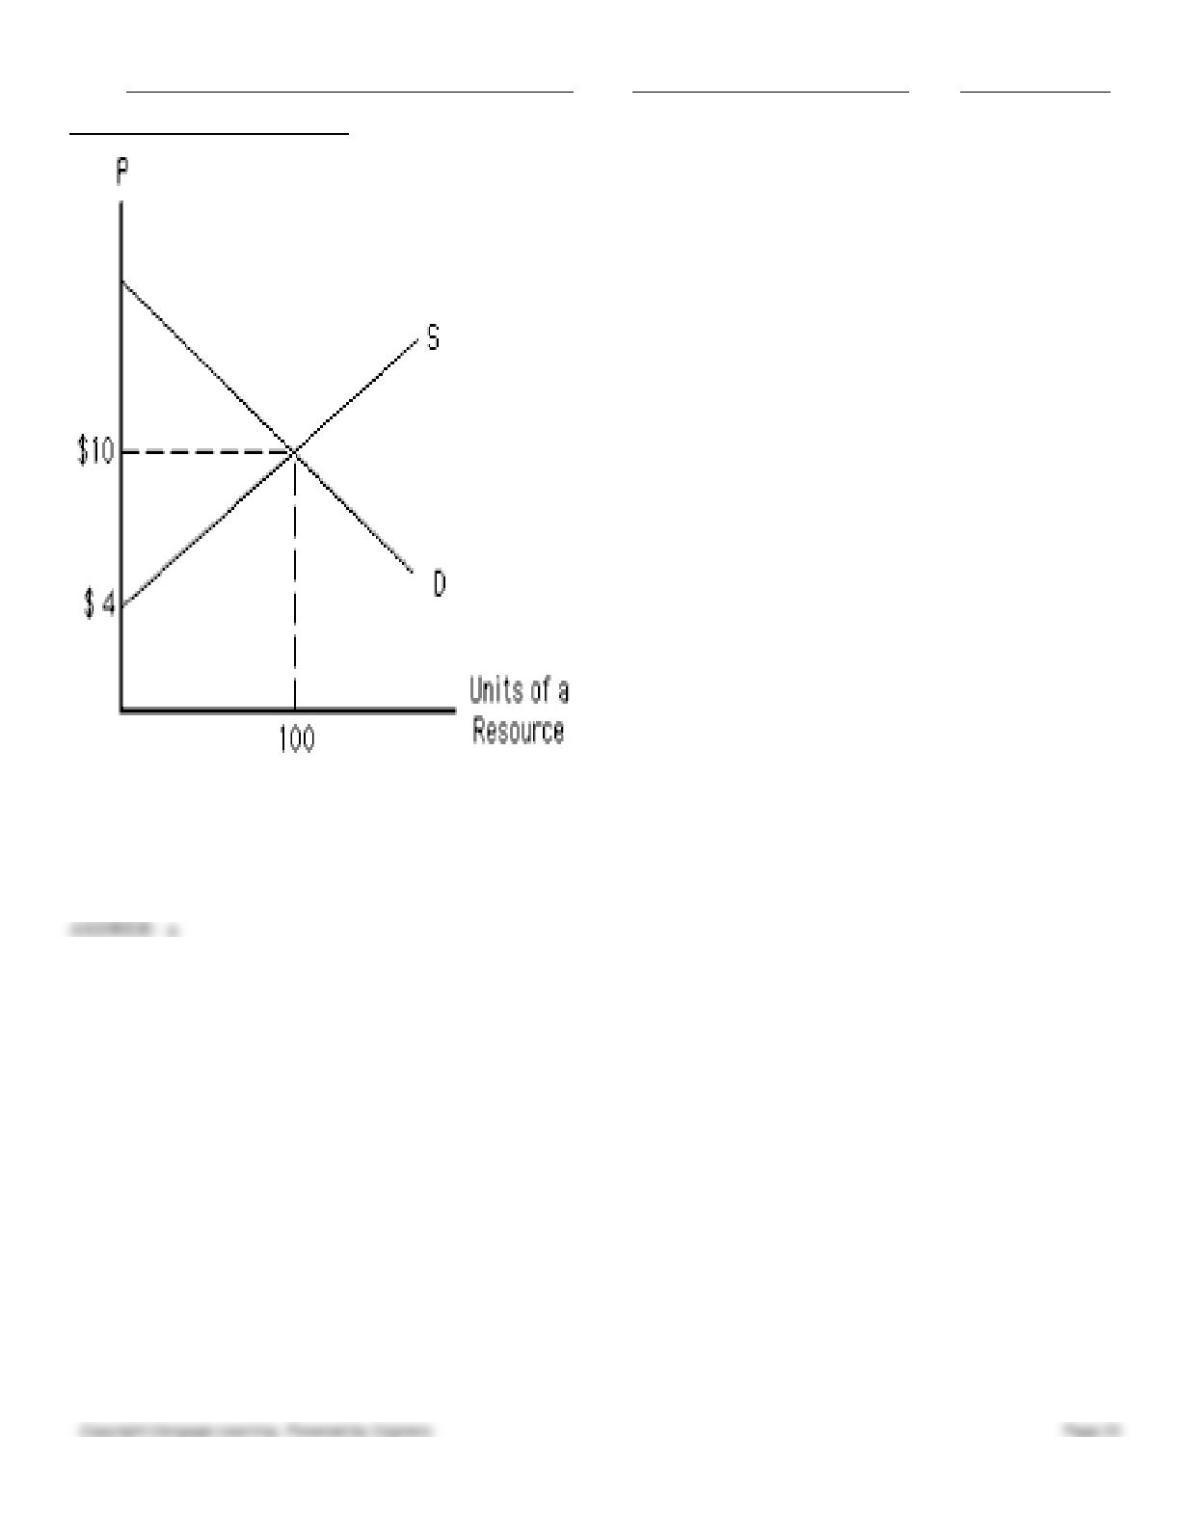
74. The following graph shows the demand and supply curves of a resource. The opportunity cost of the resource in
equilibrium equals _____.
Figure 11.2

Name:
Class:
Date:
Chapter 11: Resource Markets
a.
$40
b.
$60
c.
$100
d.
$700
e.
$300
75. The following graph shows the demand and supply curves of a resource. Which unit of the resource is earning the
highest economic rent?
Figure 11.2
Name:
Class:
Date:
Chapter 11: Resource Markets
a.
The first unit
b.
The tenth unit
c.
The fifteenth unit
d.
The hundredth unit
e.
The fifth unit
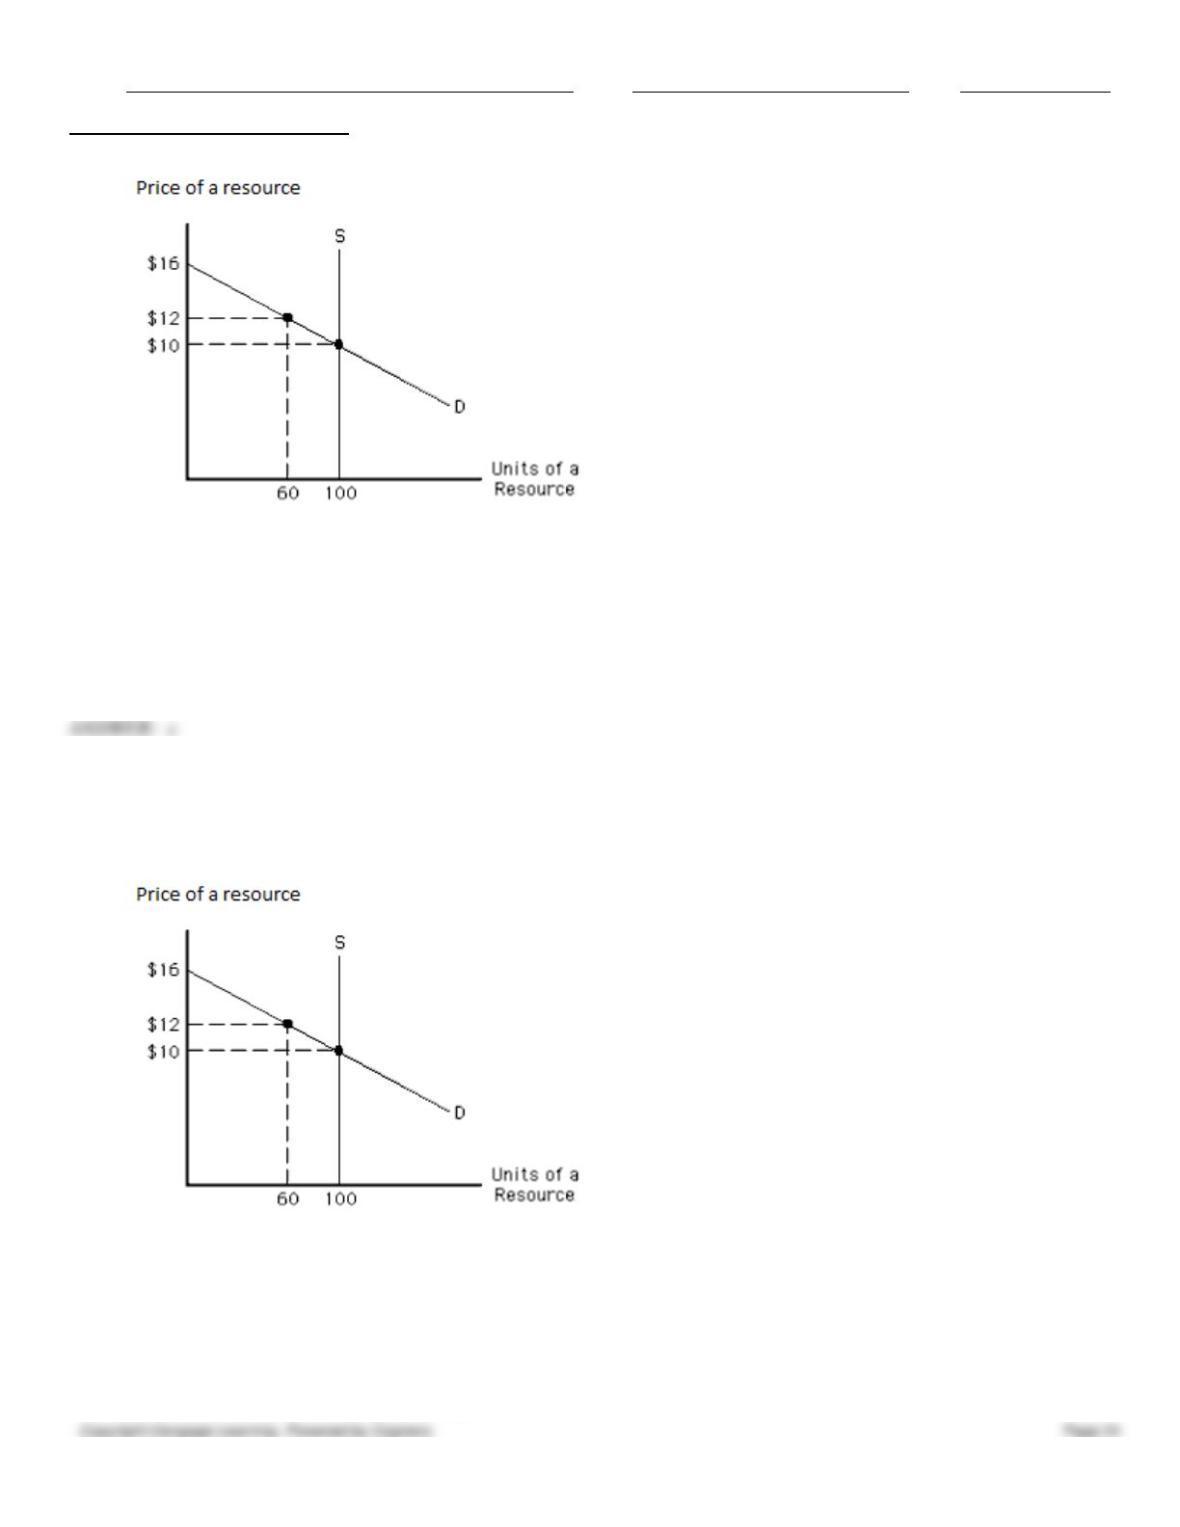
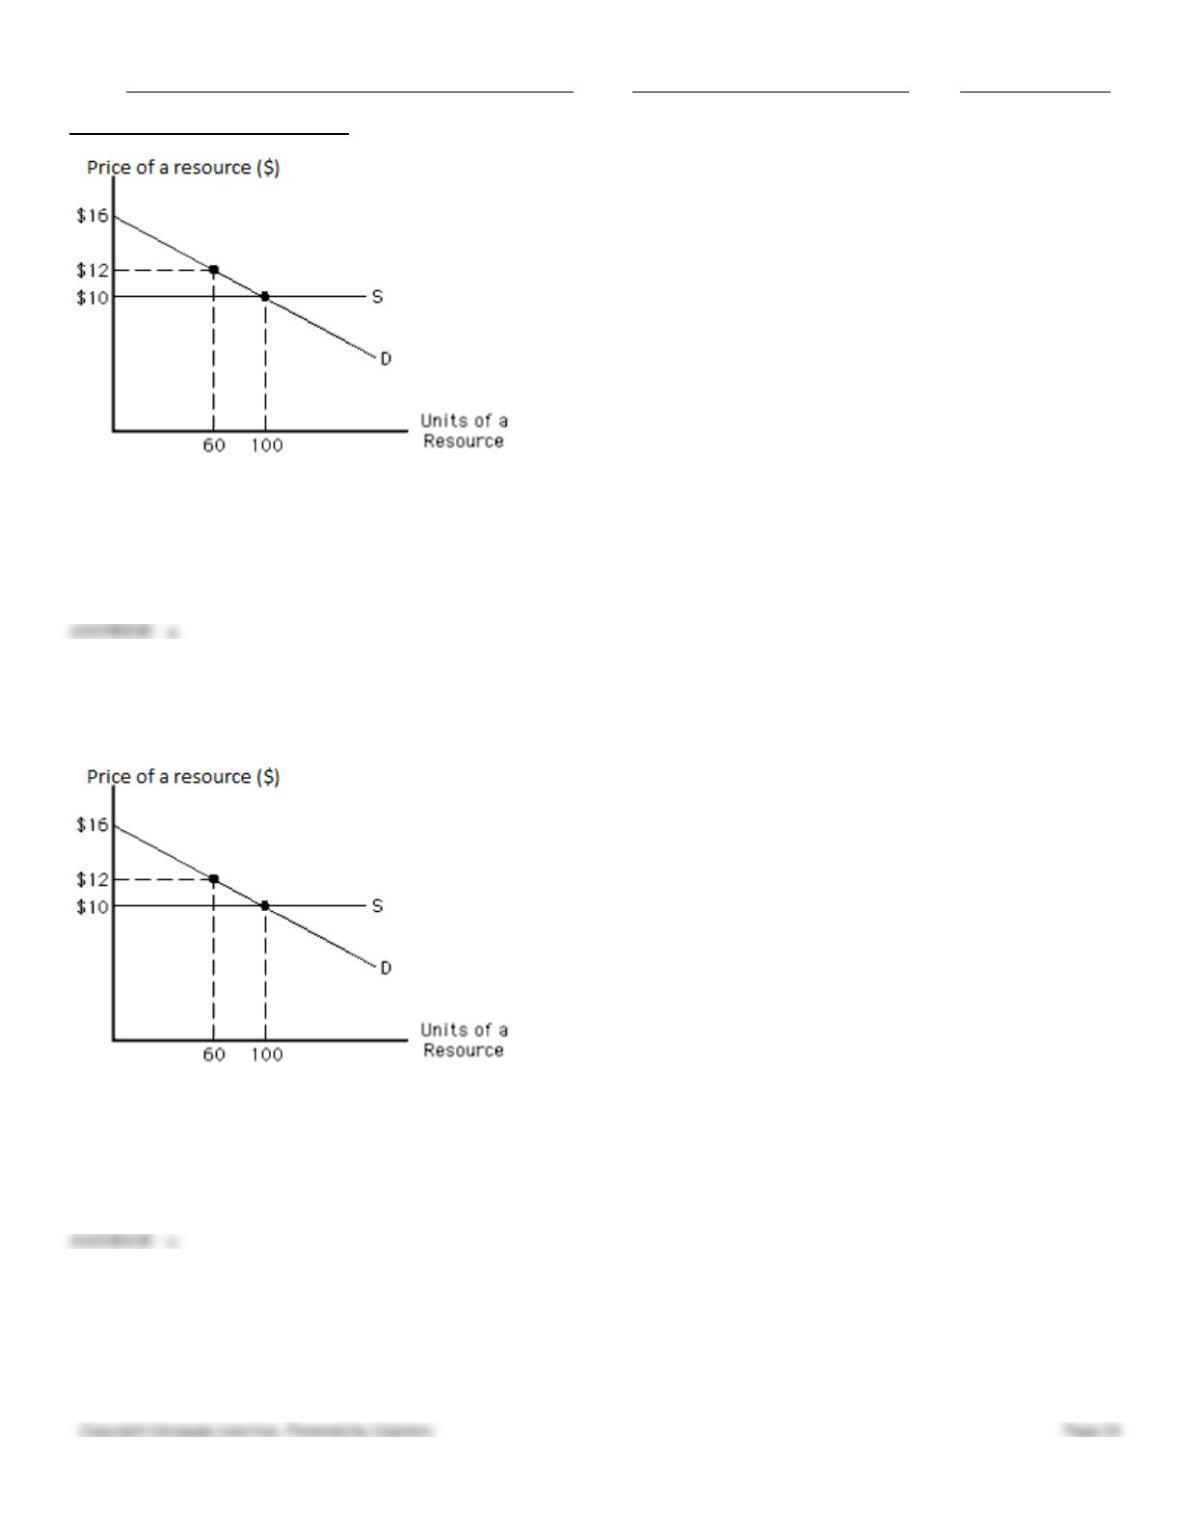
76. The following graph shows the demand and supply curves of a resource. The equilibrium price of the resource is
_____.
Figure 11.3
Name:
Class:
Date:
Chapter 11: Resource Markets
a.
$16
b.
$12
c.
$10
d.
less than $10
e.
more than $12 but less than $16
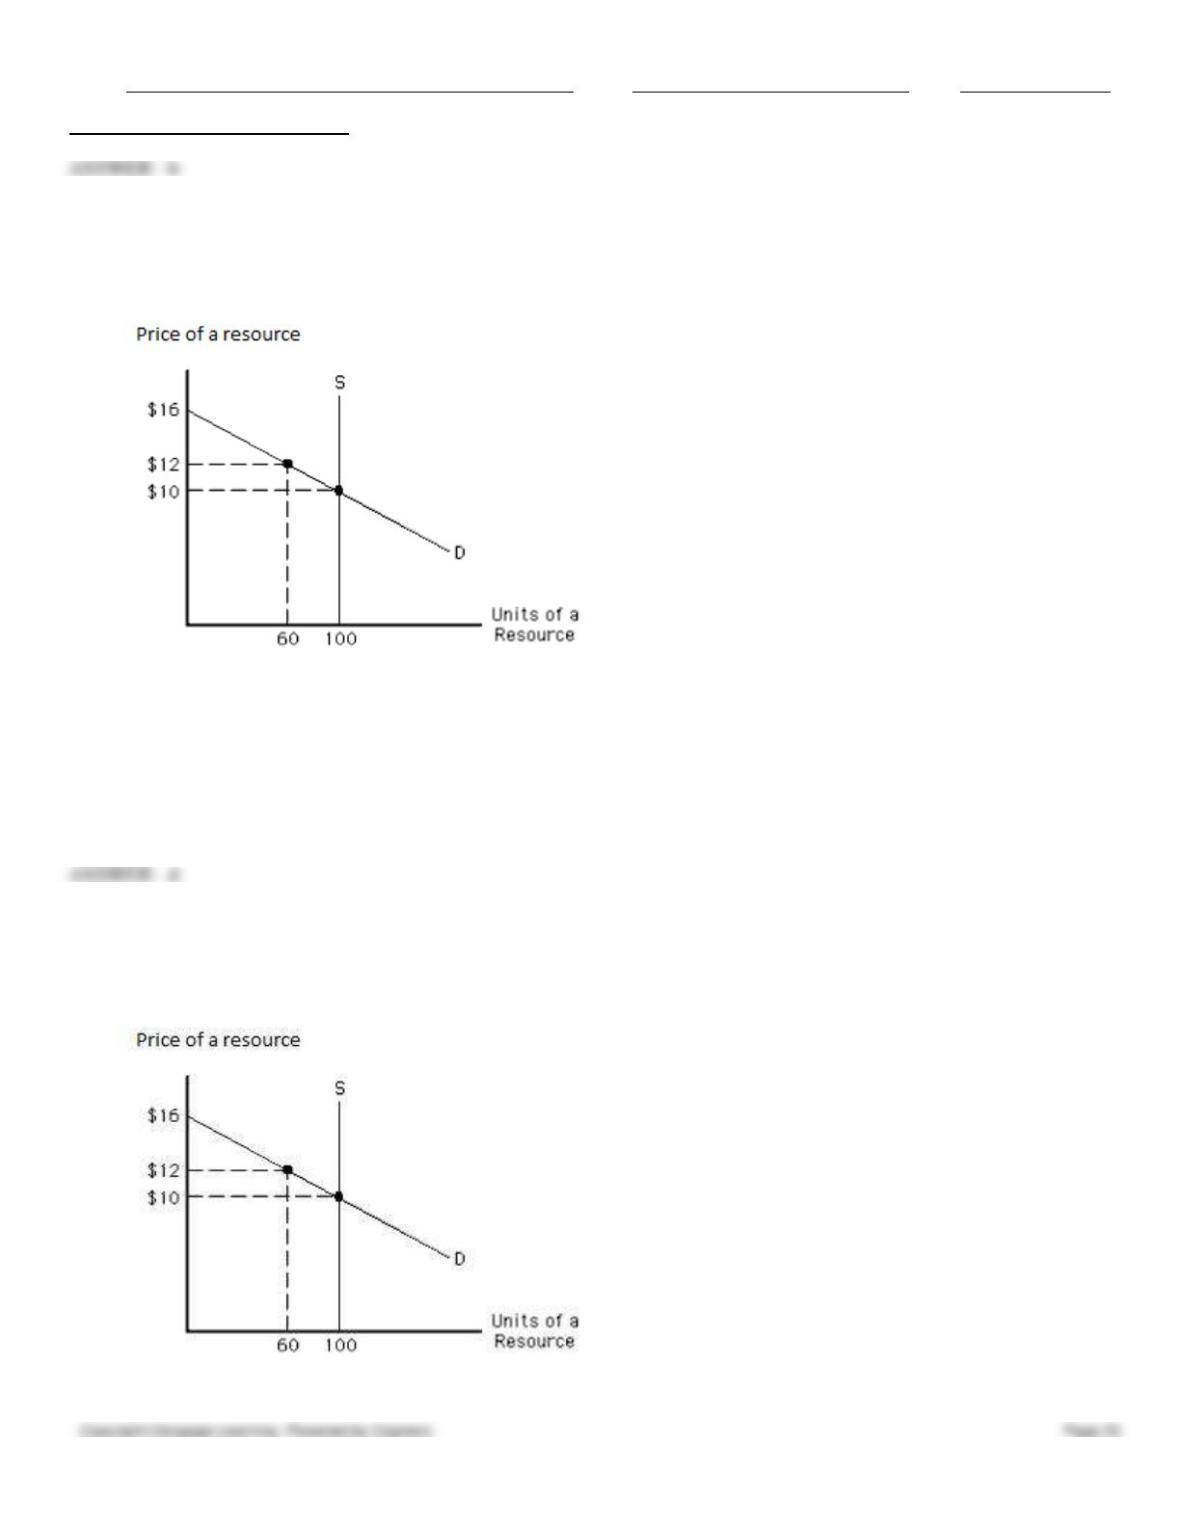
77. The following graph shows the demand and supply curves of a resource. The equilibrium quantity of the resource
exchanged in the market is _____.
Figure 11.3
a.
more than 100 units
b.
100 units
c.
60 units
d.
less than 60 units
e.
more than 60 units but less than 100 units
Name:
Class:
Date:
Chapter 11: Resource Markets
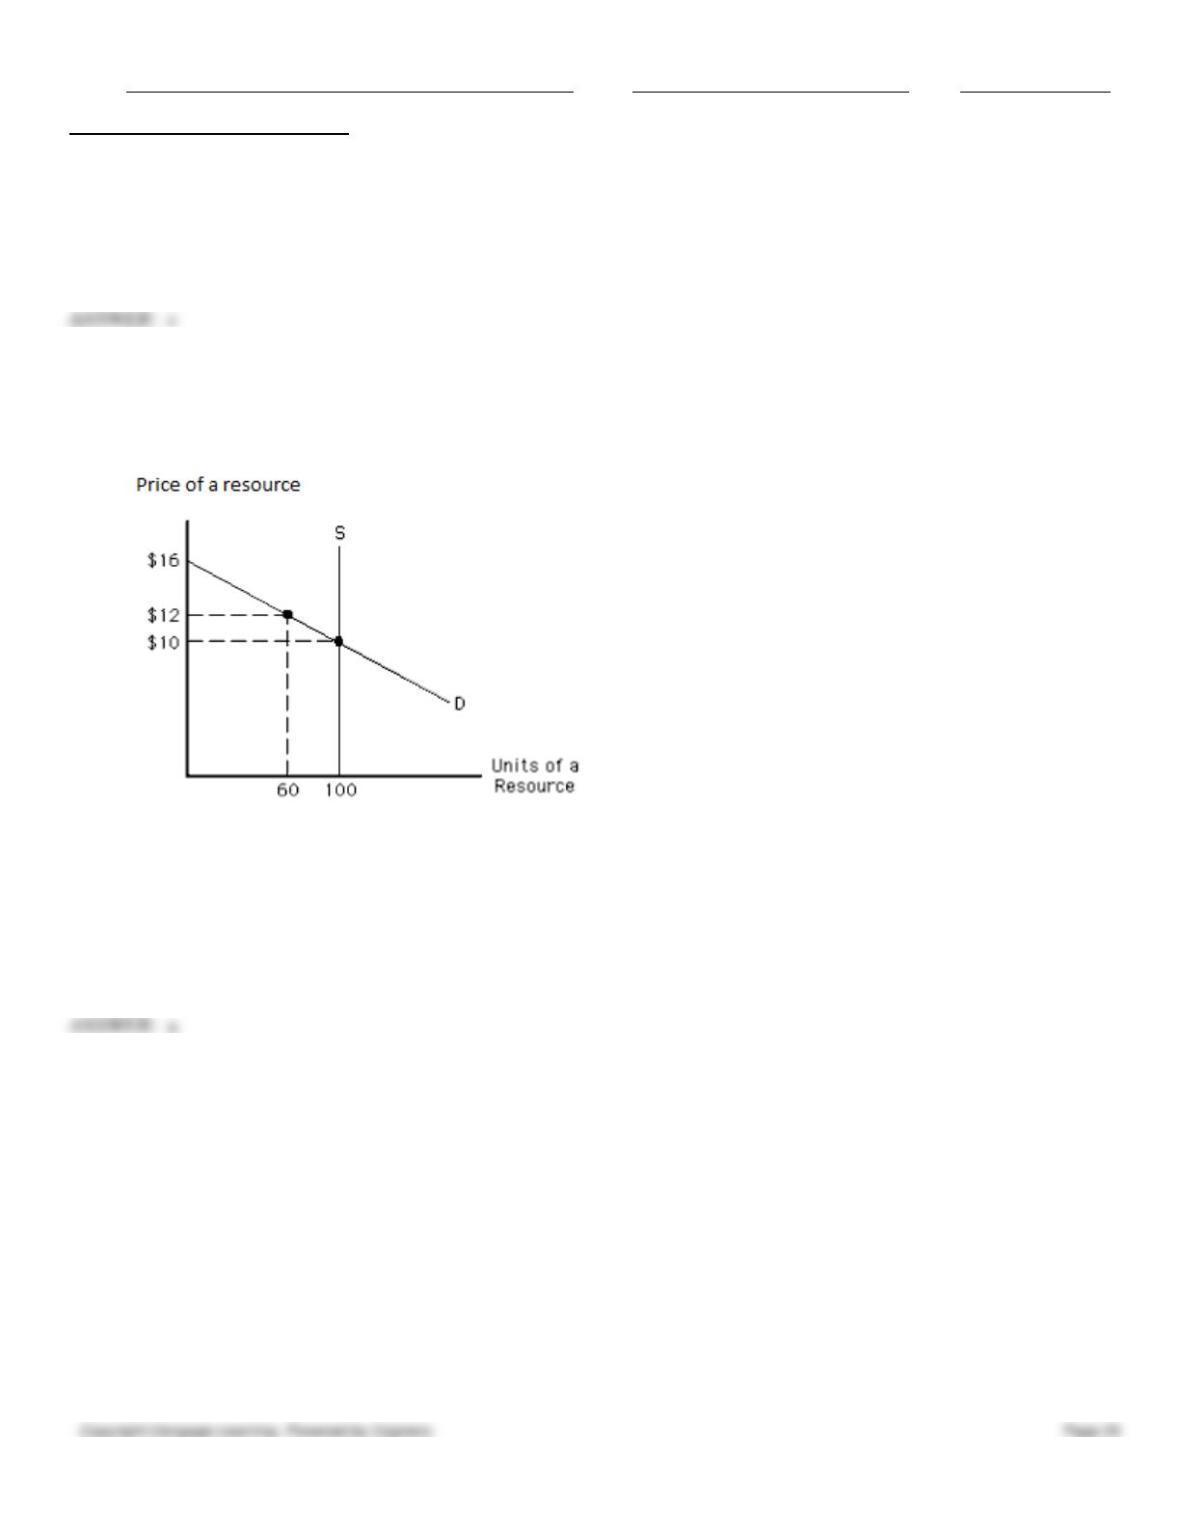
78. The following graph shows the demand and supply curves of a resource. The total resource earnings in equilibrium
equal _____.
Figure 11.3
a.
$12
b.
$10
c.
$720
d.
$1,000
e.
$1,200
79. The following graph shows the demand and supply curves of a resource. The economic rent in equilibrium equals
_____.
Figure 11.3
Name:
Class:
Date:
Chapter 11: Resource Markets
a.
$6
b.
$120
c.
$1,000
d.
$300
e.
$1,300
c
80. The following graph shows the demand and supply curves of a resource. The opportunity costs of the resource in
equilibrium equal _____.
Figure 11.3
a.
$0
b.
$120
c.
$1,000
d.
$300
e.
$1,300
a
81. The following graph shows the demand and supply curves of a resource. The equilibrium price of the resource is
_____.
Figure 11.4

Name:
Class:
Date:
Chapter 11: Resource Markets
a.
$16
b.
$12
c.
$10
d.
less than $10
e.
between $16 and $10
82. The following graph shows the demand and supply curves of a resource. The equilibrium amount of the resource
exchanged in the market is _____.
Figure 11.4
a.
more than 100 units
b.
100 units
c.
60 units
d.
less than 60 units
e.
between 60 and 100 units
83. The following graph shows the demand and supply curves of a resource. Which unit of the resource is earning the
highest economic rent?
Figure 11.4

Name:
Class:
Date:
Chapter 11: Resource Markets
a.
The second unit
b.
The first unit
c.
The sixtieth unit
d.
The hundredth unit
e.
The fifth unit
a
84. The following graph shows the demand and supply curves of a resource. The total resource earnings in equilibrium
equal _____.
Figure 11.4
a.
$12
b.
$10
c.
$720
d.
$1,000
e.
$1,200
85. The following graph shows the demand and supply curves of a resource. The economic rent in equilibrium equals
_____.
Figure 11.4
Name:
Class:
Date:
Chapter 11: Resource Markets
a.
$0
b.
$120
c.
$1,000
d.
$300
e.
$1,300
a
86. The following graph shows the demand and supply curves of a resource. The opportunity cost of the resource in
equilibrium equals _____.
Figure 11.4
a.
$0
b.
$120
c.
$1,000
d.
$300
e.
$1,300
c
87. Economic rent is:
a.
the opportunity cost of a resource.
b.
the payment to a resource in excess of its opportunity cost.
c.
the marginal revenue product of a resource.

Name:
Class:
Date:
Chapter 11: Resource Markets
d.
the total earnings of a resource.
e.
the marginal cost of a resource.
88. A game show host who gave up his job as a teacher earns $300,000 every month as a host. As a teacher, he used to
earn a salary of $50,000 every month. Which of the following is true in this case?
a.
His economic rent is $250,000, and his opportunity cost is $50,000.
b.
His economic rent is $50,000, and his opportunity cost is $250,000.
c.
His economic rent is $50,000, and his opportunity cost is $300,000.
d.
His economic rent is $300,000, and his opportunity cost is $50,000.
e.
His economic rent is $300,000, and his opportunity cost is $350,000.
89. The more elastic the supply of a resource, _____.
a.
the greater the economic rent as a proportion of total earnings
b.
the greater the opportunity cost as a proportion of total earnings
c.
the fewer the alternative uses the resource has
d.
the greater the derived demand for the resource
e.
the lower the derived demand for the resource
90. Which of the following resources earns the highest economic rent as a proportion of total earnings?
a.
A resource specialized in one task
b.
A nonspecialized resource
c.
A resource with inelastic demand
d.
A resource with low demand
e.
A resource with elastic demand
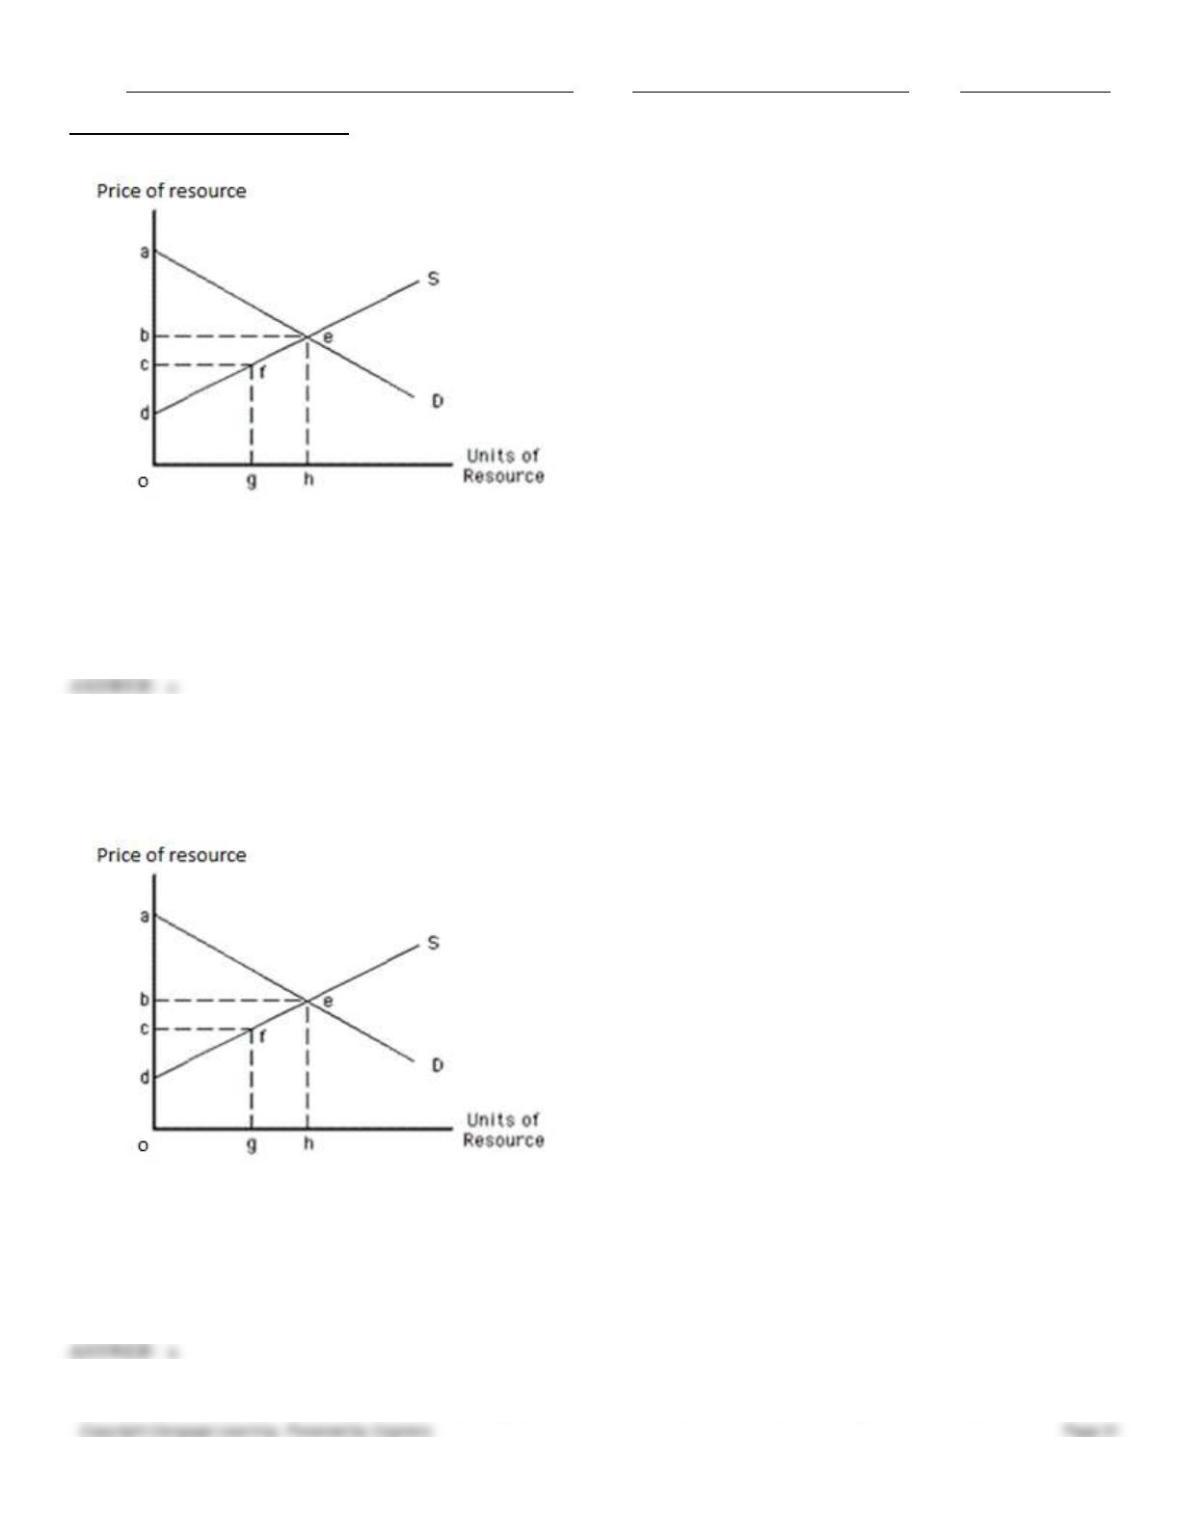
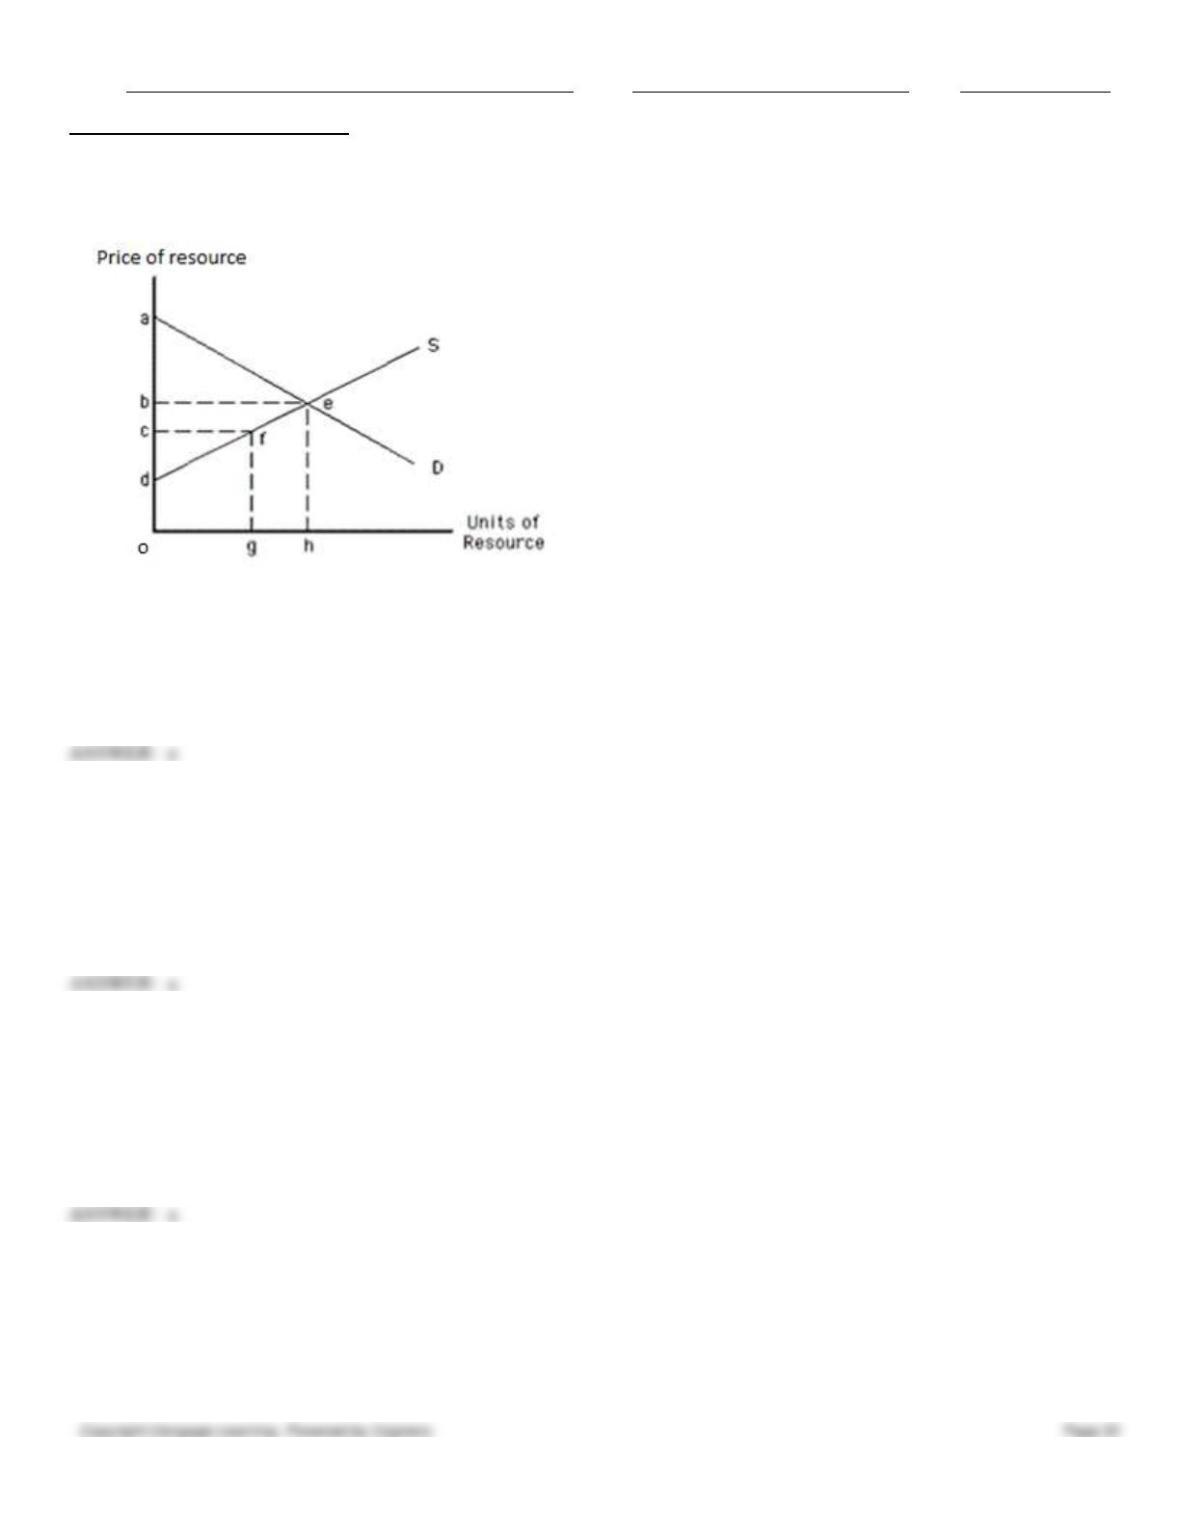
91. The following graph shows the demand and supply curves of a resource. The economic rent of the resource in
equilibrium is represented by the area _____.
Figure 11.5
Name:
Class:
Date:
Chapter 11: Resource Markets
a.
abe
b.
befc
c.
gfeh
d.
cdf
e.
bed
e
92. The following graph shows the demand and supply curves of a resource. The opportunity cost of the resource in
equilibrium is represented by the area _____.
Figure 11.5
a.
odeh
b.
gfeh
c.
dcf
d.
bed
e.
bed + odeh
a
93. The following graph shows the demand and supply curves of a resource. The total earnings of the resource in
Name:
Class:
Date:
Chapter 11: Resource Markets
equilibrium is represented by the area _____.
Figure 11.5
a.
odeh
b.
bed
c.
dcf
d.
ocfg
e.
bed + odeh
e
94. A resource that earns only economic rent:
a.
cannot be employed in any other line of production.
b.
has an upward-sloping supply curve.
c.
has an downward-sloping supply curve.
d.
has a marginal revenue product lesser than its marginal cost.
e.
has a perfectly elastic supply curve.
a
95. If the supply of a resource is fixed, then the resource’s total earnings equal:
a.
its economic rent.
b.
its economic profit.
c.
its marginal revenue cost.
d.
its marginal revenue product.
e.
its opportunity cost.
a
96. A resource’s marginal product is:
a.
the revenue produced by one additional unit of that resource, other things constant.
b.
the total output produced by one unit of that resource, other things constant.
c.
the additional output produced by one additional unit of that resource, other things constant.
d.
the total output divided by the number of units of that resource employed.

Name:
Class:
Date:
Chapter 11: Resource Markets
e.
the total output times the number of units of that resource employed.
97. Suppose ten pretzels are sold at a price of $8 each and the marginal product of the last unit of labor required to
produce pretzels is 5 units. The total revenue of the firm producing pretzels is _____.
a.
$80
b.
$30
c.
$50
d.
$6
e.
$150
98. Suppose 15 workers produce 100 license plates, 16 workers produce 120 license plates, and 17 workers produce 130
license plates. Identify the correct statement.
a.
Diminishing marginal returns have not set in because the marginal product is positive.
b.
The marginal product of the seventeenth worker is 130.
c.
Diminishing marginal returns must begin with the sixteenth worker.
d.
The marginal product of the sixteenth worker is greater than the marginal product of the seventeenth worker.
e.
The marginal product of the fifteenth worker must be 20.
99. If 14 workers produce a total of 25 cabinets and 15 workers produce a total of 30 cabinets, then:
a.
the marginal product of the fifteenth worker is 2 cabinets.
b.
the marginal product of the fifteenth worker is 5 cabinets.
c.
the marginal product of the fifteenth worker is 30 cabinets.
d.
the marginal product of the fifteenth worker is $5.
e.
diminishing returns begins with the fifteenth worker.
100. If a firm is experiencing diminishing marginal returns, then _____.
a.
total output decreases as all resources are increased
b.
total output decreases as all resources are decreased
c.
total output decreases as one variable resource is increased, other things constant
d.
additional increments of output diminish as one variable resource is increased, other things constant
e.
additional increments of output diminish as all variable resources are increased
101. Suppose 2 froyo machines and 12 workers produce eight quarts of froyo. If the marginal product of the thirteenth
worker is two quarts, then which of the following is true?
a.
Thirteen workers produce ten quarts of froyo.
b.
Thirteen workers produce two quarts of froyo.
c.
The thirteenth worker alone produces ten quarts of froyo.
d.
Thirteen workers produce six quarts of froyo.
e.
The diminishing marginal returns begin with the thirteenth worker.
Name:
Class:
Date:
Chapter 11: Resource Markets
a
102. Suppose the marginal product of the second worker hired by a firm is 3 units and the price of the last unit produced is
$7. Which of the following is true of the marginal revenue product of the second worker?
a.
It equals $21.
b.
It is less than or equal to $21.
c.
It is greater than $21.
d.
It equals $21 only if the firm is a price maker.
e.
It equals $7.
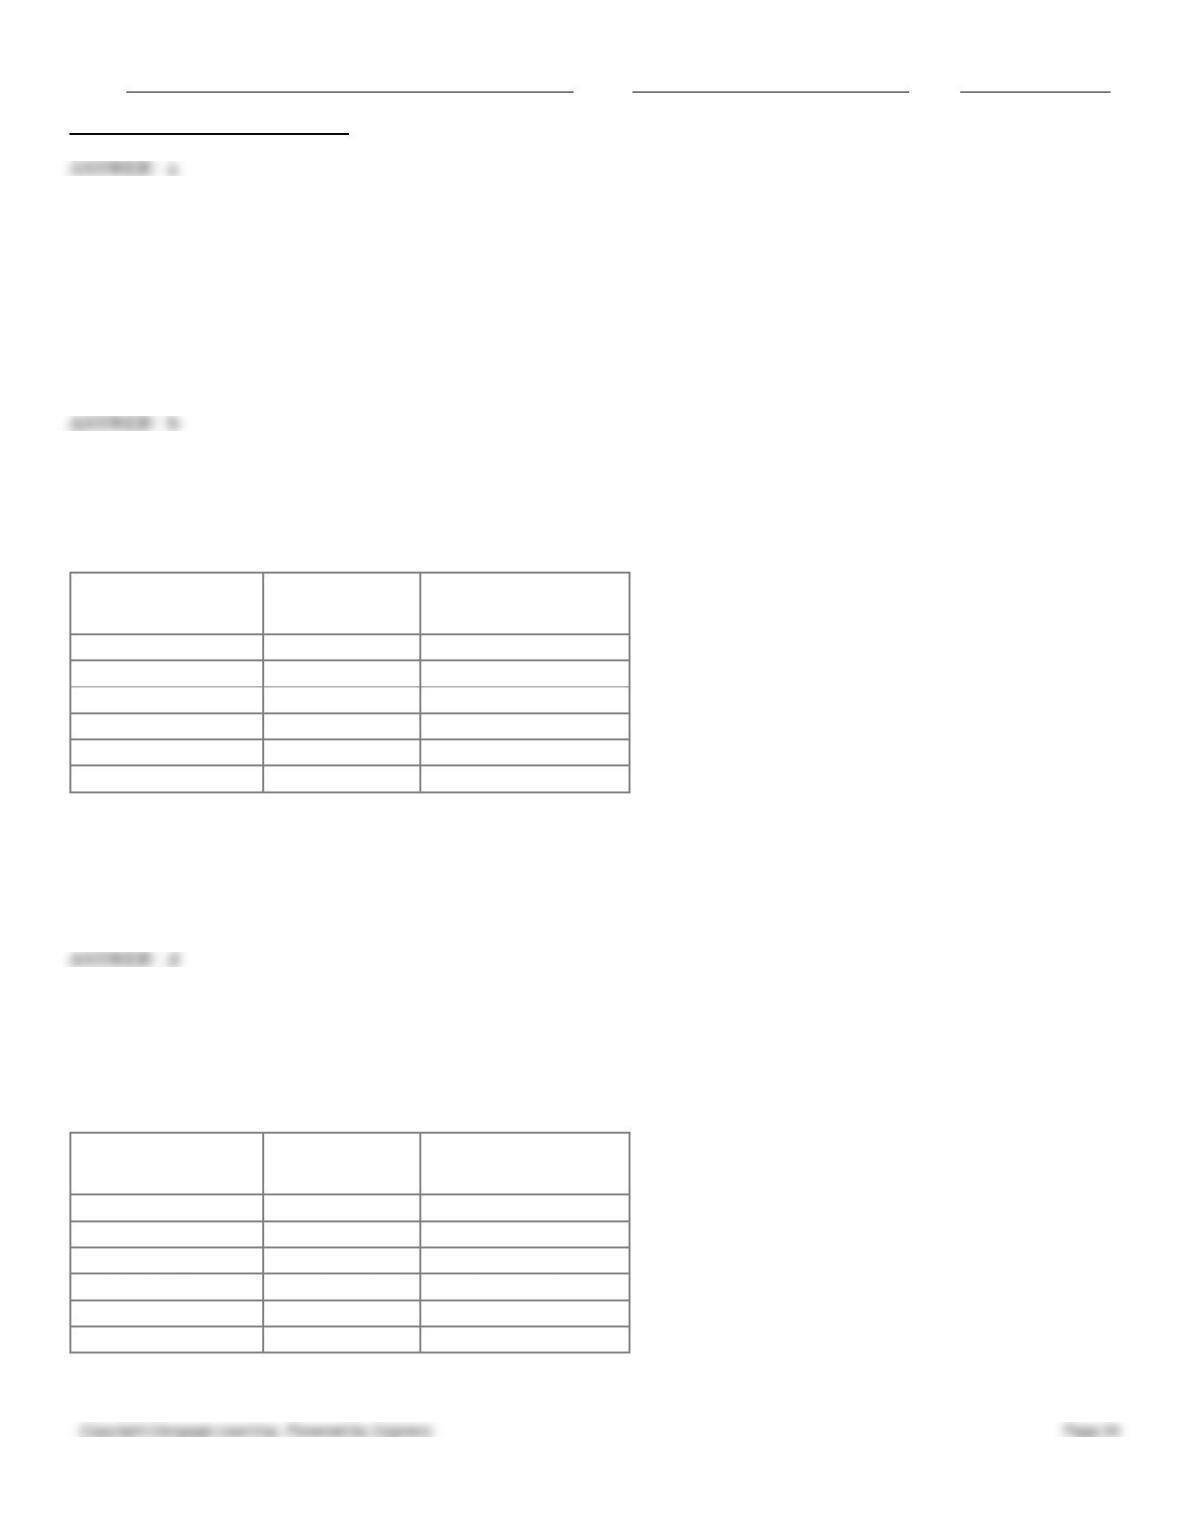
103. The following table shows the product price of a perfectly competitive firm and the output produced by the firm.
From the table, it can be said that the marginal product of the third machine is _____.
Table 11.1
Machines
Output
Product Price ($)
0
0
3
1
7
3
2
12
3
3
15
3
4
17
3
5
18
3
a.
$3
b.
5 units
c.
15 units
d.
3 units
e.
$2
104. The following table shows the product price of a perfectly competitive firm and the output produced by the firm.
From the table, it can be said that diminishing marginal returns become first evident with the addition of the _____
machine.
Table 11.1
Machines
Output
Product Price ($)
0
0
3
1
7
3
2
12
3
3
15
3
4
17
3
5
18
3
a.
first
b.
second